
Practical Contemplation of Nexus between Agriculture Taxation and Agriculture Output Share: A Case of Pakistan


Research Article
Practical Contemplation of Nexus between Agriculture Taxation and Agriculture Output Share: A Case of Pakistan
Usman Shakoor1, Ali Nasir2, Mudassar Rashid1, Muhammad Iftikhar-ul-Husnain1, Nabila Khurshid1 and Zuhair Husnain2
1Department of Economics, Comsats University, Islamabad, Pakistan; 2Pir Meher Ali Shah Arid Agriculture University, Rawalpindi, Pakistan.
Abstract | The indifference and dereliction of Pakistan’s legislators in formalizing an agricultural tax regime has unequivocally induced critical structural weaknesses in the fiscal machinery. Addressing the concern, the study has analysed the impact of agriculture taxes on the share of agriculture GDP of Pakistan and empirically investigated the long run relationship between the variables using time series data for last 23 years. It was empirically evaluated that increase in agriculture taxes led to a decrease in agriculture share of GDP. 1% increase in in the level of agricultural income tax decreased share of GDP by 0.073%. Whereas increase in land tax revenue had a significant positive effect on the agriculture share of GDP. Exempting agriculture income tax would give respite to agriculture community as done in china, where zero agriculture income tax was applied in practical. However, if income tax must be made functional then that tax rates should be revised in accordance with the income potential of agriculture lands; large land holdings be taxed, shares of the collected tax at district level should be spent on provision of local services which, in return, would help farmers increase income leading to higher income tax revenue.
Received | December 17, 2017; Accepted | May 29, 2018; Published | July 07, 2018
*Correspondence | Usman Shakoor, Department of Economics, Comsats University, Islamabad, Pakistan; Email: usman.shakoor@comsats.edu.pk
Citation | Shakoor, U., A. Nasir, M. Rashid, M.I. Husnain, N. Khurshid and Z. Husnain. 2018. Practical contemplation of nexus between agriculture taxation and agriculture output share: A case of Pakistan. Sarhad Journal of Agriculture, 34(3): 526-532.
DOI | http://dx.doi.org/10.17582/journal.sja/2018/34.3.526.532
Keywords | Agricultural tax, Agriculture share of GDP, Land revenue, Johansen cointegration
Introduction
A good tax system is one that is fair, adequate, simple, transparent and administratively facilitative to adopt and comply with. Taxes are levied at different percentage rates, which are determined by comparing income with consumption level. The percentage rates need to be set up in such a way that they minimize taxpayer’s compliance costs and government’s administrative cost, while also discouraging tax avoidance and evasion (Bofah, 2003). Taxes have a long history as taxes have long been used by different empires and civilizations in many forms as in ancient Egypt, where cooking oil was subject to tax which was collected by Scribes (name given to tax collectors). In Greece, the Athenians in war times collected tax named “eisphora” and no one was exempted from it. In Colonial America, Americans used to pay taxes which were enforced in shape of Sugar Act in 1764 on molasses, wines and other commodities. There has been evidence of agriculture taxes, for example, China in the past has been an agrarian economy and tax collected from this sector has contributed generously towards the fiscal budget. In early days when People’s Republic of China was founded in 1949, forty percent of the fiscal income was due to the agricultural tax. But the country has diverted itself towards an industrial economy in recent years, and as a result, the contribution of agricultural tax diminished to only 2.6 percent of the fiscal income in 2002. At the turn of the century, some key reforms were designed to make the agricultural tax system efficient and contributive. In the first stage, tax-for-fee reform was introduced from 2000 to 2003, so that all the fee-costs in rural China were removed. Stage two ended with the termination of agricultural taxation in 2005, putting an end to the 2600 years-old agricultural tax (Wang, 2009). The neo-classical theory based on the postulation that the state is compelled to eliminate hindrances for the working of free market; that taxes must be small in magnitude; and that exemptions should be provided to corporations, as high levels of taxation would hamper economic workings and would absorb the investment, which would result in economic recession (http://taxationmoldova.blogspot.com). It was recommended that taxes should be increased in such a manner that individuals are fairly placed against these taxes and should also help in promoting economic decisions (Anastassiou and Dritsaki, 2005). The past literature largely depicts that a high level of taxation trims down economic growth process. Enthusiasts of tax reduction emphasized that decrease in the tax rate will guide to healthier economic growth, which in reply generates tax revenues (Keho, 2011).
The issue of agriculture tax has been highly debated in empirical literature. Agriculture and economic growth connections were critically analysed by (Anderson and Bruckner, 2012) in Sub-Saharan Africa showing that dismal growth performance of Sub-Saharan Africa’s agrarian economies over the past half century, providing an important case study for exploring whether (and by how much) distortions to agricultural incentives have slowed economic growth. (Rajaraman, 2004) empirical investigation showed that every one percent increase in the share of agriculture value addition lowers the tax/GDP ratio by a little over one-third of one percent, after controlling for shares of imports and services and argued that agriculture can become possible, if never easy, to tax if it is attempted at the lowest, local level of sub national government. Nasim (2012) estimated potential in Punjab province of crop farming sector for tax revenue using tax rates of finance bill 2012 of Rs 16-20 billion in 2009-10, without any difference in average yield per acre small and large farmers using tax revenue of country would be 80-115 billion compared to 529 billion of direct taxes from non-agriculture sector in 2009-10.
Agriculture taxes have strong impacts on crop yields in Africa particularly for cocoa and cotton. Decrease in taxation was anticipated to be better towards increase in productivity. African countries are taxed because of the public debt and inflation levels which indicate that increases in inflation and public debt (as a percentage of GDP) leads to increases in taxation ultimately reducing subsidies to the total population and the share of the rural population shape agricultural pricing policies, and that more democratic countries tax agriculture less (Malan et al., 2016)
The growth of Pakistan agriculture sector has been dismal over the previous few years and its share in total Gross Domestic Product (GDP) has been gradually decreasing which need drastic reforms as sometimes they have strong macroeconomics growth effects. However, policy makers in Pakistan are divided on the importance of agriculture tax in the context of its overall impact on the economy. Despite being the major share of Pakistan economy, share of agriculture taxes in total revenues is just 1% (GoP, 2011). In Pakistan no reliable study has been found which provides empirical evidence on the role of agriculture taxes on agriculture share in GDP in Pakistan except Chaudhry (2001) who suggests appropriate tax policy for agriculture in Pakistan based on the experiences of developed countries.
Agricultural taxation in Pakistan
Taxing agriculture sector in Pakistan is a burning issue. In Pakistan, land tax or land revenue was the first tax collected since the independence. Agricultural income tax was first introduced by Zulfqar Ali Bhutto’s government in 1977 through Finance Act 1977, but this agricultural income was let off by the military establishment through an ordinance called Income Tax Ordinance in 1979. To understand the pros and cons of agricultural taxation, commissions and committees were established, called Fact Finding Committee on Agricultural Taxation 1963, The National Taxation Reforms Commission (1972, 1986) and the Report of the Prime Minister Committee on Tax Reforms 1990, etc. The proposals of such committees and commissions were not implemented. Agricultural income tax is a provincial matter. In line with Constitution obligations, provincial governments promulgated their own income tax ordinances in 1990’s, which were further amended in 2000 in which two schedules of taxation were offered: the rates for land taxes and the progressive agricultural income taxes. Table 1a,Table1b and Table1c disscuses the land revenues rates in three provinces of Pakistan i.e. Punjab, Sindh and khyber Pukhunkhawa. Land revenue rate are different in all the three provinces as this has become totally provincial matter.
Table 1 a: Land revenue rates in Punjab, Pakistan.
| Land ownership (In Acres) | Tax per acre |
| Up to 12.5 | No tax |
| 12.5-25 | Rs.100 |
| 26-50 | Rs.250 |
| 50 or more | Rs.300 |
(Haq, I. and H. Bukhari. 2011).
Table 1 b: Land revenue rates in Sindh, Pakistan.
| Land ownership (In Acres) | Tax per acre (per anum) |
|
Less than 4 acre (irrigated) Less than 8 acres(non-Irrigated) |
No tax |
| Greater than 4 acres (irrigated) | Rs.200 |
| Greater than 4 acres (non-irrigated) | Rs.100 |
| Mature Orchard(Irrigated) | Rs.700 |
| Mature Orchard (non- irrigated) | Rs. 350 |
(Haq, I. and H. Bukhari. 2011).
Table 1 c: Land revenue rate in KPK, Pakistan.
| Land ownership (In Acres) | Tax per acre |
| Up to 5 | No tax |
| 5-12.5 | Rs.225 |
| More than 12.5 acres | Rs.340 |
| Orchard | Rs.900 |
(Haq, I. and H. Bukhari. 2011).
Table2a and Table 2b shows the progressive tax rates on agriculture incomes where the rates for Punjab and Sindh are similar but Khyber Pukhunkhawa has different progressive tax rates. The agricultural sector performs as a standing pillar of the economy of Pakistan. The sector contributes almost 22 percent to the national GDP, but its share in tax revenue is only 1 percent (Tables 3). Nevertheless, the agricultural sector is regarded as a sorry tale of stagnation of Pakistan due to the lack of infrastructure and elements necessary for the development and progress of the agricultural sector. The agricultural sector contributed, on average, 22 percent to the national GDP and absorbed on average 44 percent of labour force, during the last 8 years. The growth rate of the agricultural sector was 2.12 percent which shows a decrease from 2.88 percent in 2012-13, whereas the growth rate of the industrial sector was 5.8 percent, an increase against 1.4 percent in 2012-13. The sectoral contribution to the GDP was 21 percent in 2013-14. The growth of the services sector was at the rate of 4.3 percent in 2013-14 as compared to 4.9 percent in previous year 2012-13 (GoP, 2014).
Table 2 a: Progressive tax rates in Punjab and Sindh, Pakistan.
| Income | Progressive tax rates in Punjab | Progressive tax rates in Sindh |
| Less than Rs.80, 000. | Nil | Not applicable |
| Between Rs. 80, 000-100, 000. | 5 % -5000. | 5 % -5000. |
| Between Rs.100, 000-200,000. | Rs.5000+7.5%on above Rs.100, 000. | Rs.5000+7.5%on above Rs.100, 000. |
| Between Rs 200,000-300,000. | Rs.12, 500+12.5% on above Rs.200, 000. | Rs.12, 500+12.5% on above Rs.200, 000. |
| More than 300,000. | Rs.22,500+15% on above Rs.300,000 |
Rs.22,500+15% on above Rs.300,000 |
(Haq, I. and H. Bukhari. 2011)
Table 2 b: Progressive tax rates in KPK, Pakistan.
| Income | Tax |
| Less than 400,000 | No tax |
| Between Rs.400, 000-550000 | 5% of the amount exceeding 400000 |
| Between Rs.550, 000-750,000. | Rs 7500 plus 7.5 % of the amount exceeding 550,000 |
| Between Rs.750, 000-950,000. | Rs 22500 plus 10 % of the amount exceeding 750,000 |
| Between Rs.950, 000-110,000. | Rs 42500 plus 15 % of the amount exceeding 950,000 |
| More then 1100,000 | Rs 65000 plus 17.5 % of the amount exceeding 110,000,0 |
(Haq, I. and H. Bukhari. 2011)
Table 3: Contribution of different sectors in 2009-10.
|
|
Contribution to (in %) | ||
| GDP | Growth | Taxes | |
| Agriculture | 22 | 10 | 1 |
| Industry | 25 | 30 | 63 |
| Services | 53 | 60 |
26 |
Source: Federal Bureau of Statistics, Federal Board of Revenue.
From the above figures, it is understandable that economic policy makers have not been consistent in structuring agricultural income taxes. There persists an uncertainty whether or not agricultural income taxes are helpful in accelerating economic growth and reducing fiscal deficit of the country. The questions arise that what would be the impacts of agriculture taxation on the growth of Pakistan’s economy; whether the taxation has a positive effect on the economic growth and what would be the suitable tax policy that can be adopted in the future that makes the economy stronger and healthier on whole. This study fills this gaps by investigating long run relationship between share of agriculture in GDP and agriculture taxes using Johansen co integration technique. This study is important in the sense as it is expected to provide empirical evidence to the policy makers and implementers on the importance of agriculture tax in Pakistan. The objective of this paper is to evaluate the impact of agriculture taxes on Share of Agricultural GDP in Pakistan.
Materials and Methods
To analyse the impact of agriculture taxation on share of agriculture GDP of Pakistan the co-integration analysis has been done.
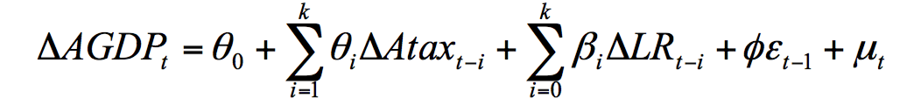
The econometric model is as follows;

Where
AGDP: Share of agricultural in Gross Domestic Product (Millions Pakistani Rupee); Atax: Agriculture income tax (Millions Pakistani Rupee); LR: Total Land Revenue (Millions Pakistani Rupee); Dummy takes 1 when agriculture income tax is used and 0 when Usher is used, t indicates years and the µ is the error term.
Data for the variables included in the study were collected from different sources: Economic Survey of Pakistan, International Monetary Fund and Fiscal Reports of Ministry of finance and Federal Bureau. The data included for estimation is for the period of 1982 to 2015 due to availability. All the variables are used in the logarithmic form except dummy variable. Before the analyses of time series data, it is standard practice to check the properties of the data. A time series variable should be stationary, as it is the statistical standard property of the OLS. This study employed the Augmented Dickey-Fuller (ADF) (Dickey and Fuller; 1979, 1981) test to check the stationarity of the data. This test is considered as the basic test for the order of integration of the time series data.
Although first differencing removes the problem of non-stationarity but it also removes the long run information which is very useful for economic analysis. (Granger, 1986) presented the concept of long run equilibrium relationship between two or more variables when they have a common trend. According to (Granger, 1986) this relationship exists when the linear combination of two non-stationary variables is stationary. (Engle and Granger, 1987) proposed a test but later it was found biased to the finding of stationary error.
To overcome the limitations of Engle–Granger (EG) cointegration procedure a number of methods have been developed. Johansen is one of the most popular alternative methods of cointegration. This method is considered as the generalization of DF procedure to multivariate analysis. The Johansen procedure equation is as under:
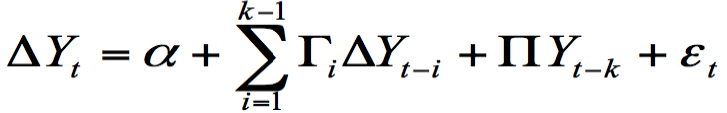
Where
Y: Column vector of m variables; Γ and Π: Coefficient matrices; Δ: Difference operator; k: Lag length.
δ: Constant; εt: Error term.
Once the Co-integration in the variables is found, (Engle and Granger, 1987) states that error correction model should be constructed. The error correction model also includes error correction term which used to investigate the model dynamics behaviour. The Error Correction model is as follows;
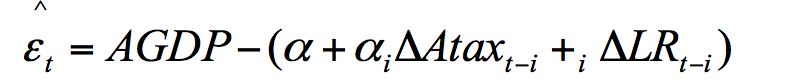
Where
Δ: Difference; φ: Coefficient of error correction term;
εˆt -1 :Error correction term; μt :Residual; k: Optimum number of lags of the variable.
Results and Discussion
Unit root testing
Table 4 below presents results for ADF test of unit root or stationarity testing. From results it is clear that all the variables fail to reject the null hypothesis of unit root (non-stationary) at level. The finding confirms that agricultural share of GDP, agricultural tax and land revenue are stationary after taking first differencing. With that conclusion, we can run the Johansen cointegration test and error correction modelling as our all variables are integrated at same order that is I(1).
Table 4: Augmented dickey fuller unit root test.
| Variable | At Level | At Difference | Order of Cointegration | ||
| t-Statistics | MacKinnon P-value | t-Statistics | MacKinnon P-value | ||
| AGDP | -0.038255 | 0.9543 | -4.806451 | 0.0007 | I(1) |
| Atax | -1.389558 | 0.5723 | -5.139735 | 0.0003 | I(1) |
| LR | -0.211201 | 0.9882 | -6.949984 | 0.0001 | I(1) |
Long-run analysis: Cointegration test
Through unit root testing it is found that share of GDP, agricultural tax and land revenue are in levels non-stationary I (1) variables which shows that there is a possibility of existence of long-run relationship between the variables concerned. Keeping in view the focus of this research, we would like to know how the level of GDP reacts in the long-run to changes in the level of agricultural tax. To insight this relationship we used Johansen cointegration technique as it is found to have good powers as compare to other existing cointegration tests.
The Table 5 shows that the trace statistic and the maximum-eigen value statistic both allow for one cointegration vector which expresses that there exists a long-run relationship between the economic growth and agricultural tax.
Table 5: Results of cointegration test.
| Max Rank | Eigen Values |
λ trace |
P-value |
λ max |
P-value |
| 0 | 0.710038 | 69.56183 | 0.0154 | 32.18814 | 0.0490 |
| 1 | 0.619938 | 37.37368 | 0.1605 | 25.15297 | 0.0611 |
| 2 | 0.239058 | 12.22071 | 0.7965 | 7.103137 | 0.8936 |
| 3 | 0.178670 | 5.117574 | 0.5796 | 5.117574 |
0.5796 |
| Normalized cointegrating coefficients (SE in parentheses) [tvalues] | |||
| AGDP | Atax | LR | Dummy |
| 1.000000 | 0.072719 | -0.134525 | -0.506621 |
| (0.01598) | (0.06405) | (0.07469) | |
| [4.550626] | [-2.10039] |
[-6.78297] |
|
When we look at the cointegration vector equation it depicts that all the variables got expected signs. It also tells that there is negative long-run relationship between the GDP and the agricultural tax.
It is apparent from the Table 6 that 1% appreciation in the level of agricultural tax the level of agricultural share of GDP decreases by 0.073% and this result is also statistically significant, whereas when land revenue appreciated by 1% the level of agricultural share of GDP increases by 0.134%. Thus, it is clear that in the long run, the impact of land revenue on GDP is greater than the impact of agricultural income tax on economic growth. We used a constant dummy variable in our equations to test for a structural break due to the implication of tax on agriculture. We used a dummy that is 1 from 1996 to 2009 and zero otherwise. The statistically significant dummy variable tells that there is structural shift after imposing the agricultural tax from year 1996.
Short-run analysis: Error correction model
Although the focus of this research is to see the long-run impact of the agricultural tax on the agricultural share of output and the above tests just proved that the agricultural tax, land revenue and share of agricultural output are co-integrated hence means that there is long term relationship between the variables. But the regression can be disequilibrium in the short-run because of the variables move off from the equilibrium in the long-term regression model. Vector error correction mechanism is used to find the discrepancy in the two variables in the short-run.
| Variable | Coefficient | Std. Error | t-Statistic | P value |
| D(AGDP(-1)) | -0.151524 | 0.185844 | -0.815330 | 0.4240 |
| D(Atax(-1)) | -0.006991 | 0.008711 | -0.802496 | 0.4313 |
| D(LR(-1)) | -0.069910 | 0.055005 | -1.270966 | 0.2176 |
| ECM(-1) | -0.275207 | 0.08669 | -3.17445 | 0.0046 |
| C | -0.009376 | 0.009315 | -1.006577 |
0.3256 |
| Test | Statistic | P-value |
| Breusch-Godfrey Serial Correlation LM Test | 1.5289 | 0.2163 |
| Heteroskedasticity White Test | 2.3840 | 0.8812 |
| Heteroscedasticity ARCH Test | 4.1451 | 0.2462 |
| Jarque-Bera Normality Test | 0.9674 | 0.6164 |
Thus, keeping in mind that the purpose is to check whether the long run error correction variables really work in shot-run model rather than to build a realistic short-run model, the important findings are the sign of the error correction term which is found negative and statistically significant. The coefficient for error term is 0.275207 which shows the mean will revert to equilibrium 27% in the first year and so on.
Model validity: diagnostic testing
To validate our error correction modelling results the different diagnostic tests are implied. To see serial correlation Breusch-Godfrey Serial Correlation LM Test (Godfrey, 1978) is used. For existence of Heteroskedasticity White hetero Test (White, 1980) with no cross terms and ARCH test is used. To check the normality of the data the Jarque-Bera test (Jarque and Bera, 1987) is implied. The entire test battery has null hypothesis of non-existence of ailment. The following table shows that for the estimated vector error correction model none of the test is found rejected and so we can conclude that our model is facing none of the problem like ARCH, Heteroskedasticity, serial correlation and normality. At last, we used the CUSUM and CUSUMSQ tests (Page, 1954) to check the parameter stability. The following graphs (Figure 1) of the tests show that the estimated parameters are stable in the long run.
Conclusions
The taxing agriculture sector of Pakistan is very difficult as compared to taxing business incomes, corporation taxes etc. this study analysed the effect of agriculture taxes on the agriculture share of GDP. Increased agricultural taxation has produced negative effects on the agriculture share of GDP of Pakistan while taxing agriculture land led to increase in agriculture share. Wang (2009) also showed that abolishing the agricultural tax in China helped in increasing agricultural incomes of local farmers while reducing their non-agricultural income. Jafri et al. (2015) found negative relation between agriculture sector share and tax revenue in Pakistan. In a country like Pakistan, the agriculture sector is dependent on natural conditions and farming is therefore assumed to be a low-income activity. In this regard, an increase in agricultural income tax would lead to a decrease in agricultural tax revenue ultimately, and decrease its share in the total GDP. On the other hand, Nasim (2012) argued that there is a potential for gaining larger agricultural tax revenues than actually collected in Punjab province if taxation would have been done in the same manner as in other sectors of the economy. One attractive way to increase the agriculture income taxation is to apply taxes based on Produce Index Unit (PIUs). For this reason, new PIU’s should be calculated. Tax rates should be revised with reference to the income potential from agriculture lands, so that real agriculture incomes could rise. The revenue departments that collect agricultural income taxes are assumed to be an unsuitable vehicle for collecting these types of taxes. It would be essential to enhance the capacity of these authorities hence more proactive approach is needed by the government while taxing this sector. Study faces major constraint of data availability for different provinces on the variables that this study targets.
Author’s Contribution
Ali Nasir: Developed the basic idea of the study.
Usman Shakoor and Zuhair Husnain: Overall organized the whole research paper.
Mudassir Rashid and Muhammad Iftikhar Hussnain: Helped in data estimation and handling.
Nabila Khurshid: Helped in writing results and discussion.
References
Anastassiou, T. and C. Dritsaki. 2005. Tax revenues and economic growth: An empirical investigation for Greece using causality analysis. J. Soc. Sci. 1(2): pp. 99-104. https://doi.org/10.3844/jssp.2005.99.104
Anderson, K. and M. Bruckner. 2012. Distortions to agriculture and economic growth in Sub Saharan Africa. Presented at the annual meetings of the agricultural and applied economic association, Seattle. USA. https://doi.org/10.1596/1813-9450-6206
Bofah, K. 2003. The impact of tax on investment and business decisions. htttp://www.ehow.com/facts_5910416_impact-tax-investment-business-decisions.html.
Dickey, D.A. and W.A. Fuller. 1979. Distribution of the estimators for autoregressive time series with a unit root. J. Am. Stat. assoc. 74(366a): pp. 427-431. https://doi.org/10.1080/01621459.1979.10482531
https://doi.org/10.2307/2286348
Engle, R.F. and Granger, C.W., 1987. Co-integration and error correction: representation, estimation, and testing. Econometrica: j. Econometric Soc. pp.251-276.
Godfrey, L.G., 1978. Testing against general autoregressive and moving average error models when the regressors include lagged dependent variables. Econometrica: J. Econometric Soc. pp. 1293-1301.
Government of Pakistan. 2011. Pakistan Economic Survey (2010-11). Islamabad, Pakistan: Finance Division, Government of Pakistan.
Government of Pakistan. 2014. Pakistan Economic Survey 2013-14. Islamabad, Pakistan: Finance Division, Government of Pakistan.
Granger, C.W., 1986. Developments in the study of cointegrated economic variables. Oxf. Bull. Econ. Stat. 48(3): pp.213-228. https://doi.org/10.1111/j.1468-0084.1986.mp48003002.x
Jafri, A., A. Tabassum, F.R. Asjed. 2015. An empirical investigation of the relationship between trade liberalization and tax revenue in Pakistan. Pak. Econ. Soc. Rev. Volume 53, No. 2 (Winter 2015). pp. 317-330.
Jarque, C.M. and A.K. Bera. 1987. A test for normality of observations and regression residuals. Int. Stat. Rev. /Rev. Int. de Statistique. pp. 163-172.
Keho, Y. 2011. Tax structure and economic growth in Coste D Ivorie: are some taxes better than others Asia-Pac. Econ. Rev. 1 (4):226-235.
Malan, M., B. Ezra and B. Jetske. 2016. The impact of Tax and subsidies on crop yields- Agriculture Price distortions in Africa. PBL Netherlands Environment Assessment Agency
Nasim, A. 2012. Revenue estimates from land taxation in Pakistan. Working Paper No. 94-05. Centre For Management and Economic Research LUMS.
Page, E.S. 1954. Continuous inspection schemes. Biometrika, 41(1/2), pp.100-115. https://doi.org/10.1093/biomet/41.1-2.100
https://doi.org/10.2307/2333009
Rajaraman, I. 2004. Taxing agriculture in a developing country: A possible approach. Contrib. Econ. Anal. 268: 245-268. https://doi.org/10.1016/S0573-8555(04)68812-2
White, H. 1980. A heteroskedasticity-consistent covariance matrix estimator and a direct test for heteroskedasticity. Econometrica: J. Econ. Soc. pp.817-838.


