


Research Article
PCR Based Genetic Diversity in Common Bean (Phaseolus vulgaris) Landraces Collected from Malakand, Division, Khyber Pakhtunkhwa, Pakistan
Khan Sher1*, Muhammad Nisar2 and Muhammad Subhan1
1Shaheed Benazir Bhutto University, Sheringal, dir Upper, Khyber Pakhtunkhwa, Pakistan; 2University of Malakand, Chakdara, Khyber Pakhtunkhwa, Pakistan.
Abstract | Thirteen SSR markers were used for sixty local common beans landraces. Among all markers, only one was monomorphic, while the remaining were polymorphic. At average 2 alleles per locus were identified. The size of all alleles ranged from 210bp to 630 bp. Major allelic frequency fluctuated from 54.0% to 96.0%. An overall, the total No. of alleles per locus extended from 22 (PVBR 20) to 49 PvM053. Similarly, the frequency values oscillated from 0.06 of PVBR 20 to 0.14 of PvM053. The PIC values were ranged from 0.295 of PVBR 20 to 0.831 of PvM053. The Two Way Cluster dendrogram was conducted for 12 polymorphic SSR markers, which disseminated all common bean lines into two major linkages. Lineage I split at 50% similarity index into 5 clusters and sub clusters. On the same way lineage II split into two clusters at 19 % similarity index. The Genetic similarity (GS) based on SSR markers between pair of common bean lines showed high degree of dissimilarity in the genetic makeup ranging from 0.91 to 0.11. All the landraces of common bean collected from Malakand divisions KP, Pakistan, showed significant variations.
Received | October 13, 2018; Accepted | Febraury 25, 2019; Published | May 08, 2019
*Correspondence | Khan Sher, Shaheed Benazir Bhutto University, Sheringal, dir Upper, Khyber Pakhtunkhwa, Pakistan; Email: [email protected]
Citation | Sher, K., M. Nisar and M. Subhan. 2019. PCR based genetic diversity in common bean (Phaseolus vulgaris) landraces collected from Malakand, Division, Khyber Pakhtunkhwa, Pakistan. Sarhad Journal of Agriculture, 35(2): 579-586.
DOI | http://dx.doi.org/10.17582/journal.sja/2019/35.2.579.586
Keywords | Common beans, PCR, SSR markers, Genetic diversity
Introduction
Common bean (Phaseolus vulgaris) belonging to the family Fabaceae is a major pulse having proteins, carbohydrates, minerals and vitamins (Boye et al., 2010). It is considered as the poor men’s meat, particularly in less developed countries. It is extensively produced all over the world particularly in Asian, African and South American states (Wani et al., 2010). Hundreds of millions (500 million) of people in Latin America, Africa and other parts of the world, depend on common beans (Phaseolus vulgaris L.) as the main source of food (Krista et al., 1991). More than 19 million metric tons of common beans per annum are produced all over the world, of which Latin America produce 27%, Africa produce 10% and the remaining beans comes from other parts of the globe (FAO, 2000). It was domesticated independently in southern Andes and Meso-America that had resulted two gene pools in the two regions respectively (Burle et al., 2011).
Phaseolus is a diploid genus with 22 (2n) of chromosomes in majority of the species. However, some species possess 20 (2n) of chromosomes also (Gepts et al., 2008). Most genic loci are single copied hence common bean is considered suitable example for experimentation (Müller et al., 2014). Mok and Mok (1978) identified all the 11 chromosomes of somatic cells of common beans at the prophase stage and later on Cheng and Bassett (1981) identified the entire 11 chromosomes at the diplotene of meiosis in pollen mother cells of anther.
Current experiment was conducted to collect local common bean landraces and to quantify them using different SSR Markers. It is broadly known that the repetition of the simple sequence was first used by Hamada et al., (1982). These are short replicates scattered throughout the genome of eukaryotes (Tautz and Rinz, 1984). SSR markers are used to estimate gene diversity and chromosomal mapping due to high mutation and quality. According to Buso et al., 2006 and authors about 400 micro-satellite markers or SSR markers were developed and planned in the common beans. Therefore, molecular evaluation is recommended for the evaluation of germplasm because they provide corresponding information and increase the strength of analysis of genetic variability/ diversity (Gomez et al., 2004).
PCR technique was development by Kary Mullis in 1983 and is now widely used in molecular biology. This instrument is now modified accordingly and various computer programs have been used to amplify a few pieces of DNA into millions of number of copies of the DNA sequence. The PCR based technology is now widely used for different purposes such as DNA clone sequencing, DNA-based study of genes and diagnosing of critical genetic illnesses. Similarly, PCR is also used in documentation of fingerprints and detection of pathogens in DNA tests to diagnose infectious diseases.
Malakand division of KP, Pakistan is the most suitable area for bean crops. This activity was conducted at Sheringal dir upper, which is located between latitudes 35-04o to 35-46o north latitude and 710-32’ to 720-22’ east longitudes with height ranges from 1600 meters to 6000 meters above sea level. This valley has a luxuriant dense forest of conifers and other associated species and is center of wild medicinal plants like Morchella esculenta etc. This huge variation in altitude results in dramatic climatic changes in this region with a mild summer and a cold winter (Champion et al., 1973).
Materials and Methods
During 2014-2015 a number of investigative tours were settled to various ecological zones of Malakand division, North KP, Pakistan to collect seeds of common beans. Five Districts of Malakand division namely Dir Upper, Dir Lower, District Chatral, District Swat and District Shangla were selected for collecting common bean seeds. 60 landraces were collected from different parts of Malakand division as shown in Figure 1. Similarly, Thirteen SSR markers were used for this work against the genomic DNA of these beans land races having detail given in Table 1.
DNA was extracted from the seeds of 60 common beans landraces by the method devised by Doyle and Doyle (1987) with moderate alteration. In this method three seeds of each landrace were crushed separately. About 0.05 g of seed powder was taken in Eppendorf tube. 500 µL extraction buffers and 500 µl phenol solution having composition (Table 2 and 3) were added to the powder. The mixture of both extraction buffer and common bean seed powder was centrifuged thoroughly at 13000-14000 RPM (Revolution Per Minutes) for 13-15 minutes to separate the mixture into different layers. The supernatant was poured into a fresh tube and 50 µL sodium acetate (3 molar solutions) and 500 µL isopropanol was added. It was further centrifuged at 8000 RPM for 5-8 minutes to obtain the pellet at the bottom. This pellet was washed away with 70% ethanol and dried for further use. The pellet was rehydrated in 50 µL TE buffer (Table 4).
After DNA extraction, a specific amount of DNA was subjected to PCR along with PCR pre-max (2X PCR master kits were purchased of Wiz pure limited) with prescribed amount. For further PCR reaction, master max, DNA template (5 µL) and Primers (2.0 µL of each forward and reverse) was mixed (detail is given in the Table 6) and was subjected to PCR with specific thermocycling conditions of SSR reaction.
After PCR, the products were subjected to electrophoresis. For this purpose, vertical gel electrophoretic assembly was used for fractionating SSR markers by using 15% PAGE in electrode buffer as mentioned in the Figure 2. The PCR products were then loaded along with loading dye in a ratio of 5:1. The process of electrophoresis was continued for 60-90 minutes at 100-120V in electrode buffer solution (Table 5).
Table 1: Detail of markers with sequences used for PCR.
| Loci | Forward primer sequence (5’-3’) | Reverse sequence | Reference |
| SSR Markers | |||
| PVBR14 | TGAGAAAGTTGATGGG ATTG |
ACGCTGTTGAAGGCTCTAC | Busco et al 2006 |
| PVBR18 | GTTCTGCTTGCAGCATACC | AGAAACACAATCGGAAGAG | Busco et al 2006 |
| PVBR20 | TGAGAAAGTTGATGGGATTG | TACGCTGTTGAAGGCTCTAC | Busco et al 2006 |
| PVBR21 | GAAGAACCGCAAGT AGAGAAGT |
TAACATCAGACGCCGACGA | Busco et al 2006 |
| PVBR23 | GAACGGAGACATAACAGCCA | GAGGACCAACCAAACCAAGC | Busco et al 2006 |
| FJ20 | TTGGAACACCGTGGAATGGA | GAGGCTTTAGACGTTGGAGACA | Reis et al.,2007 |
| BMd70 | GCCAAGAAGATTCGCAAGTT | TCATACATGCTTTCCACACCTC | Blair et al 2012 |
| BMd75 | TTCTTCAAAATCCCTTA ATCACC |
TGCCACAATCCAAGCTTTAG | Blair et al 2012 |
| BMd82 | CCTCACCGTCATTCCACTCT | TTGCTGCCTCTGCTAATAACAA | Blair et al 2012 |
| BMd109 | TTCAGTGTGCAAATAACCAC | GCCAATGTAATGACTCAGAGA | Blair et al 2012 |
| EST-SSR Markers | |||
| PvM068 | CCATTACGTGTCCAAGGTCTC | CAAAAAGGAATCGGACTCTAGG | Hanai et al 2010 |
| PvM103 | CGAGAAAGAGAGAG AAGAGTTT |
GTGTTGGTGTGATGCTGAG | Hanai et al 2010 |
| PvM126 | AAATCCTCTTCCACCTTTG | AACACGCACACACAGACA | Hanai et al 2010 |
The gel was then stained with dilute solution of EthBr (Ethidium Bromide) with extra care. Gel documentation system (Gel Doc) was then used to view the gel and a photograph was taken for further comparing with 100 and 50 bp DNA ladder (Fermentas).
Scoreable bands on the photograph of gel documentation were measured as a single locus allele -1. Bands were recorded as bivariate (1-0), 1 designates the presence of the band and 0 for absence. The PIC (Polymorphism Information Content) value of SSR markers was valued by means of the standard equation.
PIC = 1- Σ (pi)2
Where;
pi = Frequency of ith allele in a population.
Table 2: DNA extraction Buffer composition.
| Chemicals | Quantity |
| SDS | 2g |
| Tris | 2.42g |
| NaCl | 1.16g |
| EDTA | 0.64g |
Table 3: Composition of phenol solution.
| Chemicals | Quantity |
| Phenol | 25ml |
| Isoamyl alcohol | 1ml |
| Chloroform | 24ml |
Table 4: TE buffer composition with quantities.
| Chemicals | Quantity | Procedure |
| Tris | 0.012g | All the components were dissolved it into 100ML distilled water and kept 4ºC temperature |
| EDTA | 0.037g |
| Chemicals | Quantity | Procedure |
| Tris | 54g | The whole components were dissolved into 1000ml distilled water |
| Boraic acid | 27g | |
| EDTA | 20ml(0.5M) or 3.72g |
Genetic similarity was calculated via Dice similarity index (Nei and Li, 1979). Dendrogram was constructed based on UPGMA (Unweighted Pair Group Method with Arithmetic Mean). Cluster analysis was structured based on PC-ORD software. Genetic similarity (GS) between the pair of bean lines was calculated according to Nei and Li’s index of similarity by the formula, with the help of NTSYS software (Rohlf, 1999).

Where;
GDxy = genetic distance;Dxy = number of common bands (loci) in two genotypes; Dx = number of bands (loci) in genotype 1; Dy = number of bands (loci) in genotype 2.
Different parameters like allelic frequencies at each locus, Gene diversity H value were calculated through Power Marker program version 3.25. The following formula was used for finding PIC (Polymorphism Information Content) value.
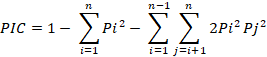
Where;
pi= the frequency of the earth allele and n= the number of alleles.
To find out the genetic linkage, each of the arithmetical data was transformed into numerical data with ‘1’ for presence and ‘0’ for absence of SSRs alleles. Chi-square (χ2) test was applied for Linkage analysis.
Results and Discussion
Out of Thirteen SSR markers, only one marker was monomorphic, while the remaining 12 exhibited polymorphism for sixty beans landraces. In average 2 alleles per locus were recognized, while the sizes of alleles varied from 210 to 630 bp. The frequency of allele extended from 53% to 97%.
The PIC values for all the data were measured that explained the ability of each SSR locus to distinguish between common bean landraces ranged from 0.295
of PVBR 20 to 0.831 of PvM053. The number of alleles per locus ranged from 22 (PVBR 20) to 49 (PvM053). Similarly, the frequency values ranged from 0.06 of PVBR 20 to 0.14 of PvM053 as shown in Table 6.
Table 6: No. of alleles, frequency and PIC value.
| Marker | No. Of allele | Frequency | Pic value |
| PVBR 20 | 22 | 0.06 | 0.295 |
| PVBR 21 | 22 | 0.06 | 0.335 |
| PVBR 23 | 28 | 0.08 | 0.549 |
| PVM068 | 29 | 0.08 | 0.549 |
| BMD 70 | 29 | 0.08 | 0.782 |
| BMD 75 | 30 | 0.08 | 0.806 |
| BMD 82 | 31 | 0.09 | 0.813 |
| BMD 109 | 39 | 0.11 | 0.819 |
| PVM 126 | 39 | 0.11 | 0.831 |
| PVM053 | 49 | 0.14 | 0.831 |
To define the genetic association among common bean lines, Euclidian distance method was applied as reproduced in Figure 3 and 4, based on 12 polymorphic SSR (simple sequence repeat) markers.
The dendrogram categorized all bean landraces into two groups (Lineage) i.e., L-I) and (L-II). Lineage-I split into 2 clusters (I and II) at distance 56%. Cluster-I (C-I) comprised 8 bean lines i.e. PV-6, PV-15, PV-16, PV-17, PV-18, PV-19, PV-20 and PV-24. Amongst all, PV-6, PV-17, PV-18, PV-20 and PV-24 comprised of 62.5% score were high yielding (≤ 60g/ plant), 37.5% (PV-15, PV-16, PV-19) of all the accessions were low yielding (≥ 60g/plant). Cluster-II (C-II) contains eight common bean lines i.e. PV-1, PV-2, PV-4, PV-8, PV-9, PV-10, PV-13 and PV-14. 37.5% landraces (PV-4, PV-9 and PV-10) were high yielding and 63% accessions (PV-1, PV-2, PV-8, PV-13 and PV-14) were low yielding. The cluster-III of Lineage-II consists of 8 common bean lines i.e. PV-3, PV-5, PV-7, PV-11, PV-12, PV-21, PV-22 and PV-23. Among all lines of cluster-III, PV-5 and PV-22 were found high yielding and the remaining were low yielding lines (Figure 4).
The genetic similarity (GS) based on SSR markers between pairs of bean lines were measured by means of Nei and Li’s similarity index having value less than 30% is given in the Table 7. This table showed that 70% dissimilarity in the genetic makeup. According to this analysis, S33 showed 70% variation with S3. S37 has 78% variation with S33. S39 has 78% dissimilarity with S37. S40 has 71% dissimilarity with S3, 98% with S10 and 78% dissimilarity with S37. S41 has 71% with S22. S42 has 85% with S11, 71% with S12 and 76% with S15. S43 has 73% dissimilarity with S10. S44 has 73% variation from S10, S45 has 71% dissimilarity with S10 and S12 and S24 and 73% with S25. S46 showed 83% variation from S11, 85% from s12 and 71% from S32. S47 showed 98% variation from S11 and 82% from S15. S48 showed 73% dissimilarity from S3, 98% from S11and 82% from S15. S49 showed 71% from S11 and 73% from S15. S52 has 98% variation from S10, 78% from S11 and 98% from S12. S54 showed 71% variation with S1, 82% with S2, 82% with S3, 75% with S5, 82% with S7, 71% with S10, 71% with S12, 71% with S15, 98% wit S16, 75% with S37 and 78% with S41. S56 showed 82 %with S2, 82% with S3, 75% with S5, 82% with S7, 75% with S10, 71% with S12, 71% with S15, 98 % with S16, 75% with S37, 78% with S41. S57 showed 73 % with S2, 88% with S5, 73% with S7, 75% with S10, 71% with S11, 75% to S12 and75% with S15. S58 showed 98 % with S5, 78% with S10, 75% with S11 and 78% with the S12. S59 showed 71 % variation with S1, 82% with S2, 82% with S3, 75% with S5, 82% with S7, 71% with S10, 71% with S12, 71% with S15, 98% with S16, 75% to S37 and78% with S41. And finally S60 showed 88% variation with S5, 71% with S7, 96 % with S10 and 78% with S11.
The main objectives of this work was to study diversity in common bean landraces collected from different parts of Malakand division, KP, Pakistan. The results showed that a huge diversity was observed in the landraces of common beans collected from this area. In genetic diversity the population is generally analyzed at the molecular base using various laboratory procedures. It includes enzyme or even DNA analysis that directly evaluates the levels of variation or diversity in population. Furthermore, genetic variation can also be calculated by using morphological profiling, biochemical description and other evaluation techniques (Mondini et al., 2009). The molecular characterization needs a number of molecular markers of DNA. These markers are used to analyze differences in DNA make up. Genetic markers of different genes have diverse genetic individuality. They may be dominant, and can inflate unknown sites. Similarly, they may contain known or unknown sequences (Mondini et al., 2009). In fact, the significance of genetic correlation or diversity in plants can be elucidated by the reality that they provide all sorts of information on genetic diversity and provide a platform for class sampling from different breeding groups (Mohammadi and Barasana, 2003). The genetic diversity can be used in plant
Table 7: Genetic similarity (GS) based on SSRs between a pair of common bean lines calculated using Nei and Li’s similarity index having value less than 0.30 extracted from table given in the appendix.
| Acc | S1 | S2 | S3 | S5 | S7 | S10 | S11 | S12 | S15 | S16 | S22 | S24 | S25 | S32 | S33 | S37 | S41 |
| S33 | -- | 0.29 | -- | -- | -- | -- | -- | -- | -- | -- | -- | -- | -- | -- | -- | -- | |
| S37 | -- | -- | -- | -- | -- | -- | -- | -- | -- | -- | -- | -- | -- | -- | 0.18 | -- | -- |
| S39 | -- | -- | -- | -- | -- | -- | -- | -- | -- | -- | -- | -- | -- | -- | -- | 0.18 | -- |
| S40 | -- | -- | 0.29 | -- | -- | 0.2 | -- | -- | -- | -- | -- | -- | -- | -- | -- | 0.18 | -- |
| S41 | -- | -- | -- | -- | -- | -- | -- | -- | -- | -- | 0.29 | -- | -- | -- | -- | -- | -- |
| S42 | -- | -- | -- | -- | -- | -- | 0.15 | 0.29 | 0.14 | -- | -- | -- | -- | -- | -- | -- | -- |
| S43 | -- | -- | -- | -- | -- | 0.27 | -- | -- | -- | -- | -- | -- | -- | -- | -- | -- | -- |
| S44 | -- | -- | -- | -- | -- | 0.17 | -- | -- | -- | -- | -- | -- | -- | -- | -- | -- | -- |
| S45 | -- | -- | -- | -- | -- | 0.29 | -- | 0.29 | -- | -- | -- | 0.29 | 0.27 | -- | -- | -- | -- |
| S46 | -- | -- | -- | -- | -- | -- | 0.17 | 0.15 | -- | -- | -- | -- | -- | 0.29 | -- | -- | -- |
| S47 | -- | -- | -- | -- | -- | -- | 0.2 | -- | 0.18 | -- | -- | -- | -- | -- | -- | -- | -- |
| S48 | -- | -- | 0.27 | -- | -- | -- | 0.2 | -- | 0.18 | -- | -- | -- | -- | -- | -- | -- | -- |
| S49 | -- | -- | -- | -- | -- | -- | 0.29 | -- | 0.27 | -- | -- | -- | -- | -- | -- | -- | -- |
| S52 | -- | -- | -- | -- | -- | 0.2 | 0.22 | 0.2 | -- | -- | -- | -- | -- | -- | -- | -- | -- |
| S54 | 0.29 | 0.18 | 0.18 | 0.25 | 0.18 | 0.29 | -- | 0.29 | 0.29 | 0.2 | -- | -- | -- | -- | -- | 0.25 | 0.22 |
| S56 | 0.29 | 0.18 | 0.18 | 0.25 | 0.18 | 0.29 | -- | 0.29 | 0.29 | 0.2 | -- | -- | -- | -- | -- | 0.25 | 0.22 |
| S57 | -- | 0.17 | -- | 0.22 | 0.17 | 0.25 | 0.29 | 0.25 | 0.25 | 0.18 | -- | -- | -- | -- | -- | -- | 0.2 |
| S58 | -- | -- | -- | 0.2 | -- | 0.22 | 0.25 | 0.22 | -- | -- | -- | -- | -- | -- | -- | -- | |
| S59 | 0.29 | 0.18 | 0.18 | 0.25 | 0.18 | 0.29 | -- | 0.29 | 0.29 | 0.2 | -- | -- | -- | -- | -- | 0.25 | 0.22 |
| S60 | -- | -- | -- | 0.18 | 0.29 | 0.4 | 0.22 | 0.2 | 0.2 | -- | -- | -- | -- | -- | -- | -- | -- |
breeding for various purposes, along with finding of genetic differences in plant species (Mohammadi and Prasanna, 2003) and the introduction of new genotypes from diverse genetic origins to the available genetic base (Thompson et al., 1998).
The study of genetic relation between pure lines is valuable in the crosses of particular lines to certain heterogeneous assemblages. Similarly, according to Hallauer and Miranda (1988), genetic diversity is used for precise certification with aim to protect plant varieties. Furthermore, genetic diversity in germplasm can help the reliable classification of accession and to see the required inputs for specific proliferation objectives with potential benefit (Thompson et al., 1998).
The SSR marker techniques provide very useful information concerning the level of polymorphism in bean landraces. The other markers like RAPD based analysis have the restraint of dependability and transferability. However, it is worth mentioning that SSRs proved to be better by showing higher values for most of the parameters that determined the potential of markers in diversity analysis. Furthermore, the information obtained from the population structure analysis can be useful in carrying out association mapping in common bean for various traits.
Finally, it can be concluded that a high degree of variation is found in all the collected germplasms of Malakand divisions with some extra unique characteristics, like early cooking, high productivity and proteomic importance as compared to other landraces of this country and exotic landraces, which needs further analysis to find out its genetic link, its adaptation to new environment all over Pakistan.
Author’s Contribution
Khan Sher: Carried out the experiments and developed the article with support of Muhammad Subhan and Muhammad Nisar.
Muhammad Subhan: Supervisor of the present work as part of PhD research.
Muhammad Nisar: Co-supervisor and provided all sorts of laboratory and technical help.
References
Boye, J., F. Zare and A. Pletch. 2010. Pulse proteins: Processing, characterization, functional properties and applications in food and feed. Food Res. Int. 43: 414-431. https://doi.org/10.1016/j.foodres.2009.09.003
Burle, M., J.R. Fonseca, M.J.D. Peloso, L.C. Melo, S.R. Temple and P. Gepts. 2011. Integrating phenotypic evaluations with a molecular diversity assessment of a Brazilian collection of common bean landraces. Crop. Sci. 51: 2668–2680. https://doi.org/10.2135/cropsci2010.12.0710
Buso, G.S.C., Z.P.S. Amaral, R.P.V. Brondani and M.E. Ferreira. 2006. Primer note: microsatellite markers for the common bean Phaseolus vulgaris. Mol. Ecol. Notes. 6: 252– 254. https://doi.org/10.1111/j.1471-8286.2006.01210.x
Champion, M.R., D. Brunet, M.L. Maudit and R.I. Lami. 1973. Method of testing resistance of bean varieties to Colletotrichum lindemuthianum (Sac. and Magn) Briosi and Cav. Acad. de Agric. de Fr. 59: 951–958.
Cheng, S.S. and M.J. Bassett. 1981. Chromosome morphology in common bean (Phaseolus vulgaris) at the diplotene stage of meiosis. Cytol. (Tokyo). 46: 675–684. https://doi.org/10.1508/cytologia.46.675
Doyle, J.J. and J.L. Doyle. 1987. A rapid DNA isolation procedure for small quantities of fresh leaf tissue. Phytochem. Bull., 19: 11-15.
FAO. 2000. www.fao.stat.fao.org
Gepts, P., F.J.L. Aragão, E. Barros, M.W. Blair, R.B.W. Broughton, I. Galasso, G. Hernández, J. Kami, P. Lariguet, P. Mc Clean, M. Melotto, P.N. Miklas, P. Pauls, A. Pedrosa-Harand, T. Porch, F. Sánchez, F. Sparvoli and K. Yu. 2008. Genomics of Phaseolus beans, a major source of dietary protein and micronutrients in the tropics. pp. 132-162. https://doi.org/10.1007/978-0-387-71219-2_5
Gomez, O.J., M.W. Blair, B.E, Frankow-Lindberg and U. Gullberg. 2004. Molecular and phenotypic diversity of common bean landraces from Nicaragua. Crop Sci. 44: 1412–1418. https://doi.org/10.2135/cropsci2004.1412
Hallauer, A.R. and J.B. Miranda. 1988. Quantitative genetics in maize breeding. 2nd edition, Iowa State Univ. Press, Ames, IA.
Hamada, H., M.C. Petrino and T. Takugana. 1982. A novel repeated element with Z-forming potential is widely found in evolutionarily diverse eukaryotic genomes. Proc. Natl. Acad. Sci. USA. 79: 6465-6469. https://doi.org/10.1073/pnas.79.21.6465
Krista, C., S. Dessert and F.A. Bliss. 1991. Genetic improvement of food quality factors. In: A. van Schoonhoven, O. Voysest (eds.), Common beans: Research for crop improvement. CAB Int. Wallingford, UK. pp. 649 - 650.
Mohammadi, S.A. and B.M. Prasanna. 2003. Analysis of genetic diversity in crop plants salient statistical tools and considerations. Crop Sci. 43: 1235–1248. https://doi.org/10.2135/cropsci2003.1235
Mok, D.W.S., M.C. Mok and A. Rabakoarihanta. 1978. interspecific hybridization of Phaseolus vulgaris with Ph. lunatus and Ph. acutifolius. Theor. Appl. Genet. 52: 209-215.
Mondini, L., A. Noorani and M.A. Pagnotta. 2009. Assessing plant genetic diversity by molecular tools. Divers. 1: 19-35. https://doi.org/10.3390/d1010019
Müller, B.S.F., T. Sakamoto, I.P.P. Menezes, G.S. Prado, W.S. Martins, C. Brondani, E.G. Barros and R.P. Vianello. 2014. Analysis of BAC-end sequences in common bean (Phaseolus vulgaris L.) towards the development and characterization of long motifs SSRs. Plant Mol. Biol. 86 (4-5): 455-470. https://doi.org/10.1007/s11103-014-0240-7
Nei, N. and W. Li. 1979. Mathematical model for studying genetic variation in terms of restriction endo nucleases. Proc. Natl. Acad. Sci. 76: 5269-5273. https://doi.org/10.1073/pnas.76.10.5269
Rohlf, F.J. 1999. NTSYS pc: numerical taxonomy and multivariate analysis system version 2.02g. Exeter Software, Setauket, NY.
Tautz, D. and M. Renz. 1984. Simple sequences are ubiquitous repetitive components of eukaryotic genomes. Nucleic Acids Res.12: 4127-4138. https://doi.org/10.1093/nar/12.10.4127
Thompson, J.A., R.L. Nelson and L.O. Vodkin. 1998. Identification of diverse soybean germplasm using RAPD markers. Crop Sci. 38: 1348–1355. https://doi.org/10.2135/cropsci1998.0011183X003800050033x
Wani, I.A., D.S. Sogi, A.A. Wani, B.S. Gill and U.S. Shivhare. 2010. Physico-chemical properties of starches from Indian Kidney bean (Phaseolus vulgaris) cultivars. Int. J. Food Sci. Technol. 45: 2176-2185. https://doi.org/10.1111/j.1365-2621.2010.02379.x
To share on other social networks, click on any share button. What are these?


