
Major Crops Market Risk Based on Value at Risk Model in P.R. China


Research Article
Major Crops Market Risk Based on Value at Risk Model in P.R. China
Abdur Rehman1*, Wang Jian2, Noor Khan3 and Raheel Saqib3
1Gomal University Dera Ismail Khan, Pakistan; 2Agricultural University of Hebei, China; 3The University of agriculture Peshawar, Khyber Pukhtunkhawa Peshawar, Pakistan.
Abstract | Chinese farmers faced price volatility risk of major agricultural crops. The main purpose of this article is to compute and determine exactly the sizes and degrees of major crops market risk. The market risk analysis of major crops such as coarse grain rice, wheat, corn, cotton and soybean are determined using the VaR (Value at Risk) model. The practical consequences indicated that the normal distribution model is not appropriate used in evaluating the major crops market risk due to various degrees of market risk in various crops such as the cotton and soybean crops with higher levels of market risk, while the coarse grain rice with the medium risk level and finally the corn and wheat with lower levels of market risk. According to the results, the crops having similar characteristics belong to the same level of market risk. Therefore it is essential to accomplish the market risk management system to monitor the risk of major crops by introducing various kinds of products. This ensures the competency, accuracy and decreases significantly the cost of market risk management.
Received | August 26, 2017; Accepted | May 13, 2018; Published | June 01, 2018
*Correspondence | Abdur Rehman, Gomal University Dera Ismail Khan, Pakistan; Email: drrehmanagec@gu.edu.pk
Citation | Rehman, A., W. Jian, N. khan and R. Saqib. 2018. Major crops market risk based on value at risk model in P.R. China. Sarhad Journal of Agriculture, 34(2): 435-442.
DOI | http://dx.doi.org/10.17582/journal.sja/2018/34.2.435.442
Keywords | Agricultural commodities, Major crops, Market risk, Risk management, VAR model
Introduction
With the expansion of global economic integration and market economy, the China agricultural commodities market price volatilities are increasing severely. Agricultural commodities market risk has become one of the major risks faced by the Chinese farmers. It affects the stability of the farmer’s income and consumer welfare safety seriously attracting the attention of peoples from all walks of life and highlights the importance of agricultural products market risk management. Therefore, stable market prices of agricultural commodities have very important practical significance for effective risk management of agricultural market. Market of agricultural products risk measurement and its evaluation is the basis of the agricultural products market risk management. Previous studies use the simple statistics such as coefficient of variation, standard deviation and variance of agricultural products market price fluctuation regularly (Wang et al., 2010; Zhang et al., 2010), But these methods have ignored the probability distribution of agricultural products market price fluctuations in the risk measurement research. At present, the systematic study and the empirical analysis research on the agricultural products spot market risk is still rare. Therefore, this article focus on the agricultural products spot market risk measuring methods and illustrates how to use the empirical approach on measuring the price risk of coarse grain rice, wheat, corn, cotton and soybean in China. The study is also aimed to explore the scientific methods to measure the degree of agricultural products market risk for the effective management. The sources of market risk are natural disasters, recessions, political instability, changes in the interest rates and terrorism etc. However the market price risk of the major crops can be controlled or minimized through a lot of price risk management techniques such as cash forward contract, delayed pricing contract, basis contract, hedging with a future contract, options contract and short selling etc.
Hypotheses of the study
The following are the hypothesis of the study; H0: Major crops spot prices are normally distributed while H1: Major crops spot prices are not normally distributed; H0: Major crops spot prices have unit root while H1: Major crops spot prices have no unit root.
Objective of the study
The objective of this article is to estimate and analyze the major crops including coarse grain rice, wheat, corn, cotton and soybean yearly market price risk using VaR model and finally divide the rating of market price risk.
Review of literature
The opinions of different national and international scholars about the use and applications of VaR model are mentioned below.
Jorion (1996) defined mathematically the basic of VAR model as VaR= P𝞪σ. Mahoney 1996, Hendricks 1996, Jackson, Maude and Perraudin 1997 suggested empirically that Value at Risk assessment method is susceptible to the all kinds of the data set utilized to develop the estimation in addition to the confidence level and the time horizon associated with any VaR model. Thilmany et al. (1996) analyzed the statistical properties of wheat futures prices and determined the Value at Risk. Linsmeier and Pearson (1997) studied that the role of VaR as the market price risks faced by the agricultural sector. Boehlje and Lins (1998) and Brent and Baker (2001) introduced the VaR model in agricultural sector. Manfredo et al. (1998) studied that VaR find out the probability of a portfolio loss in a specific period of time due to unfavorable market situation with a specific level of confidence. Manfredo and Leuthold (2001) and Odening and Hinrichs (2003) used the approach of Value at Risk to examine the price risk of German hog production and US cattle feeding respectively. Han (2008) took the Zhengzhou Commodity Exchange hard wheat future prices. By constructing hard wheat futures, he computed the VaR value through contracts yielded continuous time series data. From his conclusion, he projected a method of marginal levels and combining VaR curve to apply a sole early warning indicator of the products futures market risk. Sam (2010) assessed the extreme market risk of three traded agricultural commodities including corn, soybeans and wheat using nonparametric Kernel method. Singh et al. (2005) studied the volatility of wheat and maize crops cash and future prices in India by using the ADF test to check the stationarity of prices and co integration test to examine the long term association between the cash and future prices. Zheng (2008) studied VaR of the cattle feeding margin using nonparametric kernel estimator in his dissertation using future data. The experimental result shows the efficiency of the nonparametric VaR without losing much correctness as compare to the parametric estimates. Kourouma et al. (2011) investigated the VaR and predictable deficit for S&P 500, CAC 40, Crude Oil and Wheat indexes during 2008 economic crisis and showed an underestimation of the risk for the categorical Value at Risk models as compared to conditional models. Tarasov (2011) studied the VaR and expected shortfall approach throughout entire distribution of outcomes within the climatic regions of Ukraine. The Monte Carlo standard deviation, autocorrelation and simulation results show the best risk modeling. Qiao et al. (2012) used empirically VaR approach to measure the price risk of livestock such as eggs, chicken, beef, mutton and pork in P.R. China. The consequences exposed that normal distribution is not appropriate to modeling the price risk of livestock and proposed VaR model to measure the livestock products risk. Wang et al. (2010) analyzed the fruit market risk such as strawberry, watermelon, grape, pear, banana, orange and Fuji apple utilizing the Value at Risk model. The consequences exposed that various fruits have various degrees of price risk. Pears, apples and bananas have lower levels of risk. The watermelons and Strawberries have comparatively higher levels of risk, while oranges and grapes have average levels of risk. The results further explained that fruits have similar characteristics fit to the similar market risk level. Tesfalidet et al. (2014) studied skewness and leptokurtic VaR model that combine the Cornish Fisher and EWMA methods using weekly returns data of Maple Leaf Foods stock and Canadian feedlot cattle feeding margin data. The EWMA method of VaR assessment produce the most suitable results particularly for returns with positive skewness, meanwhile the Cornish-Fisher method of VaR provide a better experimental returns as compared to other methods. Finally suggested that the users need to determine the VaR values using their own preferences.
Materials and Methods
Data sources
The major crops such as coarse grain rice, wheat, corn, cotton and soybean yearly spot prices (RMB/Kg) data from 1985-2014 are taken from China’s Agricultural Products Survey Year book 2000-2014.
Econometric methods
To examine the normality distribution of the major crops, Jarque Bera probability test and to check the stationarity and stability of the major crops prices the ADF (Augmented Dickey Fuller) test was used and finally to determine the major crops market price risk, the VaR model has been used.
Fundamental principle of value at risk model
The risk management method, VaR derived from the risk management system of Risk Metrics expanded by the Group of JP Morgan. VaR is the most important model used to compute the price risk and in the twentieth century the model became popular globally. The model was further developed by Jorion (1996) and has been largely utilized as a yardstick and accepted risk management method around the globe.
Description of value at risk
The model of Value at Risk has been described as under. In a condition of standard monetary market at a specific level of confidence, the magnitude of loss X calculated is the most anticipated horrible case at a given time period (Dezong, 2008). Moreover, the Value at Risk mathematically defined as follows. Where the set X is described as an unsystematic variable to explain the failure of portfolio, Then F(x) is the function of probability distribution at a particular level of confidence.
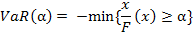
Then
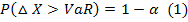
In the above formula (1) the VaR α is the value at risk under a particular level of confidence α. △X is the failure of the group in the given time period. Actually the VaR computes the top and bottom quartiles of the probability distribution function F(x) under a particular level of confidence α.
Major crops market risk based on value at risk model
The value of major crops market risk means the maximum instability of the major crops prices in the market under normal circumstances in a specific period of time under a definite level of confidence. Under this description, in China the risk value of the major crops prices should stand by the events as shown under.
The analysis of market price succession processing and statistical characteristics of major crops: To study the market price risk fluctuation, initially should eliminate the tendency of historical price data. And to decrease the pressure of volatility only possible by changing the value of currency, modifies in the interest rates, price rises and other factors. The article utilized the statistical chain to generate the time series of prices into a growth rate of major crops prices and then statistically explain the new series.
Risk probability distribution model of major crops price fluctuation: In spite of the coefficient of variance, variation, standard deviation and other simple statistics those can generally explain the unpredictability of market prices of major crops, however these simple statistics involve the impractical statement that diverse variations of major crops prices have similar possibility. Therefore, it is essential to analysis the possible allocation of major crops price fluctuation to fasten the optimal probability distribution model to measure appropriately the major crops market risk allowing for precision in the assessment of major crops price risk.
Computation of the risk value of major crops market price: A specific distribution model of optimal probability is appropriate in the computation of market price risk of major crops and the top and bottom quartiles under a definite level of confidence. The formula (1) then used to compute the value at risk and the highest risk value of major crops deviated from the estimated major crops market price in a given period of time.
Results and Discussions
The trend analysis of major crops yearly spot prices
During the whole period from 1985 to 2014 the following major changes have been observed in the yearly major crops’ spot prices including coarse grain rice, wheat, corn, cotton and soybean. The coarse grain prices showed 814. 286 percent increase from 0.350 RMB/Kg to 3.200 RMB/Kg, wheat spot prices showed 306.452 percent increase from 0.620 to 2.520 RMB/kg, corn spot prices showed 657.576 percent increase from 0.330 to 2.500 RMB/kg, cotton spot prices observed 340.407% surge from 3.440 to 15.150 RMB/kg and finally soybean spot prices raised by 477.105 percent from 0.760 to 4.386 RMB/kg respectively. The graphical illustrations of these changes are provided in Figure 1.
Results of the descriptive statistical analysis
The detailed descriptive statistical analysis of the major crops yearly spot prices are given in Table 1.
Table1: Descriptive Statistics of China’s Five Major Crops Yearly Spot Prices.
| Descriptive Statistics | Rice | Wheat | Corn | Cotton | Soybean |
| Mean | 1.439 | 1.367 | 1.156 | 12.009 | 3.015 |
| Maximum | 3.200 | 2.520 | 2.500 | 25.654 | 5.850 |
| Minimum | 0.350 | 0.610 | 0.330 | 3.440 | 0.760 |
| Std. Dev. | 0.893 | 0.554 | 0.642 | 5.595 | 1.466 |
| Skewness | 0.588 | 0.623 | 0.700 | 0.139 | 0.402 |
| Kurtosis | 2.353 | 2.532 | 2.563 | 2.590 | 2.285 |
| Jarque-Bera | 2.251 | 2.214 | 2.691 | 0.308 | 1.449 |
| Probability | 0.324 | 0.331 | 0.260 | 0.857 | 0.484 |
| Observations | 30 | 30 | 30 | 30 |
30 |
Source: Author’s Calculation.
In China From 1985 to 2014, the average coarse grain rice, wheat and corn spot prices recorded 1.439, 1.367 and 1.156 RMB/kg ranging from 0.320, 0.610 and 0.330 RMB/kg to 3.500, 2.520 and 2.500 RMB/kg with standard deviations of 0.893, 0.554 and 0.642 respectively. Similarly the cotton and soybean average prices observed 12.010 and 3.0154 RMB/kg ranging from 3.440 and 0.760 RMB/kg to 25.654 and 5.850 RMB/kg with standard deviations of 5.595 and 1.466 respectively. In the above Table 1, the standard deviation of cotton is more than coarse grain rice, soybean, corn and wheat means that the cotton crop’s spot prices are more widely distributed than other crops and the prices are more volatile than soybean, coarse grain rice, corn and wheat which shows high cotton price risk and the occurrence of higher expected loss. The price volatility analysis based on standard deviation indicates that the prices of soybean are ranked second in the list of highly volatile prices while coarse grain rice, corn and wheat are placed at third, fourth and fifth spots respectively. The skewness coefficients for all the major crops are positive, which indicates that the market prices of these crops are usually lower than its standard prices. Based on the Jarque-Bera statistics and its probability value for all the major crops spot market prices, we accepted the assumption of normal distribution at 32.420%, 33.050%, 26.040%, 85.750% and 48.440% respectively, while the alternative hypothesis of the spot price risk of major crops are not normally distributed are rejected. And the calculated p-values of the selected crops at the given true alpha levels are given in Table 2.
Table 2: Calculated p-values equivalents to true alpha levels at given sample sizes.
|
True α level |
20 | 30 | 50 | 70 | 100 |
|
0.1 |
0.307 | 0.252 | 0.201 | 0.183 | 0.156 |
| 0.05 | 0.146 | 0.109 | 0.079 | 0.067 | 0.062 |
| 0.025 | 0.051 | 0.030 | 0.020 | 0.016 | 0.017 |
| 0.01 | 0.006 | 0.003 | 0.002 | 0.001 |
0.002 |
Source: Author’s Calculation.
Jarque- Berra test of normality is a good inferential test statistic used for testing the normality of the sample observed data for a good fit with normal distribution. Here we have spot prices for selected Chinese major crops. The assumption of normality is fortunately is met by the time series crop data. If the level of significance is set at 1%, then the decision value is 12.569. It can be observed that all the values are precisely in the acceptance region of the statistical decision criterion.
Stationarity and stability test of the major crops spot prices
The outcome of the ADF unit root test statistics of the major crops spot prices are given below in Table 3.
The main purpose of the analysis of the time series data is to execute a unit root test statistics. This is because the required analysis usually utilized to examine the stability of the time series data, and if the sequence of the data is not constant means that the characteristics of the time series data varied with the
Table 3: The ADF test results of the unit root test statistics.
| Coarse Grain Rice | Wheat | Corn | |||||||
| ADF test Statistics | -3.552 | Prob.* | -4.198 | Prob.* | -4.039 | Prob.* | |||
| Test Critical Values | 1% level | -3.689 | 0.014 | 1% level | -3.689 | 0.003 | 1% level | -3.689 | 0.004 |
| 5 % level | -2.972 | 5% level | -2.972 | 5% level | -2.972 | ||||
| 10 % level | -2.625 | 10% level | -2.625 | 10% level | -2.625 | ||||
| Cotton | Soybean | ||||||||
| ADF test Statistics | -5.713 | Prob.* | -5.766 | Prob.* | |||||
| Test Critical Values | 1% level | -3.689 | 0.0001 | 1% Level | -3.689 | 0.0001 | |||
| 5% level | -2.972 | 5% Level | -2.972 | ||||||
| 0% level | -2.625 | 10% Level | -2.625 | ||||||
Source: Author’s Calculation.
Table 4: Goodness of fit of coarse grain rice, wheat and corn crops yearly cash price risk.
| Distribution | Rice | Wheat | Corn | ||||||
| KS | AD | Chi-Squared | KS | AD | Chi-Squared | KS | AD | Chi-Squared | |
| Stat rank | Stat rank | Stat rank | Stat rank | Stat rank | Stat rank | Stat rank | Stat rank | Stat rank | |
| Burr(4P) | 0.151 (3) | 0.548 (1) | 1.679 (17) | 0.102 (12) | 0.451 (13) | 1.497 (17) | 0.070 (4) | 0.169 (13) | 0.123 (6) |
| Gama(3p) | 0.165 (15) | 0.756 (13) | 1.597 (8) | 0.093 (9) | 0.343 (10) | 1.689 (20) | 0.077 (7) | 0.156 (7) | 0.041 (2) |
| Log logistic(3p) | 0.148 (1) | 0.588 (3) | 1.678 (16) | 0.079 (1) | 0.240 (1) | 2.670 ( 21) | 0.088 (14) | 0.164 (11) | 0.175 (8) |
| Logistic | 0.212 (25) | 0.982 (20) | 7.223 (25) | 0.122 (18) | 0.559 17) | 1.614 (19) | 0.113 (20) | 0.340 (19) | 1.032 (19) |
| Lognormal(3p) | 0.161 (7) | 0.723 (8) | 1.618 (11) | 0.085 (4) | 0.269 (6) | 1.418 (13) | 0.079 (10) | 0.147 (4) | 0.496 (12) |
| Normal | 0.205 (22) | 1.092 (24) | 1.234 (2) | 0.143 (20) | 0.683 (19) | 1.468 (15) | 0.109 (17) | 0.327 (18) | 1.592 (22) |
| General Extreme Value | 0.163 (13) | 0.738 (10) | 4.226 (23) | 0.088 (7) | 0.244 (3) | 1.287 (9) | 0.071 (5) | 0.135 (1) | 0.528 (14) |
| Johnson SB | 0.161 (9) | 0.755 (12) | 2.673 (18) | 0.098 (10) | 0.339 (9) | 0.621 (3) | 0.067 (1) | 0.143 (2) | 0.653 (16) |
| Weibull (3p) | 0.166 (17) | 0.894 (15) | 1.577 (6) | 0.099 (11) | 0.433 (12) | 1.484 (16) | 0.069 (2) | 0.168 (12) | 0.123 (5) |
Source: Author’s Calculation.
passage of time, signaling that there may have been regression problems. The Augmented Dickey Fuller test statistic results showed that except the coarse grain rice all the other variables showed presence of a significant unit root at1% probability level, whereas the chain growth sequences variants of major crops yearly market prices discarded the hypothesis of the presence of a significant unit root under 1%, 5% and 10% level of significance.
The market risk distribution of the major crops
To measure the instability of market prices of the major crops, first the probability distribution of price risk should be assessed. The Normal, Burr, Weibull, Logistic, Log-Logistic, Gamma, General extreme value and Johnson SB models are widely used to reproduce the probability distribution model of the market risk fluctuation of various major crops. To select the optimal probability distribution of each crop’s price volatility, Kolmogorov Smirnov test (KS test), Chi-square test and Anderson Darling test were utilized. The results should be preferred; if the outcomes of all three test methods are reliable. If the outcomes of the above mentioned three test methods are dissimilar, the Augmented Dicky fuller test results must be preferred due to its more stability amongst the used three test methods (Zhang and Qiao. 2010). The results of the tests exposed that the normal distribution is not the most excellent representation to measure the instability of the China’s major crops price risk. The features and statistical analysis of the time series data of the major crops market prices are presented in Table 1. The result shows that the optimum probability distributions of the price risk volatility of the five major crops variants are dissimilar. Rice obey the burr (4p) distribution, Wheat and cotton follow the log logistic (3p) distribution, while corn and soybean conform the logistic distribution. This indicates the causes and levels of various major crops price volatility risks are also dissimilar. The best suitability of the
Table 5: Goodness of fit of cotton and soybean crops yearly cash price risk.
| Distribution | Cotton | Soybean | ||||
| KS | AD | Chi-Squared | KS | AD | Chi-Squared | |
| Stat rank | Stat rank | Stat rank | Stat rank | Stat rank | Stat rank | |
| Beta | 0.146 (25) | 4.533 (31) | N/A | 0.084 (9) | 0.159 (9) | 0.112 (2) |
| Burr(4P) | 0.109 (10) | 0.385 (9) | 0.675 (12) | 0.085 (12) | 0.152 (6) | 0.616 (15) |
| Gama (3p) | 0.099 (7) | 0.358 (8) | 0.764 (15) | 0.092 (19) | 0.169 (14) | 0.483 (12) |
| Log logistic(3p) | 0.090 (1) | 0.335 (1) | 0.456 (8) | 0.083 (7) | 0.206 (18) | 0.329 (10) |
| Logistic | 0.118 (16) | 0.431 (17) | 3.908 (25) | 0.093 (20) | 0.246 (20) | 1.06 (24) |
| Lognormal (3p) | 0.095 (3) | 0.354 (4) | 0.432 (5) | 0.086 (16) | 0.165 (11) | 0.314 (7) |
| Normal | 0.115 (14) | 0.398 (11) | 3.926 (26) | 0.074 (2) | 0.157 (8) | 0.747 (19) |
| General Extreme Value | 0.104 (8) | 0.336 (2) | 0.820 (19) | 0.085 (10) | 0.147 (3) | 0.646 (18) |
| Johnson SB | 0.109 (11) | 0.355 (7) | 0.802 (18) | 0.085 (11) | 0.143 (1) | 0.617 (16) |
| Weibull (3p) | 0.109 (9) | 0.386 (10) | 0.677 (13) | 0.086 (15) | 0.151 (5) |
0.615 (14) |
Source: Author’s Calculation.
five major crops price risk probability distributions in China are expressed in Tables 4 and Table 5.
The optimized probability distribution models of market risk based on the Maximum Likelihood Estimation are utilized to evaluate the parameters and quartiles of various major crops price risk under various models of probability distribution. The estimated domino effects are expressed in Table 6.
Table 6: The parameters and optimal probability distribution.
| Variety | Optimal Distribution | Parameters |
| Coarse grain Rice | Burr (4P) |
K=0.410, α=331.44, β=11.887, γ=-11.879 |
| Wheat | log logistic (3p) |
α=4.189, β=0.325, γ=-0.30339 |
| Corn | General Extreme value |
K=0.066, σ=0.119, µ=0.009 |
| Cotton | log logistic (3p) |
α = 10.11 β = 1.328 γ = -1.295 |
| Soybean | Johnson SB |
γ=0.476, δ=1.997, λ=1.406, ξ =-0.564 |
Source: Author’s Calculation.
Using value at risk model for the computation of major crops market price risk
To determine the market price instability of coarse grain rice, wheat, corn, cotton and soybean we used the optimal probability distribution model. Using easy fit 5.5 professional software, the top and bottom quartile have been calculated of the five major crops market price risk variation under 95% confidence
level and the calculated VaR values from the above methods under 95% confidence levels are given in Table 7.
Table 7: Var values under 95% confidence level.
| Variety | Upper VaR Value | Lower VaR Value |
| Coarse grain rice | 27.29% | -25.41% |
| Wheat | 35.36% | -14.23% |
| Corn | 39.767 | -11.694% |
| Cotton | 48.21% | -30.23% |
| Soybean | 32.73% | -20.64% |
Source: Author’s Calculation.
Under the standard market situations, the annual changes in the market prices of all the five major crops under 95% confidence interval are rice [27.29%, -25.41%], wheat [35.36%, -14.23%], corn [29.22%, -15.25%], cotton [48.21%, -30.23%] and soybean [32.73%, -20.64%].
The variants benefit of all the five major crops market price risks are superior to the falls of their market price risks. Even though the increase of these major crops market prices can bring definite advantages to the growers and the decline of the major crops market prices could bring higher risk to growers.
The five major crops market price risks can be divided into three levels. The first group consists of cotton and soybean with highest level of market risk. Their respective fluctuated values of VaR are much higher compared to other major crops, second group consists of coarse grain rice with the medium level of risk and finally the wheat and corn consists the third group with low market risk levels.
The division of the five major crops market price risk into three levels such as higher level, medium level and lower level is based on their degrees and sizes of market risk and the difference between the upper and lower VaR values.
The difference in risk level among the five major crops is based on their characteristics, their demand and supply in national and international market, their area and amount coverage by each producers, their risk management techniques etc. The government price support and commodity stockholding program also causes the difference in price risk level among the five major crops.
Conclusions
This article measures the five major crops market price volatility risk values using the VaR model in China. The experimental investigation describes that the method of VaR can efficiently compute the instability of the market prices and the market risk of major crops as well. Moreover, it can precisely compute the main variation of all the major crops market prices and figure out market risk values of these crops.
It can be concluded that the cotton prices are more volatile and wheat prices are less volatile among the five major crops considered in the study. The Jarque-Bera probability and the Augmented Dickey Fuller test statistic values indicate that the major crops spot prices are normally distributed and are stationary and stable at first difference.
The quantitative basis for the execution of market risk evaluation and supervision of the major crops market conditions under the market economy is the objective of the data analysis. According to the computed values of various major crops market risk, the sizes of the different major crops market price risks are different, which divide the major crops into three levels of market risks. Moreover, the research also identified that the major crops at the similar level of market risk have the same characteristics. In other words, the feature and kind of the market risk such as the size of the crops are interrelated. The specific aim of the risk management is to control the price risk, which also accumulates administration cost and extensively develops the efficiency of risk management.
Author’s Contribution
Abdur Rehman: Collected the literature, designed the study, wrote the protocol and prepared the first draft of the manuscript.
Wang Jian: Designed the model and analysis of the data.
Noor Khan: Helped in rectification of the model and interpretation of the results.
Raheel Saqib: Proofread, edit and corrected the manuscript.
References
Abdoul, G.S. 2010. Nonparametric estimation of market risk, an application to agricultural commodity futures. Agric. Finan. Rev. 70 (2): 285–297. https://doi.org/10.1108/00021461011065292
Boehlje, M.D. and D.A. Lins. 1998. Risks and risk management in an industrialized agriculture. Agric. Finan. Rev. 58: 1-16.
Brent, A. and Baker. 2001. A comparison of criteria for evaluating risk management strategies. Agric. Finan. Rev. 61(1): 36-56.
Hendricks, D. 1996. Evaluation of value at risk models using historical data. Federal Reserve Bank of New York Policy Rev. 39-70.
Han and Dezong. 2008. Early warning research of China commodity futures market risk based on VaR. Management Engineering Transaction. 22(1): 117-121.
Jackson, P., D.J. Maude and W. Perraudin. 1996. Bank capital and value at risk. J. Derivatives. 4(1): 73-89.
Mahony, j. 1996. Empirical based versus model-based approaches to value at risk. An examination of foreign exchange and global equity portfolio. Risk measurement and systemic risk, proceedings of a joint central bank research conference. Board of governors of the federal reserve system. Washington, DC. 199-217.
Jorion, P. 1996. Risk measuring the risk in value at risk. J. Financ.Anal. 52(6): 47-56. https://doi.org/10.2469/faj.v52.n6.2039
Linsmeier, T.J. and N.D. Pearson. 1997. Quantitative disclosure of market risk in the SEC Release. Account. Horiz. 11(1): 107-135.
Li, J. and Z. Qiwen. 2009. The application of VaR method in market risk management of commercial banks of China. Bus. Econ. 5(1): 60-62
Mark, R., Manfredo, Raymond and M. Leuthold. 1998. Agricultural applications of value at risk analysis, A perspective proceedings of the ncr-134 Conference on applied commodity price analysis, forecasting and market risk management. Chicago, IL. 1. 98-104.
Singh, N.P., R. Kumar, R.P. Singh and P.K. Jain. 2005. Is futures market mitigating price risk, An exploration of wheat and maize market. Agric. Econ. Res. Rev. 18 (1): 35-46.
Odening, M. and J. Hinrichs. 2003. Using extreme value theory to estimate value at risk. Agric. Finan. Rev. 63 (1): 55-73. https://doi.org/10.1108/00215000380001141
Tesfalidet, A., A.F. Desmond, G. Hailu and R. Singh. 2014. Statistical evaluation of value at risk models for estimating agricultural risk. J. Stat. Econ. Method. 3 (1): 13-34.
Wang, C., Junye and H. Min. 2010. Measurement of the fluctuation risk of the China fruit market price based on VaR. International Conference on Agricultural Risk and Food Security. 1: 212-218.
Yi, Z. and M.A. 2008. Essays on nonparametric econometrics with applications to consumer and financial economics. PhD dissertation presented to graduate school of the ohio state university, Ohio, USA.
Zhang, Qaio, W. Chuan and W. Ke. 2010. Livestock market price risk measurement and analysis of China. Econ. Issues. (3): 90-94.


