
Influence of Wheat Varieties on Technical Efficiency and Production of Wheat Crop in Pakistan (In Selected Area of Punjab)


Research Article

Influence of Wheat Varieties on Technical Efficiency and Production of Wheat Crop in Pakistan (In Selected Area of Punjab)
Hina Fatima1*, Muhammad Azeem Khan2
1Fatima Jinnah Women University, Rawalpindi; 2National Agricultural Research Center, Pakistan.
Abstract | Wheat is the main staple food item of the country’s population and the largest grain crop as well. Pakistan has been regularly importing wheat, except for the few years. Wheat’s domestic production has remained short of its domestic demands. To estimate the wheat varietal effect on wheat production and technical efficiency, a Cobb-Douglas Translog frontier analysis has been done. A primary research is conducted in the area of Rahim Yar Khan. Adoption of Modern wheat varieties is important for more profit as well as for enhancing the wheat productivity. However, modern wheat varieties have not been adopted widely in Pakistan. Farmers make use of traditional wheat varieties, whose yields are quite below the modern wheat varieties. The result of the study reveals that the parameter estimate of wheat variety is negative and significant also. The parameter of seed rate variable is also negative and statistically significant. A technical inefficiency of 22% is present in the production of wheat crop in the selected district. Majority of the farmers typically utilize the last year’s crop seeds to economize the cost but this comes at another cost of loss of potential yield, which could be obtained through the use of modern varieties of seeds. Also considering the ecological conditions of the area is must before the adoption of any variety of seed, otherwise suboptimal output will be produced. Governmental check and regulation is also needed, dealers often sell fake seed varieties which discourages, the production and use of the original seed, and also the technological development.
Editor | Tahir Sarwar, The University of Agriculture, Peshawar, Pakistan.
Received | March 20, 2015; Accepted | June 22, 2015; Published | June 25, 2015
*Correspondence | Hina Fatima, Fatima Jinnah Women University, Rawalpindi, Pakistan; E-mail | hinnafatima@gmail.com
Citation | Fatima, H. and M. A. Khan. 2015. Influence of wheat varieties on technical efficiency and production of wheat crop in Pakistan (In selected area of Punjab). Sarhad Journal of Agriculture, 31(2): 114-122.
DOI | http://dx.doi.org/10.17582/journal.sja/2015/31.2.114.122
Keywords | Stochastic Frontier Analysis (SFA), Cobb Douglas (CD), Technical Efficiency (TE), High Yielding Varieties (HYV), Pakistan
Introduction
The role of farm sector in Pakistan is in more than one dimensions. Farm sector has the main contribution towards economic growth. This sector also fulfils the supply of basic food and fiber needs of the country’s growing population and the economy. Wheat is main staple food item of the country’s population and largest grain crop. Wheat is most widely grown crop of Pakistan as well. Pakistan has made significant progress in wheat crop, overtime. Despite all this expansion in production over years, increase in the productivity per unit of area, has been very low in Pakistan. On all counts, Pakistan potentially can do much well than what it does now, by improvement in technical efficiency of inputs of wheat crop (Ahmad, 2000). It is expected that due to the heavy pressure of population, demand for agricultural commodities will increase in near future. These factors together made Pakistan to have resorted to wheat import for avoiding food shortages. Although having comparative advantage in wheat production, Pakistan, for most part of its history has been a net importer of wheat (Iqbal, 2002).
Food supply at affordable prices is the cornerstone of food security policy of Pakistan. In 2007-08, the country has spent US $1 billion on importing 2 million tons of wheat in a situation of wheat crisis in international market. The recent food crisis in country raised many concerns and questions among agricultural research and policy circles, whether such food crisis would continue in future and if so, how these should be managed. Finally, the government has decided to substantially increase wheat production in the country by increasing support prices, by more than 50% during 2007-08 (Farooq, 2009).
Pakistan has been almost regularly importing wheat, except for few years. Wheat’s domestic production has remained short of the domestic demand. In order to, fulfil the food requirement of rapidly growing population, save foreign exchange and address the food security concerns of the country as well, we have to increase wheat production by utilizing all possible and optimal ways.
On the other hand, a large share of future yield increase will have to come from adoption of improved wheat varieties and crop management. Adoption of Modern wheat varieties is important for, more profit and enhancing wheat productivity. Since 1971, approximately 107 improved varieties of wheat have been developed and released in Pakistan. Adoption of High Yielding Varieties (HYV) leads to 25% increase in wheat yield. However, modern wheat varieties have not been adopted widely in Pakistan. The farmers make use of traditional wheat varieties whose yields are quite low as compared to the modern wheat varieties. It is due to a number of factors like poor infrastructure, poor access to the markets and the exorbitant modern wheat varieties which are out of jurisdiction of farmer’s financial plans and this offsets the yield advantage. Majority of the farmers typically utilize the last year’s crop seeds instead of purchasing modern released wheat variety.
According to Farooq et al. (2007) non-availability and high prices of modern seeds varieties were the main reasons for its slow adoption and resulted in lower wheat yield per acre in Pakistan. Matuschke and Qaim (2006) examined the influence of modern wheat seed varieties adoption on small scale farmers in India. The result of the study indicated that farm size has no impact on the decision to adopt modern wheat varieties. The major factors behind slow adoption of modern seed varieties are lack of information, high prices of new high yielding seeds varieties and non-availability of credit. The study suggested that the adoption of modern wheat seed varieties would not be increased without the comprehensive government support for farmers, in the form of subsidies. According to Ghimire et al. (2012) apart from modern seed varieties’ development, farmers’ access towards these new seed varieties is one of the most important things. Due to inefficiency and underdevelopment in inputs’ distribution system, the rate of modern seeds’ adoption was very insufficient. Hence, well-established institutional system in India might be supportive in debilitating these hindrances for farmers. Wicombe (1999) also suggested that supply of high yielding wheat varieties to the farmers in the Punjab of India, might result in higher level of wheat yield. According to Pandit et al. (2006) replacement of conventional wheat seed varieties with modern seed varieties increased the wheat crop productivity. The widespread adoption of diverse high yielding wheat varieties will manifold the wheat production in Bangladesh. According to Shah et al. (2012) adoption of modern seed varieties compared to the conventional seed varieties increased the wheat production and doubled the returns for wheat crop producers. Major objectives of the present study were: to examine the rate of adoption of modern wheat varieties among farmers of the study area; and to evaluate the outcome of presently employed wheat varieties on the productivity and technical efficiency of the wheat crop in Pakistan.
Materials and Methods
This study is a primary research. A purposive sampling technique is used and cross-sectional data has been used. The instrument used is the “questionnaire”. A pre-tested questionnaire was used to gather the information from the farm respondents. A formal survey of wheat crop was conducted in districts of Rahim Yar Khan and Bahawalpur, in 2010. The major objective of this survey was to sort out the factors of special problem of non-adoption of modern high yielding wheat varieties that limited the wheat production. The respondents of the study were those farmers who cultivated the wheat. The population of this research encompasses the area of Rahim Yar Khan and Bahawalpur, where 430 farmers were selected and interviewed. It was difficult task to meet 430 farmers and collect information. Battese et al. (1996) explained that a questionnaire is an ordered list of questions for a survey. A number of questions were asked about key practices in the production of wheat crop in order to analyse interactions between cotton and wheat. Data was also gathered with respect to inputs utilization for wheat crop cultivation, farm size and socio-economic and other farm specific characteristics which are considered vital for empirical analysis via a questionnaire. The reason for selection of wheat for the analysis is that this is the most important staple crop in Pakistan and also the major crop of the study area of Bahwalpur division. Wheat is equally popular among the smallholder and large-scale commercial farming sectors of Pakistan. The author also used the Punjabi and Sarike language for those farmers that were illiterate and not able to understand the Urdu language and as a result, they felt ease while giving the information. Present study is based on sample responses of the farmers.
Farrell’s (1957) determining work on efficiency measurement provides several for productivity and efficiency analysis. In general, two common approaches for efficiency analysis are employed, the stochastic frontier production function by Aigner et al. (1977) and Meeusen and van den Broeck (1977) and data envelopment analysis (DEA) by Charnes et al. (1978). Both approaches have merits and demerits that are reviewed by a number of economists like Bauer (1990), Seiford and Thrall (1990), Battese (1999) and Bravo-Ureta and Pinheiro (1993).
The major strong point of stochastic frontier technique is that it is covenant with stochastic noise that is most required in agricultural sector. In the last two decades, stochastic frontier production functions have been used broadly to examine technical efficiency particularly in case of agricultural sector, where uncertainty is one of the main sources of variation.
In present study, Stochastic Frontier Analysis (SFA) is used to measure the maximum possible output, accessible from a specified bundle of inputs and technology. The disturbance term in stochastic frontier analysis is decomposed into two components.
Formally,
Y= f(x) ɛEi…….. (1)
Where according to Aigner et al. (1977),
Ei= Vi - Ui …….. (2)
Where Vi is a symmetric component, which captures randomness outside the control of the farmer, such as droughts, floods, etc. and the statistical noise contained in every empirical relationship. The other one-sided component captures the randomness under the control of the farmer (i.e., inefficiency). Vi is assumed to be identically and independently distributed with zero mean and variance as Vi ~ N (0, σ2). On the other hand, the Ui component of the error term captures the technical inefficiency of the interpretation and is assumed to be independent of Vi, The distribution of Ui is assumed to be half normal and distributed normally and identically as Ui ~ N (0, σ2). The non-negative component ‘Ui imitates that the output of each firm must be positioned on or below its frontier (Battese and Broca, 1997). σu2 and σv2 are the variances of the parameters symmetric (v) and one-sided (u) error term. It follows that, σ2 = σ2v + σ2u (Coelli, 1995).
TE refers the technical efficiency of the individual farm that lies in between zero and one, Yi is observed output and Yi* is maximum possible output using the given level of input.
TE = Yi / Yi*…….. (3)
Battese and Coelli (1995) defined the technical inefficiency effects as: Zi is the vector of explanatory variables associated with technical inefficiency effects. δ’ is a vector of unknown parameters to be estimated. Wi represents unobservable random variables, which are assumed to be independently and identically distributed.
Ui = δo + δiZj + Wi …….. (4)
One hypothesis has been tested with regard to the model specification. This test is performed by employing generalized likelihood-ratio statistics, LR, The generalized likelihood-ratio is measured for testing the null hypothesis, which are defined as
LR = –2 Ln [L (H0) / L (H1)]
Where L (H0) and L (H1) are the values of the log likelihood function under the specifications of the null and alternate hypothesis, respectively. In the present study, the null hypothesis specify that Cobb Douglas stochastic frontier production is appropriate for present data set, which is specified as:
H0 : βjk =0
Both the Cobb-Douglas and Translog functional forms have been employed to estimate the wheat crop production function. The Cobb-Douglas production function form is defined as:

The Translog production function form is defined as:
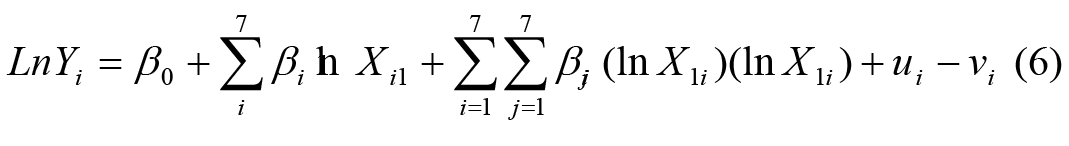
Where, Yi = wheat yield, X1 = represent the weedicide cost per acre, X2 = represent the farm size under wheat crop, X3= represent the wheat seed variety, X4 = represent number of ploughing per acre, X5 = represents NP ratio per acre, X6 = Wheat seed rate applied per acre, X7 = Number of irrigation.
It is implicit that some farmers are not able to produce on the frontier and other produce on the frontier. So, to find out the factors that lead to the technical inefficiency, the technical inefficiency model is employed.
The technical inefficiency effects are defined as:
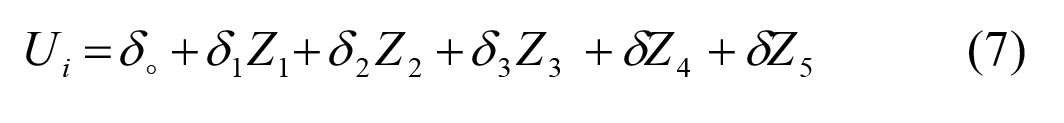
Where, Z1 = represent experience of farmer in years, Z2 = farmer used previous year own wheat seed application used as dummy variable. It takes value of 1, if farmers use own seed from previous year crop, and otherwise zero, Z3 = represent farmers’ education in years, Z4=represents the number of farmers visits to extension services center, Z5, represents the distance of wheat farm from main market.
Result and Discussion
The survey recoded 6 varieties of wheat planted in the area, as depicted by Table 1. A large number of farmers from the selected sample use more than one wheat seed variety, to accommodate diverse planting dates after different cotton types. Around 69% used Sahar seed variety, if wheat crop is planted on time. Approximately 53% of the farmers used Bahkar seed variety, in case of late planting of wheat crop. The Sahar and Bahkar varieties were also grown by the farmers for both normal and late planting (on time planting date means wheat sown between 15 to 30 November while late planting means wheat sown in December). About 23% of the farmers used Bahkar on normal planting fields and 20% used Sahar in case of late planting fields. The third main variety in the study area was the Abdul Sattar that was planted 4% on normal planting dates and 16% on late planting fields. Shafaq, Watan and Inqlab varieties were to some extent used in study area. The problem of slow uptake of new varieties in the area is quite severe, especially in case of Bahkar and Abdul sattar varieties. Only a few farmers recognized the names of new recommended varieties.
Table 1: Wheat varieties used after different planting dates
|
Particulars |
Early planting of wheat |
Late planting of wheat |
All |
Prob. |
|
Sahar |
69 |
20 |
44 |
0.000 |
|
Bahkar |
23 |
53 |
38 |
|
|
Abdul sattar |
4 |
16 |
10 |
|
|
Sahfaq |
2 |
6 |
4 |
|
|
Wattan |
0 |
0 |
0 |
|
|
Inqlab |
2 |
6 |
4 |
Table 2: Seed rate and sowing methods on sample farms
|
Particulars |
Early planted date |
Late planted date |
Prob. |
|
Seed Rate (kg/acre) |
51 |
60 |
0.000 |
|
Sowing method (%) |
|||
|
Drill |
10 |
8 |
|
|
Broadcast |
90 |
92 |
0.000 |
Table 2 shows the application of seed rate, and sowing method. The seed rate applied was 51 kg/acre on early planted wheat fields. As compare to late planted wheat fields, farmers used 9 kg more seed in order to compensate the delayed planting. Broadcasting of wheat is the usual method of wheat planting in the study area. Around 90% and 92% farmers used the method of broadcasting when wheat planted early and late and only 10% and 8% of farmers used drill method respectively.
Table 3: Management and application major inputs
|
Particulars |
Mean |
Std |
Prob. |
|
Use of Nitrogen (kg/acre) |
8.09 |
5.5 |
0.000 |
|
Use of phosphorus (kg/acre) |
28.3 |
8.02 |
0.000 |
|
NP ratio (per acre) |
3.52 |
0.244 |
0.000 |
|
Weedicide cost (per acre) |
1007.7 |
507.2 |
1.000 |
|
T. number of Ploughing (per acre) |
3.41 |
0.63 |
0.000 |
|
T. number of irrigation (per acre) |
3.85 |
0.51 |
0.000 |
Table 3 shows the wheat management differential, when wheat is planted earlier as compared to the delayed sowing. In the study area, almost all the farmers were aware of the requirement to apply both nitrogenous and phosphate fertilizers, though fertilizer application rates were slightly dissimilar among the farmers of sample area. Chemical fertilizer was used by 100% of the sample of the farmers. The quantity of nitrogen and phosphorus applied on average on wheat crop, were 8.09 kg per acre and 28.3 kg per acre, respectively. Weeds’ augmentations are the major problem of the study area. Use of weedicide spray was the most common method exercised by the farmers to control weeds. On average, per acre cost of weedicide sprays was 1007.7 in Rs. Around 3 to 4 numbers of the ploughings were done per acre for land preparation in the study. The total number of irrigations given to the wheat in the study area slightly varied. In case of early sowing fields, average number of irrigations was approximately 4 times per acre.
Present study testes a null hypothesis that out of two well renowned functional forms, namely Cobb-Douglas and Translog, which one is most appropriate for present analysis. To test this hypothesis, the maximum likelihood ratio test is employed as under:
Liklihood Ratio Test = -2* [ln H0 - h H1]
-2* [-551 - (-497)]
108
The maximum likelihood values from Cobb-Douglas production function and Translog production function were -551 and -497, respectively. The calculated value from log likelihood test was 108, and the tabulated value at 5% level of significance from Chi-square table was 41.33 with 28 degrees of freedom. The calculated value was greater than the tabulated value and hence the null hypothesis implies that Translog functional form is more appropriate than the Cobb-Douglas functional form. Therefore, the present study has employed the Translog functional for the current study.
The maximum likelihood estimates of the Translog frontier model are presented in Table 4. The value of the variance parameter in stochastic frontier production function is significant which demonstrates that the technical inefficiency has an influence on the wheat output. The results are also akin to the other studies such as Ali and Flinn (1989), Coelli and Battese (1996), Sharma et al. (1999), Croppenstedt (2005), Kamruzzaman and Islam (2008) and Javed et al. (2009). Subsequently, instead of conventional production function, stochastic frontier production function is sufficient for the representation of wheat farms’ data.
Table 4: Maximum Likelihood Estimation of the Translog Production Frontier
|
Variables |
Parameter |
Coefficient |
t-ratio |
|
Constant |
β0 |
0.705*** |
7.75 |
|
LnCWeed |
β1 |
-0.130 |
-1.53 |
|
LnFarmSize |
β2 |
0.676*** |
6.95 |
|
LnSeed.Variety |
β3 |
-0.246** |
-2.23 |
|
LnPloughing |
β4 |
0.405*** |
3.61 |
|
LnNP |
β5 |
0.589*** |
5.95 |
|
LnSeedRate |
β6 |
-0.203** |
-1.92 |
|
LnIrrigation |
β7 |
0.126*** |
3.18 |
|
LnCWeed2 |
β11 |
0.082 |
0.22 |
|
LnFarmSize2 |
β22 |
0.141 |
1.33 |
|
LnSeedVariety2 |
β33 |
0.165 |
1.61 |
|
Ln.Ploughing2 |
β44 |
-0.237 |
-0.51 |
|
LnNP2 |
β55 |
0.319*** |
3.68 |
|
LnSeedRate2 |
β66 |
0.177*** |
3.14 |
|
LnIrrigation2 |
β77 |
0.637 |
0.5 |
|
LnCWeed*Farm size |
β12 |
-0.400 |
-0.39 |
|
LnCWeed*SeedVariety |
β13 |
-0.55*** |
-4.42 |
|
LnCWeed*Ploughing |
β14 |
0.161 |
1.19 |
|
LnCWeed*NP |
β15 |
-0.192* |
-1.65 |
|
LNCWeed*SeedRate |
β15 |
0.251*** |
3.95 |
|
LnCWeed*Irrigation |
β16 |
-0.159*** |
-16.2 |
|
LnFarmsize*SeedVariety |
β23 |
-0.113*** |
-11.3 |
|
LnFarmsize*Ploughing |
β24 |
-0.364** |
-2.25 |
|
LnFarmSize*NP |
β25 |
0.186*** |
16.36 |
|
LnFarmsize*SeedRate |
β26 |
-0.254** |
-2.27 |
|
LnFarmsize*Irrigation |
β27 |
0.153*** |
15.64 |
|
LnSeedVariety*Ploughing |
β34 |
-0.496 |
-0.49 |
|
LnSeedVariety*NP |
β35 |
0.858 |
0.971 |
|
LnSeedVariety*SeedRate |
β36 |
0.134** |
2.22 |
|
LnSeedVariety*Irrigation |
β37 |
-0.152*** |
-14.1 |
|
LnPloughing*NP |
β45 |
-0.439*** |
-5.55 |
|
LnPloughing*SeedRate |
β46 |
0.54*** |
9.98 |
|
Ln.Ploughing*Irrigation |
β47 |
0.796* |
1.68 |
|
LnNP*SeedRate |
β56 |
0.117** |
2.20 |
|
LnNP*Irrigation |
β57 |
0.936*** |
12.12 |
|
LnSeedRate*Irrigation |
β67 |
-0.603*** |
-6.08 |
|
Inefficiency Model |
|||
|
Constant |
δ0 |
-0.0284*** |
-4.43 |
|
Experience |
δ1 |
-0.013** |
-2.27 |
|
Own-seed |
δ2 |
0.012** |
2.25 |
|
Education |
δ3 |
-0.028* |
-1.74 |
|
# of visit to extension center |
δ4 |
-0.019 |
-0.77 |
|
Distance from main market |
δ5 |
0.119*** |
3.33 |
|
Variance Parameters |
|||
|
Sigma-squared |
σ2 |
0.59*** |
15.8 |
|
Gamma |
γ |
0.629945** |
2.10 |
|
Likelihood function |
-497.64 |
||
In the study area the growth of weeds along with wheat crop, is a serious issue and has negative effects on wheat crop. Nayyar et al. (1992) argued that weed infestation is one of the main reasons for the low wheat yield in Pakistan. The sign of weedicide cost variable is negative but, insignificant. The major reason behind this negative sign is that the farmers of the study area applied the weedicide spray more than the optimum level and this resulted in unfeasible cost of production. Therefore, weedicide cost carried the negative sign, but it is not significant.
Farm size comes as an important factor of production with an elasticity of 0.676. This result shows that an increase in the area under wheat crop would significantly lead to the increased wheat yield, as greater farm size enables farmer to operate and manage modern equipment more efficiently. The positive estimated sign is as per our expectations. In Pakistan, extensive farming practice has been the fashion to increase the crop production instead of intensive farming to elevate the per acre yield.
To see the impact of wheat variety on wheat productivity, we used a variable that is defined as the wheat `seed variety for the wheat crop. The parameter estimate of wheat variety is negative and significant. This result shows that the per acre production declines significantly by using off beam wheat variety. In the study area, wheat farmers often face difficulty in sustaining high-quality of wheat yield, due to problem of using old wheat varieties instead of high yielding recommended ones. Byerlee et al. (1993) articulated that the adoption of modern wheat varieties in Pakistan has been precisely inactive. For higher wheat yield, farmers have to use new and recommended wheat varieties.
The coefficient of number of ploughing variable carry the positive sign and significant. The positive elasticity of number of ploughing indicate that as number of ploughing increased for land preparation its effect on wheat yield is positive and significant.
The NP ratio variable has a positive sign and is also statistically significant at five percent. This result shows that there is a scope for increasing production of wheat by raising the use of NP ratio in the study area. According to Salam (1981), intensive use of fertilizer on wheat crop is one of the major sources of higher wheat yield. Ahmad et al. (2002), Ghaderxadeh and Rahimi (2008) and Kaura et al. (2010) also found that higher use of NP ratio positively and significantly affects wheat yield.
The parameter of seed rate variable is negative and statistically significant. This result shows that a 1% increase in the seed rate leads to a -0.203 percent decrease in wheat production. The number of per acre plants affect directly the production and per acre plants in turn depend upon the per acre seeds, used. Due to deviation in the seed use from the optimal use, as recommended by the government, seed rate negatively affected the yield. Hence, application of wheat seed, more than optimum level only increased the cost of production. Similar results also found in previous studies, i.e. Hassan (2005) and Kaura et al. (2010).
The coefficient of number of irrigation is also significant and carries the positive sign. The magnitude of the parameter estimates show that wheat productivity increases as the number of irrigations increases. According to Looney (1999), the inadequate supply of water during the application of other inputs, diminishes the effectiveness of these inputs. Bashir et al. (2004) argued that the shortages of water supply at the critical time of plant growth, have severe effect on wheat crop. The Similar findings are also found in earlier studies i.e. Ahmad et al. (1998) and Hassan (2004).
Table 4 shows the results of inefficiency model as well. The result of parameter estimates of education of wheat farmer is negatively and significantly related to technical inefficiency as expected. As the farmers’ education increases, it negatively affects technical inefficiency of the wheat farms. This is for the reason that educated farmer is constantly more concerned about up-to-date wheat varieties and other most modern inputs that assist to increase the wheat output. Similar result found in previous studies i.e. Ali and Flinn (1989), Coelli (1998), Bettese et al. (1996) and Ahmad (2002).
The results also imply that the use of last years’ own wheat seeds, increases technical inefficiency. This variable had been incorporated as a dummy variable which is binary. It takes the value of unity if the farmer uses own seeds of the previous year’s crop and zero otherwise. Instead of purchasing new seed varieties, majority of the farmers prefer to use own seeds of the last year’s crop in the study area. This leads to a negative impact on the wheat yield.
The number of visits to extension center variable used as dummy variable. It takes the value one if farmers visits to extension center, and otherwise zero. The coefficient of number of visit to extension center carry negative sign but insignificant. In the study area, the farmers’ trend to visit the extension services center is very inactive. If farmers’ visits toward extension services center increased Farmers’ awareness to new farm practices and adoption of new seed varieties might be increased. Same result also found in the study of Abeduallah et al. (2006).
The coefficient of experience of the farmer is carry the negative sign and statistically significant at 5 percent level. This result of study reveal that as year of experience increases the farm inefficiency declines. Abeduallah et al. (2006) also found the similar results.
The parameter estimate of distance form main market is significant and positively related to the technical inefficiency as expected, as the distance from main market increases, wheat farms’ technical inefficiency diminishes. This is due to the reason that increases distance decreases the access to the high yielding varieties of the seeds. Greater market access increases the knowledge of the farmer about the better inputs.
The variable justification has been done for all the independent variables of technical efficiency and inefficiency models in the context of the factual circumstances that prevailed at the time of the data collection.
Figure 1: Frequency distribution of technical efficiency of wheat farmers
The Figure 1 shows the frequency distribution of wheat farms, the result shows the substantial technical inefficiency in wheat farms. The average technical efficiency of 78% of the wheat farms, shows that given the accessible technology, the wheat farmer could augment, on average the technical efficiency of wheat farms by 22% by efficiently utilizing the inputs, especially appropriate wheat seed varieties.
Conclusions
Pakistan has been almost regularly importing wheat, except for the few years. It is because domestic production has remained short of demand as a result. How these should be managed, it is the smouldering question. The result of the efficiency analysis shows that the average technical efficiency turned out to be 78 percent. Thus an average farmer is producing 22 percent less than potential wheat output. This result divulges that the wheat farmers that used own-wheat seeds, instead of modern high yielding varieties are comparatively less efficient than those farmers, who cultivate modern wheat varieties. For high wheat yield, it is necessary for the farmers of Pakistan that they make the most of new and approved wheat varieties that go well with the climatic condition of their area. Though in this progression, farmers have to expend more money for most recent wheat seed variety. However, the end results are more profitable then cost of seed input. The most imperative elementary conclusions of the study have been that the traditional wheat variety is negatively affecting the wheat yield in the study area. As the new wheat growing season is approaching, government should immediately announce the approved and censured wheat seed varieties and, make it possible to descend this information towards farmers. Government needs to take few steps through regulation to curb fake and low yielding supply of wheat seeds in the country. It is necessary to solicit for the issuance of an ordinance to ensure the supply of quality of recommended seeds/varieties to the farmers.
References
- Abedullah, Bakhsh, K. and Ahmad. B. 2006. Technical efficiency and its Determinants in Potato Production, Evidence from Punjab, Pakistan. The Lahore Journal of Economics, 11(2):1-22.
- Ahmad, M and Ahamd, A. 1998. An Analysis of the Sources of Wheat Output Growth in the Barani Area of the Punjab. The Pakistan Development Review, (autumn 1998) pp. 231–249.
- Ahmad, M., G. C. Mustafa, and M. Iqbal. 2002. Wheat Productivity, Efficiency, and Sustainability: A Stochastic Production Frontier Analysis. The Pak. Dev. Rev. 41: 643-663
- Ali, M. 1986. The Determinants of Inefficiency in Basmati Rice Production in Pakistan Punjab: Frontier Profit Function, Department of Agricultural Economics, University of Philippines at Los Banos, Philippines.
- Ali, M. and J.C. Flinn 1989. Profit Efficiency among Basmati Rice Producers in Pakistan Punjab, American Journal of Agriculture Economics, 71, 303–10. http://dx.doi.org/10.2307/1241587
- Aigner, D.J., Lovell, C.A.K. and Schmidt,P. 1977.Formulation and Estimation of Stochastic Frontier Production Function Models, Journal of Econometrics, 6, 21-37. http://dx.doi.org/10.1016/0304-4076(77)90052-5
- Bashir, A. Mahmood, M. A. Sheikh, A. D. and Kashif, M. 2004. National wheat survey, 2003: Causes of yield decline in the irrigated Punjab.
- Batesse, G.E., Broca S.S. 1997. Functional Forms of Stochastic Frontier Production Functions and Models for Technical Inefficiency Effects: A comparative Study for Wheat Farmers in Pakistan, Journal of Productivity Analysis, 8: 395–414. http://dx.doi.org/10.1023/A:1007736025686
- Battese, G.E Malik J.S and Gill A.M. 1996. An Investigation of Technical Inefficiencies of Production of Wheat Farmers in Four Districts of Pakistan. Journal of Agricultural Economics, 47 pp. 37-49. http://dx.doi.org/10.1111/j.1477-9552.1996.tb00670.x
- Battese, G.E., and S. Hassan. 1999. Technical efficiency of cotton farmers in the Vehari District of Punjab, Pakistan. Pakistan Journal of Applied Economics, 15:41-53.
- Battese G. E. and Coelli T. J. 1995. A Model for Technical Inefficiency Effects in a Stochastic Frontier Production Function for Panel data. Empirical Economics, 20: 325-332.
- Bauer P.W 1990. Recent Developments in the econometric estimation of frontiers. Journal of Econometrics
- Bravo-Ureta, B.E. and A.E. Pinheiro. 1993. Efficiency Analysis of Developing Country Agriculture: A Review of Frontier Function. Agricultural and Resource Economics Review 22, 88–101.
- Byerlee, D.1987. Maintaining the momentum in Post-Green Revolution agriculture: A micro-level Perspective from Asia. MSU Int’l. Dev. Paper No.10.Unint of Michigan
- Charnes A. Cooper W. W. and Rhodes. E. 1978. Measuring the Efficiency of Decision Making Units. European Journal of Operation Research, 2429-444. http://dx.doi.org/10.1016/0377-2217(78)90138-8
- Coelli, T.J. 1998. An Introduction to Efficiency and Productivity Analysis. Kluwer Academic Publishers. http://dx.doi.org/10.1007/978-1-4615-5493-6
- Coelli, T.J. 1995. Recent Developments in Frontier Modeling and Efficiency Measurement. Australian Journal of Agricultural Economics, 39(3):219-245. http://dx.doi.org/10.1111/j.1467-8489.1995.tb00552.x
- Croppenstedt, A. 2005. Measuring technical efficiency of wheat farmers in Egypt, ESA. Working Paper No. 05-06. Agricultural and Development Economics Division.
- Farrell, M. J. 1957. The measurement of productive efficiency. Journal of the Royal Statistical Society, 120 (3): 253–290. http://dx.doi.org/10.2307/2343100
- Farooq A 2009. ‘Food Security in Pakistan’, Pak. J. Agri.Sci., 46(2)
- Farooq A, Ishaq M, Yaqoob S, and Sadozai N.K. 2007. Varietal Adoption Effect on Wheat Crop Production in Irrigated Areas of NWFP, Sarhad J.Agric 23(3) pp 807-814.
- Ghaderzadeh,H and Rahimi, H. M 2008. Estimation of Technical Efficiency of Wheat Farms: A Case Study in Kurdistan Province, Iran. American-Eurasian j. Afric & Environ. Sci. 4(1): 104-109.
- Ghimire S, Mehar M, and Mittal S. 2012. Influence of Sources of Seed on Varietal Adoption Behavior of Wheat Farmers in Indo-Gangetic Plains of India” Agricultural Economics Research Review, (Conference Number) pp 399-408.
- Hassan, S. 2004. An Analysis of Technical Efficiency of Wheat Farmers in the Mixed Farming System of the Punjab, Pakistan, International Journal of Agriculture & Biology, pp 431-435
- Hassan.S. 2005. Stochastic Frontier Function, Application Hypothesis Testing, International Journal of Agriculture & Biology, pp 427-430
- Iqbal M, Khan. A, M, and Ahmad, M. 2002. Adoption of Recommended Varieties: A Farm level Analysis of Wheat Growers in Irrigated Punjab” The Pakistan Development Review, (spring) pp.29-48 231–249.
- Javed I.M Adil A.S, Hassan S, Ali A. 2009. An Efficiency Analysis of Punjab’s Cotton-Wheat System. The Lahore Journal of Economics 14: 2 (Winter 2009): pp. 97-124
- Kamruzzaman,M and Islam,H.M. 2008. Technical Efficiency of Wheat Growers in some Selected Sites of Dinajpur District of Bangladesh, Bangladesh J. Agril. Res. 33(3), 363-373. http://dx.doi.org/10.3329/bjar.v33i3.1595
- Kumbhakar, S. C. and C. A. Lovell 2000. Stochastic Frontier Analysis. Cambridge University Press. http://dx.doi.org/10.1017/CBO9781139174411
- Looney E.R. 1999. Private Sector Investment in Pakistani Agriculture. The Role of Infrastructure Investment.
- Kaura M, Mahal K.A, M.K. Sekhona K.M and Kingraa S.H. 2010. Technical Efficiency of Wheat Production in Punjab: A Regional Analysis, Journal of Agricultural Economics Research Review, 23(1).
- Matuschke I, and Qaim M. 2006. Adoption and Impact of Hybrid Wheat in India, International Association of Agricultural Economists Conference, Gold Coast, Australia
- Meeusen, W. and J. Van den Broeck 1977. Efficiency Estimation from Cobb-Douglas Production Functions with Composed Error, International Economic Review. 18, 435-444. http://dx.doi.org/10.2307/2525757
- Nayyar, M.M., M. Shafi, M.L. Shah and T. Mahmood, 1992. Weed eradication duration studies in wheat. In: Weed Management for Sustainable Agriculture Proc. 4th All Pakistan Weed Science Conference, Pp: 147–53.
- Pandit B.D, Islam M.M, Rashid H.M and Sufian A.M. 2006. Participatory Variety Selection in Wheat and Its Impact on Scaling-up Seed Dissemination and Varietal Diversity, Bangladesh J.Agril.Res. 32(3) pp.473-486.
- Salam, A. 1981. Farm Tractorization, Fertilizer use and Productivity of Mexican Wheat in Pakistan; Pakistan Development Review Vol. XX, 2. pp. 323-346.
- Seiford, L.M. and R.M. Thrall. 1990. Recent Developments in DEA: The Mathematical Programming Approach to Frontier Analysis. Journal of Econometrics 46, 7–3. http://dx.doi.org/10.1016/0304-4076(90)90045-U
- Shah A. N, Saeed I, Farooq A and Afzal M. 2012. Adoption and Economic Impact of improved Wheat Varieties in Rainfed Pothawar, Punjab, Pakistan”, Journal of Biotechnology and Pharmaceutical Research, 3(5) pp 94-103.
- Sharma, K. R. Leung, P. S. and Zaleski, H. M.1999. Technical, Allocative and Economic Efficiencies in Swine Production in Hawaii: A Comparison of Parametric and Nonparametric Approaches”, Agricultural Economics, 20:23-35.
- Witcombe, J. R. 1999. Do farmer-participatory methods apply more to high potential areas than to marginal ones? Outlook on Agriculture, 28, 43-59.
To share on other social networks, click on any share button. What are these?


