
Impact of Virginia Tobacco Cultivation on Poverty Status: Evidence from District Charsadda, Khyber Pakhtunkhwa


Research Article
Impact of Virginia Tobacco Cultivation on Poverty Status: Evidence from District Charsadda, Khyber Pakhtunkhwa
Majid Khan, Naveed Jehan*, Muhammad Zahoor and Nadia Naz
Economics Department, University of Peshawar, Khyber Pakhtunkhwa, Pakistan.
Abstract | The study was conducted in 2015-2016 in Tehsil Tangi, Charsadda District, Khyber Pakhtunkhwa. The aim was to analyse the poverty status of the Virginia Tobacco growers in the study area with Poverty Gap Index (PGI) method. The primary data was collected through structured questionnaire from 159 farmers. Monthly farmers’ income was calculated from the total crop and non-crop income. The results revealed that the poverty ratio and Poverty Gap index were 8.3 percent and 0.016 percent for the Virginia tobacco growers and 42.52 percent and 0.076 percent for the non-tobacco growers, respectively. This shows that the Virginia Tobacco growers poverty status was better. Therefore, tobacco is recommended as cash crop in Charsadda District to reduce the poverty incidence.
Received | August 24, 2017; Accepted | December 24, 2019; Published | February 01, 2020
*Correspondence | Naveed Jehan, Economics Department, University of Peshawar, Khyber Pakhtunkhwa, Pakistan; Email: [email protected]
Citation | Khan, M., N. Jehan, M. Zahoor and N. Naz. 2019. Impact of virginia tobacco cultivation on poverty status: Evidence from District Charsadda, Khyber Pakhtunkhwa. Sarhad Journal of Agriculture, 36(1): 161-167.
DOI | http://dx.doi.org/10.17582/journal.sja/2020/36.1.161.167
Keywords | Virginia Tobacco, Poverty Gap Index (PGI), Head Count Ratio, Per Capita Income, Poverty line
JEL Classification: I32, O12, P36, P46, R2
Introduction
Pakistan is considered as an agricultural economy, with about 70 percent of the population directly or indirectly depends on agriculture for their living (Usman, 2016). They grow two kinds of crops namely food and non-food crops, includes vegetables, fruits, rice, cotton, tobacco, products of the soil (Rani et al., 2013). Among them tobacco appears as the most appealing commodity since it is less perishable and have worldwide market value. The tobacco industry and private companies offer loans along with technical support to farmers having familiarity with tobacco cultivation. Revenue from tobacco cultivation may seem beneficial to farmers and national governments at first. Tobacco farmers, however, perceived that they have greater profits from tobacco product due to their higher gross income (Grewal and Ahmad, 2011). Tobacco is one of the significant cash crop of Pakistan and its leaves are called golden leaves. In general, it is cultivated mostly in the areas of Khyber Pakhtunkhwa and Punjab. In Khyber Pakhtunkhwa, Swabi, Mardan, Charsadda, Peshawar, Minsera and Abbottabad are the main growing areas while in Punjab districts Okara and Gujarat are prominent (GoP, 2012). Virginia Tobacco has proved to be a cash crop for Khyber Pakhtunkhwa farmers. It has provided employment opportunities about 1.13 million people comprising 80,000 farmers and 50,000 industrial manpower alongwith one million people involved in the final product trade. In addition, it has contributed Rs. 60 billion in annual revenue for the government treasury as a sales tax / federal tax (Faraz, 2012).
Charsadda District is one of Virginia’s largest tobacco production areas in Khyber Pakhtunkhwa, with approximately 15 percent of the production quota (GoKP, 2013). Tobacco cultivation leads the array of economic activities of entrepreneurs, including farmers, daily wage workers, production and processing processors, shopkeepers, firewood vendors, carriers, and many other tobacco manufacturing and marketing institutions (Brussels, 2003). Charsadda’s main cash crops are sugar cane and Virginia tobacco and horticultural crops. The study area is irrigated by two main canals namely Upper Swat Canal and Lower Swat Canal where many distributors have been selected to irrigate the tobacco farms. Since there is a considerable amount of water in the Lower Swat Canal area, sugarcane cultivation is done in the Upper Swat Canal whereas in the Lower Swat Canal area there is no supply of sufficient water (GoKP, 2011) due to which sugarcane is not profitable crop for farmers. So people used to cultivate Virginia tobacco as a cash crop because of less water requirements as compared to their competitive cash crop (Ali et al., 2013). The main objectives of the study were as to find out poverty status of the farmers on the basis of their income; and to suggest poverty reduction measures in the light of the findings.
Materials and Methods
The universe of the study was comprised of the tehsil Tangi of district Charsadda, Khyber Pakhtunkhwa. Tehsil Tangi is comprised of eleven union councils. Virginia tobacco was grown mostly in seven union councils. The proportionate purposive sampling, non-probability, technique was used for determining sample size from each union council of the selected area. There were 3500 growers cultivating on 3423 hectares in the selected union councils of Tangi tehsil (GoKP, 2016). Out of these, a sample of 159 was determined by employing sampling formula with 99 percent confidence level at 1 percent confidence interval on the basis of growers’ population in the study area (Chaudhry and Kamal, 2006).
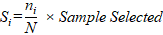
Where;
Si is the selected sample from “ith” union council that is those villages were selected which fulfilled the research objective requirements, ni is the population of farmers in “ith” union council, N is total population of farmers in the research area. By employing the above-mentioned sampling formula, the sample size at union council level was proportionately computed as under:
Koz Behram Dherai: SKBD= 273/3500*159 = 12
Ziam: Sz= 466/3500*159 = 21
Hari Chand: SHC= 599/3500*159 = 27
Mandani: SM= 699/3500*159 = 32
Dhakki: SD= 761/3500*159 = 35
Shodag: SS= 289/3500*159 = 13
Hisara Nehri: SHN= 413/3500*159 = 19
Determining the poverty status
This study use the Pakistan Planning Commission poverty line, which is 673.54 per month per adult The poverty line has been adjusted occasionally in 2001, 2004 and 2005 by using average CPI of each period. The poverty line was upgraded from 2007 to Rs. 1023 per month per adult to the year 2016 as shown in Table 1. Therefore, for the purpose of this study, a person is considered to be poor if his/her income per month less than Rs. 2340.43.
Table 1: Estimated poverty line up to the year 2016.
| Year | Inflation rate (%) | Poverty line (Rs.) |
| 2007-08 | 12.00 | 1145.76 |
| 2008-09 | 17.03 | 1340.88 |
| 2009-10 | 10.10 | 1476.31 |
| 2010-11 | 13.66 | 1677.98 |
| 2011-12 | 11.01 | 1862.72 |
| 2012-13 | 07.36 | 1999.82 |
| 2013-14 | 8.62 | 2172.2 |
| 2014-15 | 4.81 | 2276.69 |
| 2015-16 | 2.80 | 2340.43 |
Source: Pakistan Economic Survey, 2016.
Poverty gap index
PGI measures that how much on average the income of poor person is short of the poverty line (Foster et al., 2014).

Where;
Z= poverty line; yi= income of the poor people; The PGI was estimated by arranging the income in ascending order , whereas, in arrangement the poorest has ‘y1’, the next poorest will be ‘y2, y3, … ,yq’, and the least poorest at ‘Yq’; since by definition “y” would be no longer greater than the poverty line, ‘z’.
The major limitation of the Poverty Gap Index measure is that it may not convincingly capture the difference in the severity of poverty. Thus, to overcome this limitation, Squared Poverty Gap Index (PGI2) will be used. It will be measured by using the formula elaborated as under:

Key factors affecting poverty status
Binary choice models were attempted for analyzing poverty status in the present study. Thus, the Probit model was employed for finding the factors affecting the poverty status on the basis of distribution function of stochastic term (Salsaya et al., 2007). Probit model elicited in equation form, as under:
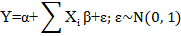
Where:
Y= Poverty status, ‘1’ for Non-Poor; ‘0’ otherwise; X1= Farm size (Hectares); X2= Family size (Number of households); X3= Dependent members (Number); X4= Education level (Years); X5= Ownership nature; ‘1’ for Owner, ‘0’ otherwise; X6= Dummy for tobacco; ‘1’ for Virginia Tobacco growers, ‘0’ otherwise; X7= Agriculture Share in income (%); X8= Non-Agriculture share in income (%).
Results and Discussion
This section deals with the findings of the study. Agriculture is the main provider of employment in the study area but the people involved in farming were poor and food insecure. This is mainly because of the small farm size holders and their high dependency on the farming. The prevalent farming practices are traditional with low per acre yield. They cannot adopt improved farming practices at their farms due to exhibiting low incomes, and hence they remained in poverty.
Both Virginia tobacco and non-Virginia tobacco growers were studied separately. Table 2 reveals that agriculture income of Virginia tobacco growers were high due to holding large farm size as compared to non-Virginia tobacco growers. The average family size of both Virginia and non-Virginia tobacco growers were same but dependency level was different and it was also seems in average education level. The average education level of non-Virginia tobacco growers was lower than their counterparts. Productive education teaches the latest production techniques that allow them to increase crop productivity. Virginia tobacco growers were mostly getting their income form agriculture sources but due to less average farm size the non-Virginia tobacco growers used to meet their needs from non-agricultural sources.
Table 2: General information of the Virginia and Non-Virginia tobacco growers in the study area.
| Virginia tobacco growers | Non-tobacco growers | |
|
Average farm size (Hectares) |
1.71 | 0.56 |
|
Tenancy status (%) |
||
|
a) Tenant farmers |
63.00 |
44.22 |
|
b) Owner cum tenants |
11.60 |
15.40 |
|
c) Farm owners |
25.40 |
40.38 |
|
Total |
100 |
100 |
|
Average education level (years) |
9.80 | 9.01 |
|
Average family size (No) |
9.81 |
9.58 |
|
Average dependency ratio (%) |
1.73 | 3.21 |
|
Average non-dependency ratio (%) |
8.08 | 6.37 |
|
Income source (%) |
||
|
A) Agriculture income (%) |
80.97 |
59.36 |
|
b) Non-agriculture income (%) |
19.03 |
40.64 |
|
Total (%) |
100 |
100 |
Source: Author’s own calculations.
Table 3 shows three different combinations of cropping patterns. In combination-I, there were 65 percent farmers who used Virginia tobacco practices followed by summer maize and melon gourd. Further, there were 6.38 percent people living below the poverty line and 2.8 percent income was required to cross the threshold level. In the combination-II, total 15 percent farmers used Virginia tobacco practices followed by cauliflower production. In this copping sequence 9.09 percent people were living below the poverty line and the required income to reach the poverty line was 0.06 percent. In the combination-III, about 20 percent farmers used Virginia tobacco practices followed by barley production. There were 14 out of total 72 growers who used to follow this cropping sequence and only two growers were found below the poverty line in this combination. The poor on average have an income shortfall by 0.70 percent to get rid of from the pro-poverty. The overall scenario showed that only 8.33 percent people were living below the poverty line and overall 1.6 percent income needed to get out from poverty status. Comparing all the three cropping combinations revealed that more poverty persisted in cropping combination-III followed by combination-II and I. The poverty level in combination-I was lowest amongst the other combinations which showed that cropping pattern of combination-I was optimum. The PGI2 shows the extent of income inequality among the poor themselves. There was 1.63 percent inequality exhibited among the poor themselves in the crops combination-I while it was 0.04 percent and 0.06 percent among the crops combination-II and crops combination-III, respectively.
Table 3: Poverty status of Virginia tobacco growers.
| Measures | Cropping pattern (different combinations) | |||
| I | II | III | All | |
| No. of farmers (%age of total) |
47 (65) |
11 (15) |
14 (20) |
72 (100) |
| No. of poor farmers (%age of total) |
3 (50) |
1 (17) |
2 (33) |
6 (100) |
| Head count Ratio | 6.38 | 9.09 | 14.28 | 8.33 |
| PGI | 0.028 | 0.006 | 0.007 | 0.016 |
|
PGI2 |
0.0163 | 0.0004 | 0.0006 | 0.0067 |
Source: Author’s own calculations.
Table 4 shows five different combinations of non-Virginia tobacco growers. In combination-I, there were 33 percent farmers who used bitter gourd followed with cucumber cropping pattern. Further, there were 34.48 percent people living below the poverty line for which 3.1 percent income was required to cross the threshold level. In the combination-II, total 36 percent non-Virginia tobacco farmer’s practices bitter gourd followed by tomato cropping pattern. In this copping sequence 48.38 percent people were living below the poverty line and the required income to reach the poverty line was 5.3 percent. In the combination-III, about 13 percent non-Virginia tobacco farmers make practices of maize followed by wheat production and about 54.54 percent farmers were poor whereas 10 percent income was required to change their poverty status. In the combination-IV, about 9 percent non-Virginia tobacco farmers make practices of maize followed by melon gourd production and about 50 percent farmers were poor whereas 15.6 percent income was required to cross the poverty line. In the combination-V, about 9 percent non-Virginia tobacco farmers make practices of maize followed by pumpkin production and about 37.50 percent farmers were poor whereas 11.7 percent income was required to change their poverty status. In overall scenario, 38 out of 87 farmers were found to be poor among all groups of non-Virginia tobacco growers indicating 44 percent of the farmers were living below the poverty line. PGI of all non-Virginia tobacco growers was 0.076 that interpreted the poor on average have had an income shortfall by 7.6 percent from the poverty line.
Table 4: Poverty status of non-tobacco growers.
| Measures | Cropping pattern combination | All | ||||
| I | II | III | IV | V | ||
| No. of farmers |
29 (33) |
31 (36) |
11 (13) |
8 (9) |
8 (9) |
87 (100) |
| No. of poor farmers | 10 | 15 | 6 | 4 | 3 | 38 |
| Head count Ratio | 34.48 | 48.38 | 54.54 | 50.00 | 37.50 | 43.67 |
| PGI | 0.031 | 0.053 | 0.100 | 0.156 | 0.117 | 0.076 |
|
PGI2 |
0.009 | 0.026 | 0.057 | 0.017 | 0.043 | 0.052 |
Source: Author’s own calculations.
In Table 5, the poverty status of the Virginia tobacco growers was compared with non-Virginia tobacco growers. The difference showed that poverty level of non-Virginia tobacco growers were much higher than Virginia tobacco growers. The PGI showed that the non-Virginia tobacco growers were required extra 6 percent income to reach the poverty line. The PGI2 technique measures the severity of poverty in terms of degree of inequality amongst the poor themselves. In the table, inequality amongst non-Virginia tobacco growers were greater than Virginia tobacco growers. The non-Virginia tobacco growers have had greater number of poor as analyses revealed from higher poverty ratio as well as poverty gap index as compared to the Virginia tobacco growers. The farmers economic logic by choosing tobacco cultivation was evident mainly due to the reason that this crop yielded more profit than other competing crops. The productivity depends on the way that Virginia tobacco has a guaranteed advertising marvels because of somewhat purchase back office with ensured acquirement cost offered by the tobacco business. Hence, the farmer used to receiving the tobacco crop income cash at once with easy assured payment installments (Chaudhry et al., 2006). However, the farmers appeared reluctant to invest their income in other than Virginia tobacco crops cultivation due to number of reasons like non availability of nearby structured market for the vegetables, perishability nature of vegetables, difficulty in securing loans for non-Virginia tobacco crops, poor knowledge and skill for planting other new crops and also difficulty in finding good quality vegetable hybrid and non-hybrid seeds at affordable prices (Naher and Debra, 2007). The potential poor smallholders may be encouraged to cultivate partly Virginia tobacco for income increase and enhancing the foreign exchange earnings (Suryahadi et al., 2006). In line, the residential handling of tobacco, for example, sifting and cigarette assembling would have been a multiplier impact on creating business and venture open doors for the advantage of tobacco producers and also the tenant group of the area (Bentry, 2010).
Table 5: Comparative summary of the poverty status of Virginia tobacco growers with non Virginia tobacco growers.
| Measures | Virginia tobacco growers | Non-Virginia tobacco growers | Difference |
| Head count ratio | 8.33 | 43.67 | 35.34 |
| PGI | 0.016 | 0.076 | 0.06 |
|
PGI2 |
0.006 | 0.052 | 0.046 |
Source: Author’s own calculations.
Table 6: Probit Model estimates of poverty status.
| Poverty status | Coef. | Odd ratio | Z |
| Farm size | 0.0569 | 1.06 | 0.46 |
| Family earning hands | 0.6161*** | 1.85 | 3.54 |
| Family dependent members | -0.2286*** | 0.80 | -2.51 |
| Education level | 0.2731*** | 1.31 | 4.22 |
| Dummy ownership (tenancy) nature (‘1’ for owner, ‘0’ otherwise) | 0.3362 | 1.40 | 1.07 |
| Dummy crop enterprises (‘1’ for Virginia tobacco, ‘0’ otherwise, Non-virginia tobacco cultivation) | 0.2324*** | 1.26 | 2.95 |
| Agriculture share | 0.0823*** | 1.09 | 3.98 |
| Non-agriculture share | 0.0609*** | 1.06 | 3.59 |
| Constant | -10.7481 | 0.00002 | -4.73 |
|
Number of observations= 159; LR chai square (8)= 107.19; Prob > chai Square= 0.0000; Pseudo; R2= 0.5603; Log likelihood= -42.050233; *** Significant at 1%, ** Significant at 5%; * Significant at 10%. |
|||
| Dependent variable “poverty reduction status”, where ‘1’ for non-poor, ‘0’ otherwise, poor. | |||
Table 6 present the Probit model result. The Probit model estimates about poverty status shows that Poverty status (dependent variable) depends upon a number of independent variables. The estimated coefficient of farm size was 0.057, which is statistically insignificant. The coefficients of family earning hands, family dependent members and education level were 0.616, -0.229 and 0.336, respectively; and all of the three variables are statistically significant at one percent level of significance. Furthermore, the dummy variables including tenancy status, Virginia tobacco vs. non-tobacco growers as well as agriculture and non-agriculture shares of farmers’ income were also important and significant determinants towards influencing the poverty alleviation status. Since the signs of all independent variables are robust except farm size and dummy of tenancy status with right signs towards the dependent variable, the extent of poverty status. The value of Pseudo R2, (0.56) revealed that 56 percent of the variation had explained by the currently included independent variables in the model. The results portrayed that farm size has a positive influence but statistically insignificant role in the poverty reduction due to the fact that more than 60 percent of the farmers of the research area were tenants or owner cum-tenants and they were pay a major share of their income as rent of the land. Number of earning hands in a family showed positive sign of coefficient that interpreted with an increase of one unit from mean value of family earners it is probable to reduce poverty. Similarly, education level, crop dummy (Virginia tobacco when ‘1’ otherwise, non-tobacco when ‘0’) and income share of agriculture and non-agriculture had also been playing positive and highly significant role in turning the poor farming community to come out of poverty status. These factors were also significant at one percent level of significance. However, the results are robust with right signs. It also revealed that an increase of one unit in the mean number of dependent members that caused a rise in poverty intensity by 20 percent at statistically higher significant level of confidence. Ali et al. (2013) found in their study that there was positive relationship between education and poverty reduction, i.e., poverty increase with the increase in education level. However, the results of this study contradicted with their study. Because in the region of the study, the cropping season of Virginia tobacco cultivation is in summer season when the poor students are also freely available for participating in Virginia tobacco production activities due to their summer holidays. Therefore, they used to work mainly in tobacco curing and other production, processing and marketing activities due to that they became able to finance their educational expenses throughout the year. Literature shows that dependency is a major cause of increasing poverty and the probit model estimates of this study also confirm the positive relation between dependency ratio and poverty status of the family along with other independent variables presented in this model, as also concluded by Hussain et al., 2011; Ali et al., 2013.
Conclusions and Recommendations
The study revealed that the poverty ratios and PGI for the Virginia tobacco growers were 8.3 and 0.016, and 43.67 and 0.076 for non-tobacco growers, respectively. These figures show that there was about eight percent poverty incidence found among the Virginia tobacco growers with shortfalls by 1.6 percent from the poverty line status. While the poverty incidence was about 43 percent among non-Virginia tobacco growers with short- falls by 7.6 percent from the poverty line status. It was concluded from the results that the poverty ratio in Virginia Tobacco growers was the lowest as well as the Poverty Gap is the least amongst all the crop combinations of the Virginia tobacco growers. Tobacco remains an attractive crop to farmers because it is less perishable than other crops, as well as, its global market price remains stable compared to other agricultural commodities. Findings of the study revealed that per acre income from this crop were more than all other crops of the area despite the high initial cost of production of Virginia tobacco. Other cash crops in the area were fruits and vegetables but the procurement as well as buy back prices was not fixed as announced earlier in case of tobacco due to which the returns were uncertain, and generally very low especially when farmers used to produce surplus vegetables. Farmers familiarity with tobacco cultivation is also aided government by announcing tobacco prices before sowing season as well as by technical support and loans offered from tobacco companies and the tobacco industry. Revenues from tobacco cultivation may appear advantageous to both farmers and national governments at the outset.
The results of this study showed that Virginia tobacco have outstripped income per hectare along with least poverty prevalent than other cropping pattern practiced in the area. Thus, it is feasible suggestion for the area growers to continue Virginia tobacco cultivation with different crops combinations especially high value vegetables and food and feed crops. For securing the assured income of farmers, marketing structure and conduct should be improved for fetching fair and guaranteed prices of other crops grown in combination with and without Virginia tobacco via announcing the indicative procurement prices before the growing season so that the farmers may able to choose profitable and demand driven crops. The demand for Pakistani Virginia tobacco may be boosted locally as well as in foreign markets through innovative research means by quality and post harvesting processing as a value chain for inducing income and employment opportunities for the area in particular and country in general.
Novelty Statement
The study recommended marketing structure to be improved for fetching fair and guaranteed prices to assure income of Virginia tobacco growers. Innovative research work should be initiated to boost Virginia tobacco in local and foreign markets as well.
Author’s Contribution
Majid Khan developed the theoretical framework while Naveed Jahan performed data analysis. Mohammad Zahoor designed the questionnaire and collected data. Nadia Naz completed write up of this article.
References
Ali, A., M. Shahzad and M.A. Khan. 2013. The Current Status of Nutritional Food Security in Rural Pakhtunkhwa. Balochistan J. Agric. Sci. 6(2): 372-378.
Amjad, R., G.M. Arif and U. Mustafa. 2008. Does the Labor Market Structure Explain Differences in Poverty in Rural Punjab? Lahore J. Econ. Spec. Ed., 139-162. https://doi.org/10.35536/lje.2008.v13.isp.a9
Bentry, M. 2010. The impact of tobacco marketing and pricing policy reforms on income inequality amongst growers in Malawi: What lessons can be learnt from the Australian Experiences? Pap. Present. Aust. Agric. Resour. Econ. Soc. (AARES), Nat. Conf., Aust. Adelaide Conv. Centre, Adelaide, South Aust.
Brussels. 2003. The economics of tobacco use and tobacco control in the developing world. A background paper for the high level round table on tobacco control and development policy. Organized Eur. Comm. collab. World Health Org. World Bank.
Chaudhry, I.S., S. Malik and M. Sharif. 2006. Rural poverty in Pakistan, some related concepts, issues and empirical analysis. Pak. Econ. Soc. Rev., 44(2): 259-276.
Chaudhry, S.M. and S. Kamal. 2006. Introduction to Statistical Theory. Part-II, 6th Edition, Ilmmi Kitab Khana, Kabir Street Urdu Bazar Lahore. Chp.18: 259-261. https://doi.org/10.1177/1464884906065526
Faraz, K. 2012. Exports and imports of tobacco. Pakistan’s premier financial daily. www.brecorder.com/225/2/830.htm (last visited on 23rd June 2017). .
Foster, J., J. Greer and E. Thorbecke. 2014. The Foster-Greer-Thorbecke (FGT) poverty measures: Twenty-Five years later. Institute for International Economic Policy working paper series. Elliott School Int. aff. The George Washington Univ.
GoKP. 2016. Development statistics of Khyber Pakhtunkhwa. Bureau Stat., Plann. Dev. Dep., KP.
GoKP. 2013. Agriculture statistics, Khyber Pakhtunkhwa. Bureau of Stat., Plann. Dev. Dep., KP.
GoKP. 2011. Food security and livelihoods, water, sanitation and hygiene. Integ. Rapid Assess. Rep. ACF Int. Action Against Hunger, Pakistan.
GoP. 2012. Agriculture statistics of Pakistan, 2011-12. Minist. Food Agric. (Economic Wing), Islamabad, Pakistan.
GoP. 2016. Pakistan economic survey. Economic advisory wing, finance department, Islamabad, Pakistan. Chapter 7, pp. 120.
Grewal, B. and A. Ahmad. 2011. Agriculture and poverty reduction: Literature review and outstanding issues. Int. Works. Role Agric. Poverty Reduction Centre Strateg. Econ. Stud., Victoria Univ., Melbourne, Australia.
Hussain, A., A. Bashir, M.Z. Anwar and I. Mehmood. 2011. Agricultural productivity and rural poverty in the rice-wheat and mixed- cropping zones of the Punjab. Pak. J. Life Soc. Sci. 9(2): 172-178.
Khan, A.D. 2008. Economic development of the province. GoP, Agric. Dep., Peshawar, KP.
Naher, F. and D. Efroymson. 2007. Tobacco cultivation and poverty in Bangladesh: Issues and potential future directions. Study conducted as a technical document for the meeting of the Ad. Hoc. Study group on alternative crops established by the conference of the parties to the WHO Framework Convention on tobacco control, Dhaka University, Bangladesh.
Rani, S., M.A. Khan., H. Shah and A.S. Anjum. 2013. Profitability analysis of organic cauliflower, radish and turnip produce at National Agriculture Research Centre, Islamabad, Pakistan. Asian J. Agric. Rural Dev. 12(2): 929-935.
Salsaya, B., W. Mwangi., D. Mwabu and A. Diallo. 2007. Factors influencing adoption of stresstolerant maize hybrid (WH 502) in western Kenya. African J. Agric. Res. 2(10): 544-551.
Suryahadi, A., D. Suryadarma., S. Sumarto and J. Molyneaux. 2006. Agricultural demand linkages and growth multiplier in rural Indonesia. Soc. Monit. Early Response Unit (SMERU) Res. Inst. Jakarta.
Usman, M. 2016. Contribution of agriculture sector in the GDP growth rate of Pakistan. J. Glob. Econ. 4(2): 184. https://doi.org/10.4172/2375-4389.1000184
To share on other social networks, click on any share button. What are these?


