
Impact of Water Chestnut Addition on Development and Characterization of Supplemented Date Bar


Impact of Water Chestnut Addition on Development and Characterization of Supplemented Date Bar
Muhammad Nadeem1*, Aneeta Rehman1, Masooma Munir1*, Hira Fatima2, Faiqa Malik1, Aqsa Iqbal1 and Alaiha Asif3
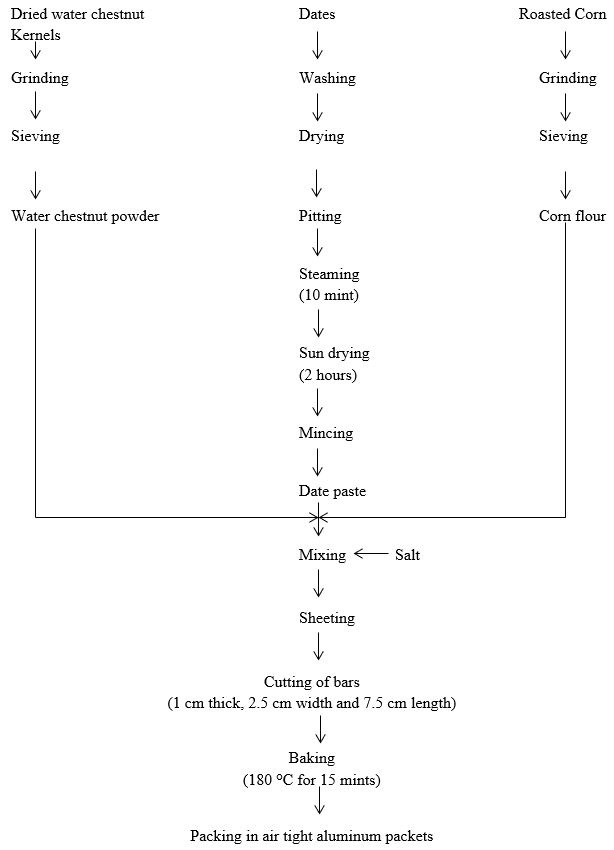
Flow Chart of water chestnut supplemented date bars.
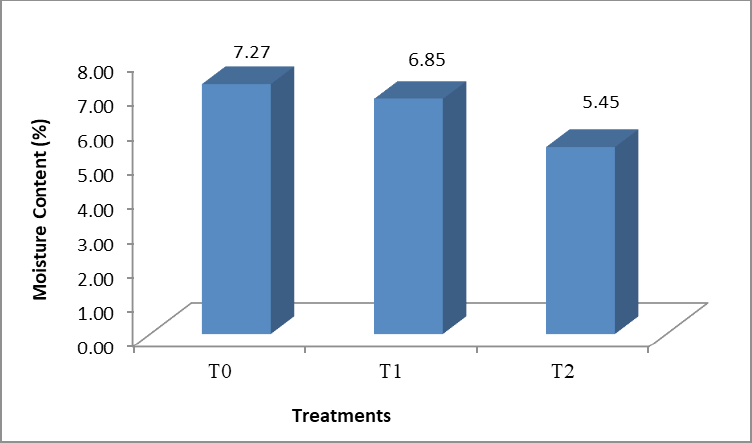
Moisture profile of different treatments of water chestnut supplemented date bars. T0= Date bars without addition of Water chestnut powder; T1= Date bars supplemented with 25% of Water chestnut powder; T2= Date bars supplemented with 50% of Water chestnut powder.
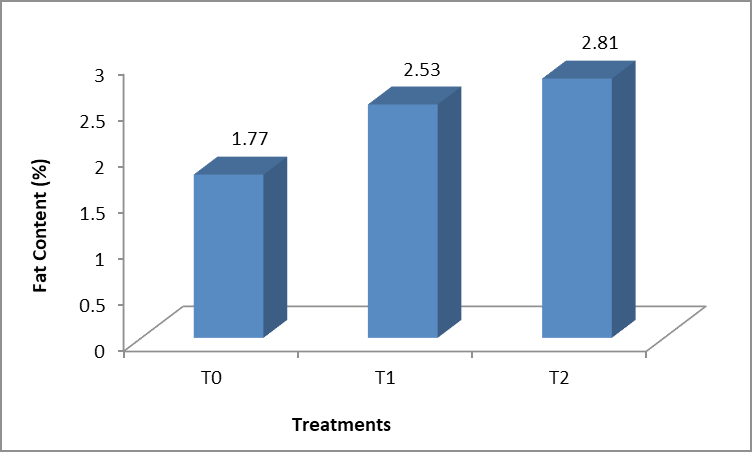
Fat profile of different treatments of water chestnut supplemented date bars. T0 = Date bars without addition of Water chestnut powder; T1= Date bars supplemented with 25% of Water chestnut powder; T2= Date bars supplemented with 50% of Water chestnut powder.

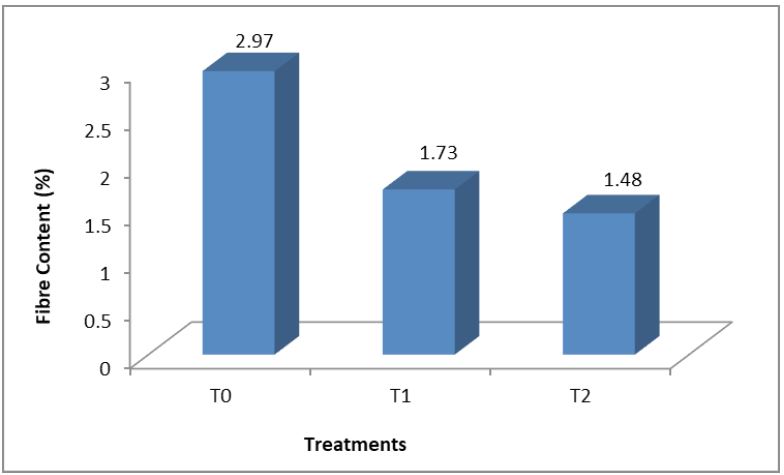
Fiber profile of different treatments of Water chestnut supplemented date bars. T0 = Date bars without addition of Water chestnut powder; T1 = Date bars supplemented with 25% of Water chestnut powder; T2 = Date bars supplemented with 50% of Water chestnut powder.


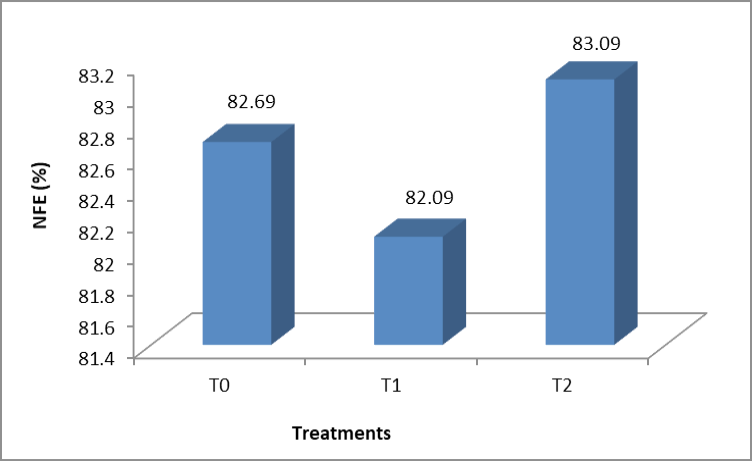
NFE profile of different treatments of Water chestnut supplemented date bars. T0= Date bars without addition of water chestnut powder; T1= Date bars supplemented with 25% of Water chestnut powder; T2= Date bars supplemented with 50% of Water chestnut powder.


