
Genetic Variability and Correlation Analysis in F2 Wheat Populations


Research Article
Genetic Variability and Correlation Analysis in F2 Wheat Populations
Abdul Haleem1*, Ghulam Hassan1, Arshad Iqbal2, Fahim Ullah Khan3, Muhammad Sajid3, Farhad Ahmad4, Rafi Ullah Khan5 and Mohammad Ilyas2
1Department of Plant Breeding and Genetics, The University of Agriculture Peshawar, Pakistan; 2Agricultural Research Institute (North) Mingora, Swat, Pakistan; 3Department of Agriculture, Hazara University Mansehra, Pakistan; 4Agriculture Research Station, Baffa Mansehra, Pakistan; 5Department of Biotechnology and Genetic Engineering, Hazara University, Mansehra, Pakistan.
Abstract | Development and evaluation of segregating derived from diallel cross provides an opportunity to identify potential transgressive segregant in early generation. To assess genetic variability, broad sense heritability and traits varied from, 36 lines of wheat were field tested in RCBD with three replications. The experimental materials include twenty eight F2 population and eight parents. Data showed considerable genetic variation amongst the studied lines, parents, F2 progeniessand parent versus F2 progenies for all the studied traits. Among parents, best lines were Atta-Habib for plant height (95.10cm) and tillers plant-1 (12.30), Janbaz for economic yield per plant (20.93g) and spike length (10.87cm), Khatakwal for 100-grain weight (3.27g). Among F2 progenies, best combinations were Khatakwal × Lalma-13 for plant height (93.96 cm), Janbaz × Pirsabak-05 for tillers plant-1 (12.90), Khatakwal × Tatara-96 for economic yield per plant (28.36 g), Pirsabak-05 × Lalma-13 for spikeletsspike-1 (20.10) and Pirsabak-13×janbaz for 100-grain weight (4.33 g). High broad sense heritability (0.69%) was recorded in cross combinations, Panjab11 × Lalma-13 for Tillers plant-1, Khatakwal × Pirsabak-13 for 100-grain weight (0.89%) and Pirsabak-05 ×Punjab-11 for economic yield per plant (0.99%) whereas genetic advance was recorded maximum for cross combination Tatara-96 × Lalma-13 for 100-gain weight and grain yield-1. Economic yield per plant displayed positive significant varied from with spikelet’s spike-11(r = 0.43**), 100 grain weight (r=0.58**) and spike length (r = 0.62**). The F2 progenies, Pirsabak-05× Lalma-13, Khatakwal × Pirsabak-13, Atta Habib × Pirsabak-05 and Tatara-96 × Punjab-11 were found promising for most of the traits and thus could be recommended for exploitation in future wheat breeding program.
Received | August 07, 2019; Accepted | October 23, 2021; Published | January 31, 2022
*Correspondence | Abdul Haleem, Department of Plant Breeding and Genetics, The University of Agriculture Peshawar, Pakistan; Email: arshadiqbal@aup.edu.pk
Citation | Haleem, A., G. Hassan, A. Iqbal, F.U. Khan, M. Sajid, F. Ahmad, R.U. Khan and M. Ilyas. 2022. Genetic variability and correlation analysis in F2 wheat populations. Sarhad Journal of Agriculture, 38(2): 398-408.
DOI | https://dx.doi.org/10.17582/journal.sja/2022/38.2.398.408
Keywords | Wheat, F2 Populations, Correlation anaylsis, Genetic
Introduction
Wheat is a self-pollinating annual crop which belongs to grass family Gramineae and one of the most growing cereal crops globally. Wheat delivers food to 36% of the worldwide inhabitants and subsidizes 20% of food calories. Wheat is grinded to flour which is the key product of wheat used for making different food items like roti, pastry, cakes, chapattis, and wafers, whereas straw is used for feeding animals. The total protein found in wheat is about 75%, among which gluten is one of the key proteins found in grains of wheat. Due to it wider adaptability and products derived from wheat grains, wheat is cultivated across forty-four nations worldwide (Kumar et al., 2017).
Wheat being a principal food of Pakistan, inhabits a noticeable position in the cropping-pattern of the country. As king off cereals, wheat is the most consumed grain crop leaving behind maize and rice in almost all parts of the globe due to its wider adaptability. During 2017-18 crop season, it was planted on wheat was cultivated on an area of 0.222 billion hectares with overall production of 0.75 billion tons with average yield of 3400 tons per hectares, worldwide (USDA, 2018). Likewise, total area under wheat cultivation was 0.0092 billion hectares which produced 0.0256 billion tons of wheat grains with average production of 2780kg per hectare, including the contribution of Khyber Pakhtunkhwa province of 0.0014 billion tons from 0.00077 billion hectares with average yield of 1814 kg ha-1 (PBS, 2017). Wheat production is affected significantly due to progressive global-climatic change and lack of water resources and deteriorating eco-environment (Singh and Chaudary, 2006). Pakistan has been facing wheat shortage with increasing population, and identification and development of better-quality varieties is key aim of every wheat breeder across the globe (Asif et al., 2005).
Heritability estimations deliver the data about index of transmission of the quantitative trait of commercial importance and are important for the current crop breeding approach. Genetic advance provides perfect representation and accurate picture of separating progenies for probable selection in the succeeding generation. Maximum values of broad sense heritability together-with high genetic-advance (GA) approve the possibility of selecting potentially new lines having desired features (Ajmal et al., 1995). Heritability and genetic advance are very valuable for calculating genetic progress in breeding program (Gite et al., 2018).
Correlation coefficient is a significant statistical technique which can help wheat breeders in selection of lines for maximizing yield. Literature exhibited the positive varied from between grain yield and yield associated traits in wheat such as spikes number plant-1 (Mondall et al., 2001), plant height (Mohamad, 1999), 1000-grain weight (Akbar et al., 1995). Nabi et al. (1998) and Shah et al. (1999) described positive varied from of grain yield with plant height, number of tillers plant-1, grains spike-1e and 1000-grain weight together at genotypic and phenotypic levels. In the current experiment, genotypic variability, heritability in broad sense, characters varied froms for identifying potential progenies which could be utilized in future wheat breeding programs.
Materials and Methods
This experiment was conducted in designated research farm of Agriculture University Peshawar during 2016-2017. Thirty-six lines including 8 parents and 28 F2 progenies were planted in standard RCB (randomized complete block) design having three repetitions (Table 1a and 1b). Each wheat lines were grown in 4.5 m long four rows with row - row and plant - plant distances of (30 & 15 cm, correspondingly.
Table 1a: List of parents used in the hybridization program.
|
Parent |
Parentage |
Breeding Centre |
|
Atta Habib |
"INQILAB 91*2/TUKURU |
Agri. Uni. Peshawar |
|
Khatakwal |
Landrace |
-- |
|
Janbaz |
GEN*2//BUC/FILK/3/BUCHIN |
Agri. Uni. Peshawar |
|
Lalma-13 |
"PASTOR/3/ALTAR84/AE.SQUARROSA(TAUS)//OPATA(SOKOLL) |
NIFA, Peshawar |
|
Tatara-96 |
JUP/ALO"S"//KLT"S"/3/VEE"S" |
NIFA, Peshawar |
|
Punjab-11 |
SA 42 *2/4CC/INIA//BB/3/ INIA/HD832 |
WRI, Faisalabad |
|
Pirsabak-05 |
MUNIA/SHTO//AMSEL |
CCRI, Pirsabak |
|
Pirsabak-2013 |
CS/TH.SC//3*PVN/3/MIRLO/BUC/4/MILAN/5/TILHI |
NARC, Islamabad |
Traits measurment
The height of the randomly selected plants was measured from the base to the top of the plants without awns using meter-rod at the stage of physiological maturity. Ten randomly selected plants were used to count productive tillers. Length of the spikes were measured using ten randomly selected spikes from the base until the top spikelets using scale at the stage of physiological maturity. The spikelet’s count per spike was recorded in the same spike used earlier for spike length. The selected spikes were later threshed to get 100 grains which were weighed to get the data of 1000-grain weight. Final data on grain or economic yield per plant was recorded by threshing each plant separately and weighed individually.
Table 1b: List of F2 progenies used in the experiment.
|
F2 progenies |
||
|
1. Lalma-13 × Atta Habib |
11. Pirsabak-13 × Atta Habib |
21.Khatakwal × Pirsabak13 |
|
2. Tatara-96 × Atta Habib |
12. Pirsabak-13 × Lalma-13 |
22. Janbaz × Atta Habib |
|
3. Tatara-96 × Lalma-13 |
13. Pirsabak-13 × Tatara-96 |
23. Janbaz × Lalma-13 |
|
4. Punjab-11 × Atta Habib |
14. Pirsabak-13 × Punjab-11 |
24. Janbaz × Tatara-96 |
|
5. Punjab-11 × Lalma-13 |
15.Pirsabak-13 × Pirsabak-05 |
25. Janbaz × Punjab-11 |
|
6. Punjab-11 × Tatara-96 |
16. Khatakwal × Atta Habib |
26. Janbaz × Pirsabak-05 |
|
7. Pirsabak-05 × Atta Habib |
17. Khatakwal × Lalma-13 |
27. Janbaz × Pirsabak-13 |
|
8. Pirsabak-05 × Lalma-13 |
18. Khatakwal × Tatara-96 |
28. Janbaz × Khatakwal |
|
9. Pirsabak-05 × Tatara-96 |
19. Khatakwal × Punjab-11 |
|
|
10.Pirsabak-05 × Punjab-11 |
20. Khatakwal × Pirsabak-05 |
|
Statistical analysis
Data collected on various parameters was analyzed using statistical package MSTATC. Upon significant variation among lines, averages were separated using Least significant variation) (LSD) test.
Broad Sense Heritability
The heritability in broad sense (h2BS) were computed following the equation:
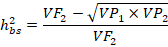
Where;
H2bs: Broad sense heritability; VF2: F2 Variance; VP1: Parent 1 variance; VP2: Parent 2 variance.
Genetic advance (GA)
The values of genetic advance were estimated using the equation suggested by Panse and Sukhatme (1965).
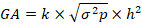
Where;
GA: Genetic advance; K: 1.76 (10% selection intensity);  : Phenotypic standard deviation; h2: Broad-sense heritability for a specific trait.
Genetic advance was expressed as percent of mean using the following formula;
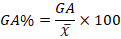
Where;
x̅: mean of F2 population for a specific trait.
Correlation
Correlation (between) yield and yield components characters were computed.
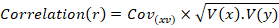
Cov: Covariance between x and y traits; V(x): Variance of x trait; V(y): Variance of y trait.
Table 2: Average squares>for<different characters of 36-wheat lines (8 parents and 28 F2 progenies) studied Agriculture University Peshawar.
|
SOV |
DF |
Plant height |
Tillers plant-1 |
Spikels spike-1 |
Spike length |
100-gran weight |
Economic yield per plant |
|
Reps |
2 |
1.78 |
1685.79 |
17.32 |
2.66 |
0.76 |
1.40 |
|
Lines |
35 |
35.73** |
1.89** |
3.39 |
1.52** |
0.62** |
26.12** |
|
Parents |
7 |
56.53** |
0.84 |
1.05 |
0.83 |
0.17 |
1.01 |
|
F2 |
27 |
31.66** |
2.23** |
3.75 |
1.65** |
0.59 |
29.54** |
|
P vs. F2 |
1 |
0.05 |
0.15 |
9.99* |
2.70** |
4.47** |
109.45** |
|
Error |
70 |
5.29 |
0.94 |
2.41 |
0.43 |
0.34 |
2.61 |
|
CV (%) |
2.57 |
15.71 |
11.31 |
6.16 |
17.58 |
7.37 |
*, ** = substantial at>5%>and 1%>probability level.
Results and Discussion
Plant height
The analysis exhibited) substantial variation ((P ≤ 0.05) in lines, parents and their F2 progenies, whereas parents vs. F2 progenies contrast was found non-substantial for plant height (Table 2). Khalid et al. (2011) and Sobia et al. (2014) found high substantial
Table 3: Average data of all lines (parents & their F2 population) for various characters.
|
Parents/ F2 Progenies |
Plant height (cm) |
Tillers plant-1 |
Spikelets spike-1 |
Spike length (cm) |
100-grain weight (g) |
Economic yield per plant (g) |
|
Atta Habib |
95.10 |
12.30 |
17.30 |
9.33 |
2.80 |
19.37 |
|
Lalma-13 |
91.50 |
11.60 |
17.73 |
10.67 |
2.67 |
20.30 |
|
Tatara-96 |
91.36 |
11.50 |
17.70 |
10.70 |
2.63 |
20.33 |
|
Punjab-11 |
91.83 |
10.36 |
17.03 |
10.20 |
3.13 |
20.03 |
|
Pirsabak-05 |
88.30 |
11.70 |
16.06 |
10.00 |
3.17 |
19.17 |
|
Pirabaq-13 |
90.96 |
11.60 |
16.36 |
10.57 |
2.93 |
19.70 |
|
Khatakwal |
83.20 |
11.80 |
16.93 |
10.83 |
3.27 |
20.30 |
|
Janbaz |
82.83 |
11.73 |
16.76 |
10.87 |
3.07 |
20.93 |
|
Range |
82.83 – 95.10 |
10.36 – 12.30 |
16.06 – 17.73 |
9.33 – 10.87 |
2.63 – 3.27 |
19.17 – 20.93 |
|
Lalma-13 × Atta Habib |
86.13 |
12.40 |
18.36 |
10.40 |
2.93 |
19.50 |
|
Tatara-96 × Atta Habib |
87.50 |
12.03 |
16.90 |
10.00 |
2.67 |
22.30 |
|
Tatara-96 × Lalma-13 |
93.20 |
12.06 |
17.83 |
10.26 |
2.67 |
20.90 |
|
Punjab-11 × Atta Habib |
90.10 |
12.00 |
18.00 |
10.77 |
2.67 |
21.20 |
|
Punjab-11 × Lalma-13 |
91.43 |
11.40 |
16.86 |
11.43 |
3.67 |
22.47 |
|
Punjab-11 × Tatara-96 |
87.43 |
12.60 |
18.10 |
10.17 |
3.80 |
18.50 |
|
Pirsabak-05 × Atta Habib |
88.06 |
10.43 |
18.16 |
11.07 |
4.33 |
24.33 |
|
Pirsabak-05 × Lalma-13 |
85.40 |
12.30 |
20.10 |
11.27 |
3.67 |
23.80 |
|
Pirsabak-05 × Tatara-96 |
88.50 |
12.60 |
17.86 |
10.80 |
3.33 |
22.33 |
|
Pirsabak-05 × Punjab-11 |
89.93 |
11.60 |
18.13 |
10.77 |
3.66 |
20.17 |
|
Pirsabak-13 × Atta Habib |
91.06 |
9.40 |
14.20 |
10.60 |
3.86 |
26.83 |
|
Pirsabak-13 × Lalma-13 |
90.93 |
11.60 |
16.56 |
10.80 |
3.67 |
27.50 |
|
Pirsabak-13 × Tatara-96 |
90.63 |
12.20 |
17.80 |
10.27 |
3.40 |
25.53 |
|
Pirsabak-13 × Punjab-11 |
90.80 |
10.40 |
17.86 |
11.29 |
3.67 |
21.07 |
|
Pirsabak-13 × Pirsabak5 |
91.23 |
10.57 |
17.83 |
11.43 |
3.37 |
27.93 |
|
Khatakwal × Atta Habib |
84.90 |
12.50 |
17.63 |
10.43 |
3.33 |
18.00 |
|
Khatakwal × Lalma-13 |
93.96 |
11.90 |
17.70 |
10.37 |
3.67 |
27.33 |
|
Khatakwal × Tatara-96 |
87.93 |
12.60 |
17.93 |
11.93 |
3.33 |
28.37 |
|
Khatakwal × Punjab-11 |
89.33 |
10.40 |
16.96 |
10.57 |
3.03 |
20.70 |
|
Khatakwal × Pirsabak-05 |
92.53 |
10.10 |
16.50 |
9.00 |
3.73 |
20.00 |
|
Khatakwal × Pirsabak-13 |
91.53 |
12.70 |
18.26 |
10.00 |
3.83 |
19.33 |
|
Janbaz × Atta Habib |
90.90 |
11.00 |
17.03 |
11.80 |
3.67 |
22.00 |
|
Janbaz × Lalma-13 |
93.26 |
11.00 |
17.86 |
10.17 |
3.47 |
23.33 |
|
Janbaz × Tatara-96 |
89.33 |
12.00 |
18.86 |
11.13 |
3.67 |
25.33 |
|
Janbaz × Punjab-11 |
89.83 |
12.10 |
19.33 |
10.43 |
3.63 |
19.03 |
|
Janbaz × Pirsabak-05 |
92.43 |
12.90 |
16.60 |
10.40 |
3.70 |
21.97 |
|
Janbaz × Pirsabak-13 |
78.93 |
11.00 |
16.56 |
12.83 |
4.10 |
20.16 |
|
Janbaz × Khatakwal |
84.40 |
10.50 |
17.26 |
11.33 |
3.00 |
18.33 |
|
Range |
78.93 – 93.96 |
9.40 - 12.90 |
14.20 – 19.33 |
9.00 – 12.83 |
2.67 – 4.33 |
18.00 – 28.37 |
|
LSD (5%) |
3.72 |
1.57 |
2.51 |
1.06 |
0.95 |
2.6 |
genotypic variation among wheat lines for plant height. The average of lines for plant height ranged from (82.83 -95.10 cm). Minimum and maximum values of plant height was noted for parent Janbaz (82.83 cm) and Atta Habib (95.10 cm), correspondingly (Table 3). Average values of F2 progenies for plant height ranged from 78.93 to 93.96 (Table 3). Maximum value for plant height (78.93) was recorded for population, Janbaz × Pirsabak-13, while maximum (93.96) was recorded for population, Khatakwal× Lalma-13 (Table 3).
Table 4: Broad sense heritability>and<genetic-advance (GA) for various traits in wheat.
|
Lines |
Tillers plant-1 |
Plant height |
||||
|
Var. |
h2 |
GA (%) |
Var. |
h2 |
GA (%) |
|
|
Parents |
||||||
|
Atta Habib |
1.47 |
0.07 |
||||
|
Lalma-13 |
0.63 |
2.17 |
||||
|
Tatara-96 |
1.99 |
3.22 |
||||
|
Punjab-11 |
0.42 |
3.12 |
||||
|
Pirsabak-05 |
1.33 |
4.17 |
||||
|
Pirabaq-13 |
1.11 |
4.00 |
||||
|
Khatakwal |
0.64 |
11.59 |
||||
|
Janbaz |
0.65 |
5.76 |
||||
|
F2 Population |
||||||
|
Lalma-13 × Atta Habib |
1.21 |
0.17 |
0.32 |
0.50 |
0.23 |
0.28 |
|
Tatara-96 × Atta Habib |
2.26 |
0.24 |
0.65 |
2.01 |
0.76 |
1.91 |
|
Tatara-96 × Lalma-13 |
1.32 |
0.11 |
0.23 |
6.07 |
0.56 |
2.45 |
|
Punjab-11 × Atta Habib |
1.00 |
0.21 |
0.37 |
1.33 |
0.65 |
1.32 |
|
Punjab-11 × Lalma-13 |
1.72 |
0.69 |
1.58 |
3.20 |
0.19 |
0.59 |
|
Punjab-11 × Tatara-96 |
1.51 |
0.39 |
0.85 |
4.26 |
0.26 |
0.93 |
|
Pirsabak-05 × Atta Habib |
1.8 |
0.22 |
0.53 |
4.96 |
0.89 |
3.49 |
|
Pirsabak-05 × Lalma-13 |
2.17 |
0.56 |
1.44 |
6.79 |
0.56 |
2.55 |
|
Pirsabak-05 × Tatara-96 |
1.96 |
0.17 |
0.42 |
4.69 |
0.22 |
0.83 |
|
Pirsabak-05 × Punjab-11 |
0.84 |
0.11 |
0.17 |
4.64 |
0.22 |
0.84 |
|
Pirsabak-13 × Atta Habib |
1.83 |
0.37 |
0.88 |
3.12 |
0.09 |
0.28 |
|
Pirsabak-13 × Lalma-13 |
1.00 |
0.12 |
0.22 |
3.57 |
0.18 |
0.58 |
|
Pirsabak-13 × Tatara-96 |
1.93 |
0.23 |
0.56 |
4.56 |
0.21 |
0.80 |
|
Pirsabak-13 × Punjab-11 |
1.09 |
0.37 |
0.68 |
4.57 |
0.23 |
0.85 |
|
Pirsabak-13 × Pirsabak5 |
1.54 |
0.21 |
0.46 |
5.20 |
0.21 |
0.86 |
|
Khatakwal × Atta Habib |
1.96 |
0.51 |
1.24 |
1.00 |
0.10 |
0.17 |
|
Khatakwal × Lalma-13 |
0.73 |
0.09 |
0.13 |
7.90 |
0.37 |
1.81 |
|
Khatakwal × Tatara-96 |
1.81 |
0.38 |
0.89 |
7.41 |
0.18 |
0.84 |
|
Khatakwal × Punjab-11 |
0.91 |
0.25 |
0.41 |
4.44 |
0.20 |
0.76 |
|
Khatakwal × Pirsabak-05 |
1.33 |
0.31 |
0.62 |
9.82 |
0.29 |
1.61 |
|
Khatakwal × Pirsabak-13 |
1.69 |
0.50 |
1.15 |
9.17 |
0.26 |
1.37 |
|
Janbaz × Atta Habib |
1.48 |
0.34 |
0.72 |
1.00 |
0.36 |
0.64 |
|
Janbaz × Lalma-13 |
1.17 |
0.54 |
1.16 |
4.65 |
0.24 |
0.91 |
|
Janbaz × Tatara-96 |
1.72 |
0.34 |
0.78 |
7.06 |
0.39 |
1.82 |
|
Janbaz × Punjab-11 |
1.33 |
0.30 |
0.16 |
9.32 |
0.47 |
2.55 |
|
Janbaz × Pirsabak-05 |
1.57 |
0.41 |
0.89 |
6.77 |
0.27 |
0.53 |
|
Janbaz × Pirsabak-13 |
1.71 |
0.50 |
1.16 |
10.58 |
0.55 |
3.13 |
|
Janbaz × Khatakwal |
1.29 |
0.50 |
1.00 |
17.01 |
0.52 |
3.77 |
**Var. = Variation; h2 = Broad sense heritability and GA (%) = Genetic advance as percent of average
High heritability and expected (genetic advance ranged from 0.89%) to 0.09%, and 3.77% to 0.28% correspondingly, high heritability (0.89%) was recorded (for)Pirsabak-05 × Lalma-13 while low heritability (0.09%) was recorded for Pirsabak-13 × Atta-Habib. (Table 4). Maximum genetic advance (3.77%) was recorded for Janbaz× Khatkwal while minimum (0.28%) was recorded for Pirsabak-13× Atta-Habib. Kisana et al. (1982) reported (high heritability) for plant height in wheat population. Deshmukh et al. (2006) found high heritability and expected genetic advance for plant height. Sial ett al. (2013) also noted high heritability of various lines for (plant height.)
Plant height showed substantial positive correlation with tillers plant-1 (0.86**), spikelet’s spike-1 (0.69**), spike length (0.62**), 100-grain weight (0.96**) and economic yield per plant (0.66**) (Table 7). Similarly, Ahmad et al. (2013) reported substantial positive varied from of plant height with grain (yield) in wheat lines. Kaleem et al. (2013) also found positive correlation between plant height and (harvest) index. Ali et al. (2008) noticed positive substantial varied from of plant height) with seed weight.
Number of tiller plant-1
Analysis of variance showed (substantial variation (P ≤ 0.05)) of lines, and F2 progenies, while parents and parents versus F2 progenies showed non-substantial variation for number of tiller plant-1. Substantial variation of wheat lines for tiller plant-1 were also noted by Tahmasebi et al. (2013) and Ali et al. (2012). The coefficient of variation was recorded 15.71 %. The averages of lines for parents ranged from (10.36 to 12.30 cm). Minimum and maximum values of tillers plant-1 was noted for parent Punjab-11 (10.36 cm) and Atta Habib (12.30 cm), correspondingly (Table 3). F2 progenies averages values for tiller plant-1 ranged from 9.40 to 12.90 (Table 3). Maximum value for tiller plant-1 (12.90) was recorded for population Janbaz × Pirsabak-05, while minimum (9.40) was recorded for population Pirsabak-13 × Atta Habib (Table 3).
Heritability and genetic advance estimation ranged from 0.12 to 0.69 and 0.13 to 1.44 correspondingly. High heritability (0.69) was recorded for population Punjab-11 × Lalma-13 while minimum (0.12) was recorded for Pirsabak-13× Lalma-13. Similarly genetic advance of 1.44% was recorded for Pirsabak05×Lalma-13 while 0.13% was recorded for population Khatakwal × Lalama-13 (Table 4). Bhushan et al. (2013) reported high heritability and moderate genetic advance for (number) of tiller plant-1 in 30 lines of bread wheat. Waqas et al. (2014) recorded minimum to maximum heritability for fertile tillers. Hussain et al. (2012) also reported high heritability of wheat lines for tillers per plant-1.
Number of tiller per plant- showed positively substantial an with plant height (0.86**), spikelet’s spike-1(0.78**), spike length (0.58**), 100-grain weight (0.89**) and economic yield per plant (0.52**) (Table 7), Kashif and Khaliq (2004) observed substantial varied from of fertile tillers per plant- with (grain) yield development. Singh et al. (2016) observed positively substantial varied from of (tillers) plant-1grain yield andd100-grain weight. Din et al. (2018) recorded positive correlation of tiller m-1 with grain yield and biological yield. Khan (2013) found substantial correlation among most of the traits with numbers of tiller plant-1.
Spikelet’s spike-1
Analysis of (variance)exhibited highly substantial variation (P ≤ 0.01)) for F2 population while, non-substantial variation were noted for lines, parents, and parents versus F2 progenies for spikelet’s spike-1. Gashaw et al. (2010) and Subhashchandra et al. (2009) also found substantial variances of wheat lines for spikelet’s spike-1-. However, Khan et al. (2008) found non-substantial variation for spikelet’s spike-1 in some wheat lines. The coefficient of variation was 11.31% for spikelet’s spike-1. The averages of lines for spikelet’s spike-1 ranged from (16.06 to 17.73). Minimum and maximum values of spikelet’s spike-1 was noted for parent Pirsabak-05 (16.06) and Lalma-13 (17.73), correspondingly (Table 3). The average values for F2 progenies ranged from 14.20 to 20.10 (Table 3). Maximum number of spikeletsspike-1 (20.10) were recorded for progenies Pirsabak-05 × Lalma-13, while minimum (14.20) for Pirsabak-13 ×Atta Habib (Table 3).
Heritability and genetic advance estimation ranged from 0.12 to 0.99 and 0.28 to 6.41 correspondingly. High heritability (0.99) was recorded for population Khatakwal × Atta Habib, while minimum (0.12) was recorded for Janbaz× Punjab-11. Similarly genetic advance of 6.41% was recorded for Pirsabak-13×Atta Habib while 0.28% was recorded for population Tatara-96 × Atta Habib (Table 4). (Table 5). Dutamo et al. (2016) exhibited high heritability estimates for spikelet spike-1 in wheat. Subhashchandra et al. (2009) and Waleed et al. (2008) also observed high (heritability) for spikelet’s spike-1.
Table 5: Broad sense heritability>and<genetic-advance (GA) for various traits in wheat.
|
Lines |
Spike length |
Spikelets spike-1 |
||||
|
Var. |
h2 |
GA (%) |
Var. |
h2 |
GA (%) |
|
|
Parents |
||||||
|
Atta Habib |
0.33 |
0.01 |
||||
|
Lalma-13 |
0.08 |
0.16 |
||||
|
Tatara-96 |
0.01 |
0.52 |
||||
|
Punjab-11 |
0.39 |
0.70 |
||||
|
Pirsabak-05 |
0.19 |
1.21 |
||||
|
Pirabaq-13 |
0.93 |
0.42 |
||||
|
Khatakwal |
0.08 |
0.82 |
||||
|
Janbaz |
0.02 |
4.08 |
||||
|
F2 POPULATION |
||||||
|
Lalma-13 × Atta Habib |
1.03 |
0.84 |
1.50 |
2.06 |
0.98 |
2.48 |
|
Tatara-96 × Atta Habib |
0.09 |
0.36 |
0.19 |
0.13 |
0.45 |
0.28 |
|
Tatara-96 × Lalma-13 |
0.72 |
0.96 |
1.44 |
0.86 |
0.66 |
1.08 |
|
Punjab-11 × Atta Habib |
0.44 |
0.19 |
0.22 |
1.92 |
0.96 |
2.33 |
|
Punjab-11 × Lalma-13 |
0.66 |
0.73 |
1.04 |
0.44 |
0.24 |
0.28 |
|
Punjab-11 × Tatara-96 |
0.86 |
0.93 |
1.52 |
5.89 |
0.90 |
3.83 |
|
Pirsabak-05 × Atta Habib |
1.00 |
0.75 |
1.32 |
2.84 |
0.96 |
2.85 |
|
Pirsabak-05 × Lalma-13 |
0.41 |
0.70 |
0.79 |
7.09 |
0.94 |
4.39 |
|
Pirsabak-05 × Tatara-96 |
0.97 |
0.96 |
1.66 |
3.74 |
0.79 |
2.68 |
|
Pirsabak-05 × Punjab-11 |
0.47 |
0.41 |
0.49 |
3.24 |
0.72 |
2.27 |
|
Pirsabak-13 × Atta Habib |
1.08 |
0.52 |
0.95 |
15.73 |
0.92 |
6.41 |
|
Pirsabak-13 × Lalma-13 |
0.49 |
0.82 |
1.01 |
0.52 |
0.50 |
0.63 |
|
Pirsabak-13 × Tatara-96 |
0.10 |
0.69 |
0.39 |
4.09 |
0.89 |
3.15 |
|
Pirsabak-13 × Punjab-11 |
0.26 |
0.26 |
0.23 |
4.17 |
0.87 |
3.13 |
|
Pirsabak-13 × Pirsabak5 |
1.42 |
0.91 |
1.90 |
5.58 |
0.87 |
3.62 |
|
Khatakwal × Atta Habib |
0.44 |
0.62 |
0.73 |
6.62 |
0.99 |
4.47 |
|
Khatakwal × Lalma-13 |
0.16 |
0.49 |
0.35 |
0.73 |
0.50 |
0.75 |
|
Khatakwal × Tatara-96 |
0.93 |
0.69 |
0.37 |
1.96 |
0.67 |
1.64 |
|
Khatakwal × Punjab-11 |
0.54 |
0.65 |
0.84 |
0.76 |
0.29 |
0.44 |
|
Khatakwal × Pirsabak-05 |
1.24 |
0.90 |
1.76 |
1.48 |
0.32 |
0.70 |
|
Khatakwal × Pirsabak-13 |
1.33 |
0.93 |
1.90 |
3.66 |
0.84 |
2.83 |
|
Janbaz × Atta Habib |
0.52 |
0.83 |
1.05 |
0.30 |
0.33 |
0.32 |
|
Janbaz × Lalma-13 |
0.16 |
0.73 |
0.52 |
3.90 |
0.79 |
2.75 |
|
Janbaz × Tatara-96 |
0.92 |
0.93 |
1.66 |
6.16 |
0.76 |
0.34 |
|
Janbaz × Punjab-11 |
0.25 |
0.74 |
0.65 |
2.52 |
0.12 |
0.33 |
|
Janbaz × Pirsabak-05 |
0.39 |
0.83 |
0.91 |
2.92 |
0.24 |
0.71 |
|
Janbaz × Pirsabak-13 |
0.25 |
0.82 |
0.72 |
1.77 |
0.26 |
0.61 |
|
Janbaz × Khatakwal |
0.33 |
0.87 |
0.88 |
2.76 |
0.34 |
0.98 |
**Var. = Variation; h2 = Broad sense heritability and GA(%) = Genetic advance as percent of average
Spikelet’s spike-1 showed positively substantial varied from with plant height (0.69**), tillers plant-1 (0.78**), spike length (0.56**), 100-gain weight (0.70**) and economic yield per plant (0.43**). (Table 7). Mohibullah et al. (2011) reported positive correlation of number of spikelet spike-1 with grain yield while working with 100-bread wheat lines. Kaleem et al. (2013) reported highly substantial varied from for grain per spike with number of tiller plant-1, grain yield and (1000-grain weight.)
Spike length
Data analysis showed substantial (P ≤ 0.05) variation for (lines,) F2 and parents vs. F2 progenies for spikes (length), while parents exhibited non-substantial variation. Husain et al. (2012) found substantial variation of lines, for spike length, while Khalid et al. (2011) also found lines with no-substantial variation for spike length. These variation in result could be due to different lines they used for experiments. The coefficient of variation was recorded 6.16%. The averages of parental lines ranged from 9.33 to 10.87 cm. Minimum and maximum values of spike length was noted for parent Atta Habib (9.33 cm) and Janbaz (10.87 cm), correspondingly (Table 3). The average values of F2 progenies for spike length are from 9.0-12.83 cm (Table 4). Maximums value for spike length (12.83cm) was recorded for population, Janbaz × Pirsabak-13, while minimum value (9.0 cm) was recorded for population, Khatakwal × Pirsabak-05 (Table 3).
Heritability and genetic advance estimation ranged from 0.19 to 0.96 and 0.19 to 1.90 correspondingly. High heritability (0.96)) was recorded for population Tatara-96 × Lalma-13 while minimum (0.19) was recorded for Pinjab-11× Atta Habib. Similarly, genetic advance of 1.90% was recorded for Khatakwal×Pirsabak-13 while 0.19% was recorded for population Tatara-96 × Atta Habib (Table 5). Yousaf et al. (2008) observed heritability, and genetic advance in high range for spike length. Shah et al. (2018), Kumar et al. (2017) and Subhashchandra et al. (2009) observed high heritability, and high genetic, advance for spike length. Gashaw et al. (2010) also found high>heritability of wheat lines for spike > length. Spike length > had positively substantial varied from with plant height (0.62**), tillers plant-1 (0.58**), spikelet’s spike-1 (0.56**), 100-gain weight (0.67**) and economic yield per plant (0.62**) (Table 7). Mohibullah et al. (2011) reported positively substantial varied from of spike length with number<of spikelet per > spike, grain > yield per plant and 1000-grain<weight. Shah et al. (2018) found positive high substantial correlation of spike length with grain < weight < spike-1 and 100-grain > weight. Subhashchandra et al. (2009) observed highest positive varied from off spike length with grain yield >plant-1 and tillers plant-1.
100-grain weight
Data exhibited substantial (P ≤ 0.01) variation among lines and parents vs. F2 population contrast, while non-substantial variation were noticed for parents and their F2 progenies for 100-grain weight. Bhutto et al. (2016) also found substantial variation of wheat lines for 100 grain weight. Singh et al. (2016) found non-substantial variances for 100-grain weight of wheat lines. The different results may be due to the use of different lines in their experiments. The coefficient of variation recorded was 17.57% for 100-grain weight. The averages of lines for 100-grain weight ranged from 2.63 to 3.27 g. Minimum and maximum values of 100-grain weight was noticed for parent Tatara-96 (2.63 g) and Khatakwal (3.27 g), correspondingly, (Table 3). The average values of F2 progenies for 100-grain weight ranged from 2.7 to 4.33 g. Maximum values for 100 grain weight (4.33 g) was recorded for population Pirsabak 13 × Janbaz, while minimum (2.7 g) was recorded for genotype Lalma-13 (Table 3).
Heritability and genetic advance estimation ranged from 0.11 to 0.89 and 0.18 to 2.27 correspondingly. High heritability (0.89) were recorded for population Khatakwal × Pirsabak-13 while minimum (0.11) was recorded for Pirsabak-13× Atta Habib. Similarly, genetic advance of 2.27% was recorded for Tatara-96×Lalma-13 while 0.18% was recorded for population Pirsabak-05 × Atta Habib. Gite et al. (2018) and Dutamo et al. (2015) also found > high < heritability. Hundred grain weight showed positive substantial varied from with plant height (0.96**), tillers plant-1 (0.89**), spikelet’s spike-1 (0.70**), spike length (0.67**) and economic yield per plant (0.58**) (Table 7). Mohibullah et al. (2011) also exhibited highly > substantial > positive varied from of 1000grain weight with grain yield in 30 wheat lines. Gashaw et al. (2010) found positive varied from among 100grain weight and most of the yield characters.
Table 6: Broad sense heritability>and<genetic-advance (GA) for various traits in wheat.
|
Lines |
Economic yield per plant (g) |
100- grain weight (g) |
||||
|
Var. |
h2 |
GA (%) |
Var. |
h2 |
GA (%) |
|
|
Parents |
||||||
|
Atta Habib |
0.40 |
0.52 |
||||
|
Lalma-13 |
0.27 |
0.33 |
||||
|
Tatara-96 |
2.33 |
0.30 |
||||
|
Punjab-11 |
0.03 |
0.50 |
||||
|
Pirsabak-05 |
0.08 |
0.14 |
||||
|
Pirabaq-13 |
0.37 |
0.01 |
||||
|
Khatakwal |
0.27 |
0.30 |
||||
|
Janbaz |
2.61 |
0.01 |
||||
|
F2 POPULATION |
||||||
|
Lalma-13 × Atta Habib |
1.71 |
0.81 |
1.86 |
1.01 |
0.59 |
1.04 |
|
Tatara-96 × Atta Habib |
4.27 |
0.77 |
2.81 |
1.37 |
0.71 |
1.47 |
|
Tatara-96 × Lalma-13 |
12.63 |
0.94 |
5.86 |
2.25 |
0.86 |
2.27 |
|
Punjab-11 × Atta Habib |
5.32 |
0.99 |
4.03 |
0.92 |
0.45 |
0.75 |
|
Punjab-11 × Lalma-13 |
0.25 |
0.88 |
0.78 |
0.54 |
0.25 |
0.32 |
|
Punjab-11 × Tatara-96 |
0.25 |
0.65 |
0.57 |
0.67 |
0.42 |
0.60 |
|
Pirsabak-05 × Atta Habib |
1.33 |
0.86 |
1.75 |
0.33 |
0.18 |
0.18 |
|
Pirsabak-05 × Lalma-13 |
0.49 |
0.69 |
0.85 |
0.33 |
0.34 |
0.35 |
|
Pirsabak-05 × Tatara-96 |
1.33 |
0.67 |
1.36 |
0.33 |
0.37 |
0.38 |
|
Pirsabak-05 × Punjab-11 |
2.82 |
0.99 |
2.94 |
0.33 |
0.19 |
0.20 |
|
Pirsabak-13 × Atta Habib |
10.49 |
0.22 |
1.25 |
1.62 |
0.11 |
0.25 |
|
Pirsabak-13 × Lalma-13 |
2.11 |
0.85 |
2.17 |
0.33 |
0.80 |
0.81 |
|
Pirsabak-13 × Tatara-96 |
5.00 |
0.81 |
3.21 |
0.48 |
0.87 |
1.06 |
|
Pirsabak-13 × Punjab-11 |
1.21 |
0.97 |
1.88 |
0.33 |
0.75 |
0.77 |
|
Pirsabak-13 × Pirsabak5 |
0.81 |
0.78 |
1.24 |
0.30 |
0.86 |
0.83 |
|
Khatakwal × Atta Habib |
1.00 |
0.67 |
1.18 |
0.52 |
0.24 |
0.30 |
|
Khatakwal × Lalma-13 |
0.33 |
0.19 |
0.19 |
1.33 |
0.76 |
1.55 |
|
Khatakwal × Tatara-96 |
1.40 |
0.43 |
0.91 |
0.44 |
0.32 |
0.37 |
|
Khatakwal × Punjab-11 |
0.27 |
0.87 |
0.80 |
0.72 |
0.89 |
1.33 |
|
Khatakwal × Pirsabak-05 |
7.00 |
0.98 |
4.56 |
0.41 |
0.50 |
0.56 |
|
Khatakwal × Pirsabak-13 |
10.33 |
0.97 |
5.48 |
0.58 |
0.89 |
1.20 |
|
Janbaz × Atta Habib |
7.00 |
0.85 |
3.97 |
0.33 |
0.75 |
0.76 |
|
Janbaz × Lalma-13 |
1.33 |
0.37 |
0.75 |
0.20 |
0.67 |
0.53 |
|
Janbaz × Tatara-96 |
6.33 |
0.61 |
2.70 |
0.33 |
0.81 |
0.82 |
|
Janbaz × Punjab-11 |
1.32 |
0.65 |
1.31 |
0.30 |
0.86 |
0.83 |
|
Janbaz × Pirsabak-05 |
2.17 |
0.79 |
2.04 |
0.27 |
0.84 |
0.77 |
|
Janbaz × Pirsabak-13 |
1.14 |
0.14 |
0.26 |
0.07 |
0.81 |
0.38 |
|
Janbaz × Khatakwal |
1.08 |
0.22 |
0.41 |
0.13 |
0.51 |
0.32 |
**Var. = Variation; h2 = Broad sense heritability and GA(%) = Genetic advance as percent of average
Table 7: Pearson correlation-coefficient between different parameters of wheat.
|
Plant height |
Tiller Plant-1 |
Spikelets- spike-1 |
Spike length |
100- grain weight |
Economic yield |
|
|
Plant height |
- |
0.86** |
0.69** |
0.62** |
0.96** |
0.66** |
|
Tiller Plant-1 |
- |
0.78** |
0.58** |
0.89** |
0.52** |
|
|
Spikelets-spike-1 |
- |
0.56** |
0.70** |
0.43** |
||
|
Spike length |
- |
0.67** |
0.62** |
|||
|
100-grain weight |
- |
0.58** |
Economic yield per plant (g)
Average squares for economic yield per plant exhibited highly substantial (P ≤ 0.01) variation of lines, <F2> population and parents vs. F2 progenies, whereas, nonsubstantial variation were noted for parents. Rajper et al. (2018) observed substantial variation for economic yield per plant of 8 wheat lines. Salman et al. (2014) also noted substantial variances of 65 wheat > lines > for economic yield per plant, whereas, Khan et al. (2008) found non-substantial variation among wheat lines for grain yield. The coefficient of variation was 7.37% for economic yield per plant.
The averages of lines for parents ranged from 19.17 to 20.93 g (Table 3). Maximum average economic yield per plant (20.93g) was recorded for Janbaz, while minimum (19.19 g) was recorded for genotype Pirsabak-05 (Table 4). The averages of F2 progenies ranged from 18.00 to 28.36g (Table 3). Maximum average economic yield per plant (28.36g) was recorded for Khatakwal × Tatara-96, while minimum (18.00 g) was recorded for genotype Khatakwal × Atta Habib (Table 4).
Heritability and genetic advance estimation ranged from 0.14 to 0.99 and 0.26 to 5.86 correspondingly. High heritability (0.99) was recorded for population Pirsabak-05 × Punjab-11, while minimum (0.14) was recorded for Janbaz× Pirsabak-13. Similarly, genetic advance of 5.86% was recorded for Tatara-96×Lalma-13 while 0.26% was recorded for population Janbaz × Pirsabak-13. (Table 6). Dutamo et al. (2016) also exhibited high heritability and genetic advance for grain yield in wheat lines. Deshmukh et al. (2006) found moderate to<high>heritability estimations with genetic advance for grain yield in wheat crosses. Sobia et al. (2014) also estimated > high > heritability for economic yield per plant.
Economic yield per plant exhibited positively substantial varied from<with plant height (0.66**), tillers plant-1 (0.52**), spikelet’s spike-1 (0.43**), spike length (0.62**) and 100-grain weight (0.58**) < (Table 7). Waleed et al. (2008) reported positive and substantial correlation of all characters with<grain<yield. Hassan (2017) reported that grain yield has positive substantial varied from with grain spike-1. Rajper et al. (2018) also noted positively substantial varied from of grain yield with biological yield, harvest index and grain weight.
Conclusions and Recommendations
Means sum of squares exhibited substantial variation for lines, parents, F2 progenies, and parents vs. F2 progenies for all the characters representing existence of appropriate variability for improvement. High heritability was noticed in cross combinations, Panjab11 × Lalma-13 for Tillers plant-1, Khatakwal × Pirsabak-13 for 100-grain weight and Pirsabak-05 ×Punjab-11 for economic yield per plant . Whereas genetic advance was recorded maximum for cross combination, Tatara-96 × Lalma-13 for 100-gain weight and economic yield per plant. Grain<yield plant-1 was positively substantial associated with plant height, tillers plant-1, spikelet’s spike-1, spike length and 100grain weight, therefore these characters can be<used as indirect selection criteria for<yield improvement in wheat. F2 progenies, Pirsabak-05 × Lalma-13, Khatakwal × Pirsabak-13, Janbaz × Pirsabak-05, and Pirsabak-13 × Janbaz and Khatakwal× Tatara-96 showed best performance for most of the characters and therefore their potential could be exploited in future>breeding>programs.
Novelty Statement
The F2 progenies (Pirsabak-05×Lalma-13, Khatakwal × Pirsabak-13, Atta Habib × Pirsabak-05 and Tatara-96 × Punjab-11) were found promising for most of the traits and thus could be beneficial for exploitation in future wheat breeding program.
Author’s Contribution
Abdul Haleem: Conceived the idea of the experi-ment and conduct the research.
Ghulam Hassan: Major supervisor, technical input and support at every step.
Arshad Iqbal: Helped in manuscript modification and technical improvement.
Fahim Ullah Khan: Helped in statistical analysis
Muhammad Sajid: Technical writing
Farhad Ahmad: Data recording
Rafi Ullah Khan: Helped in review of literature
Mohammad Ilyas: Data recording and references writing
Conflict of interest
The authors have declared no conflict of interest.
References
Ahmad, H.M., S.I. Awan, O. Aziz and M.A. Ali. 2013. Multivariate analysis of some metric traits in bread wheat. Eur. J. Biotechnol. Biol. Sci., 1(4): 22-26.
Ajmal. S.U., M.I. Haq and N. Mobeen. 1995. Study of heritability and genetic advance in wheat crosses. J. Agric. Res., 33: 235-239.
Akbar, M., N. Khan and M. Chowdhry. 1995. Variation and intervaried froms between some biometric characters in wheat. J. Agric. Res., 33: 24-54.
Ali, H. and E.F. Shakor. 2012. Heritability, variability, genetic correlation and path analysis for quantitative traits in durum and bread wheat under dry farming conditions. Mesoptamia. J. Agric. 40 (4): 27-39. https://doi.org/10.33899/magrj.2012.59640
Ali, Y., B.M. Atta, J. Akhtar, P. Monneveux and Z. Lateef. 2008. Genetic variability, varied from and diversity studies in wheat germplasm. Pak. J. Bot., 40(50: 2087-2097.
Asif, M., M. Rehman and M. Zafer. 2005. DNA fingerprinting studies of some wheat (Triticum aestivum) lines using random amplified polymorphic DNA (RAPD) analysis. Pak. J. Bot., 37: 271-277.
Bhushan, B., S.S. Gaurav, R.P. Kumar, M. Pandy, A. Kumar, S. Bharti, S.S. Nagar and V.P. Rahu. 2013. Genetic variability, heritability and genetic advance in bread wheat. Environ. Ecol., 31(2): 405-407.
Bhutto, A.H., A.A. Rajpar, S.A. Kalhoro, A. Ali, F.A. Kalhoro, M. Ahmed and N.A. Kalhoro. 2016. correlation and regression analysis for yield traits in wheat (Triticum aestivum) lines. J. Sci., 8(32): 96-104. https://doi.org/10.4236/ns.2016.83013
Deshmukh, S.N., M.S. Basu and P.S Reddy. 2006. Genetic variability characters varied from and path coefficient analysis of quantitative traits on Virginia bunch varieties of groundnut. Indian J. Agric. Sci., 56(1): 816-821.
Din, I., F. Munsif, I.A. Shah, H. Khan, F.U. Khan, Ibrarullah, S. Uddin and T. Islam. 2018. Genetic variability and heritability for yield and yield associated traits of wheat lines in Nowshera valley. Pak. J. Agric. Res., 31(3): 216-22. https://doi.org/10.17582/journal.pjar/2018/31.3.216.222
Dutamo D., S. Alamerew, F. Eticha, E. Assefa. 2015. Genetic variability in bread wheat (Triticum aestivum) germplasm for yield and yield component traits. J. Agric. Healthcare, 5(17): 144-147
Dutamo, D., F. Alamerew and S. Assefa. 2016. Trait varied from in some durum wheat accession among yield and yield related traits at Kulumsa, South Eastern Etiopia. Adv. Crop Sci. Technol., 4(1): 2329-2333. https://doi.org/10.4172/2329-8863.1000234
Gashaw, A., M. Hussein and S. Harjit. 2010. Genotypic variability, heritability, gene advance and varied froms among characters in Ethiopian durum wheat (Triticum durum) accessions. East. Afric. J. Sci., 4(1): 27-33. https://doi.org/10.4314/eajsci.v4i1.71521
Gite, V.D., D.N. Bankar, K.K.J. Yashavantha, V.S. Baviskar, B.K. Honrao, A.M. Chavan, V.D. Surve, S.S. Raskar, S.S. Khairnar, J.H. Bagwan and V.M. Khade. 2018. Genetic variability parameters and correlation study in elite lines of bread wheat (Triticum aestivum L.). J. Pharmacogn. Phytochem., 7:3118-3123.
Hussain, M., A.S. Khan, I. Khaliq and M. Maqsood. 2012. Correlation studies of some qualitative and quantitative traits with grain yield in spring wheat across two environments. Pak J. Agric. Sci., 49(1): 1-4.
Kaleem, M.S., F. Hussain, M. Rafiq, Z. Iqbal, J. Iqbal and M.A. Chowdhry. 2013. Estimates of heritability and genetic advance for grain yield and its component in different segregating population of wheat. J. Agric. Res., 51(4): 349-360.
Kashif, M. and I. Khaliq. 2004. Heritability, correlation and path coefficient analysis for some Metric traits in wheat. Int. J. Agric. Biol., 6(1): 138 142.
Khalid, M., I.H. Khalil, Farhatullah, A. Bari, M. Tahir, S. Ali, S. Anwar, A. Ali and M. Ismail. 2011. Assessment of heritability estimates for some yield traits in winter wheat. Pak. J. Bot., 43(6): 2733-2736.
Kisana, N.S., A.R. Chowdhry, M. Tahir and M.A. Chodhry. 1982. Heritability of some quantitative characters in five crosses of wheat. Pak. J. Agric. Res., 3(1):211-214.
Khan, A.A., M.A. Alam, M.K. Alam, M.J. Alam and Z.I. Sarker. 2013. Genotypic and phenotypic correlation and path analysis in durum wheat. Bangladesh J Agric. Res. 38(2): 219-225. https://doi.org/10.3329/bjar.v38i2.15885
Khan, S.A. 2013. Genetic variability and heritability estimates in F2 wheat lines. Intl. J. Agric. Crop. Sci., 5(9): 938-986.
Khan, H., H. Rahman, Ahhmed and H. Ali. 2008. Magnitude of heterosis and heritability in sunflower over environments. Pak. J. Bot., 39(1): 301-308.
Khan, W.U., M. Fida, U.K. Fahim, Z. Faiza and G. Gul. 2015. Correlation studies among productions traits in wheat. Am. J. Agric. Sci., 15(10): 2059-2063.
Kumar, A., A. Kumar, V. Rathi and K.P.S. Tomer. 2017. Variability, heritability and genetic advance in bread wheat (Triticum aestivum L.) lines. Int. J. Curr. Microbiol. App. Sci., 6(8): 2687-2691. https://doi.org/10.20546/ijcmas.2017.608.321
Memon S.M., B.A. Ansari and M.Z. Balouch. 2005. Estimation of genetic variation for agro-economic traits in spring wheat (Triticum aestivum L.). Int. J. Plant Sci., 4: 171-175.
Mohamad, N.A. 1999. Some statistical procedures for evaluation of the relative contribution for yield components in wheat. Zigzag J. Agric. Res., 26(2): 281 - 290.
Mohibullah., M., M.A. Rabbani, S.J. Zakiullah, A. Amin and Ghaznafarullah. 2011. Genetic variability and correlation analysis of bread wheat accession. Pak. J. Bot., 43(6): 2717-2720.
Mondal, S.K. and C. Khajuria. 2001. Correlation and path analysis in bread wheat (Triticum aestivum L.). J. Environ. Ecol., 18(2): 405-408.
Nabi, T.G., M.A. Chauddary, K. Aziz and W.M. Bhutta. 1998. Intervaried from among some polygenic traits in hexaploid spring wheat. Pak. J. Biol. Sci., 1:299-302. https://doi.org/10.3923/pjbs.1998.299.302
PBS. 2017. Pakistan Bureau of Statistics, Economic survey of Pakistan, ministry of food, agriculture.
Panse, V.G. and P.V. Sukhatme. 1965. Statistical methods for agricultural workers. Indian Council of Agric. Res. New Delhi: 381.
Rajper, A.R., S.K. Baloch, R. Anjum, A.J. Chandio, K.B.S.H. Kaleri, B.A. Rajput and R.R. Kaleri. 2018. Inheritance studies and varied from of morphological traits in wheat (Triticum aestivum L.). Pure. Appl. Biol., 7(1):201-206. https://doi.org/10.19045/bspab.2018.70024
Salman, S., S.J. Khan. J. Khan., R.U. Khan and I. Khan. 2014. Genetic variability studies in T. aestivum accessions. Pak. J. Agric. Res., 1(27): 1-7.
Shah, A., J. Amin, S. Ali, A. Rab, S. Hayat, Z. Wahab, F. Azam, M. Zakir, F. Ghani, M. R. Khan, G.H. and A. Ali. 2018. Genetic variability, heritability and genetic advancement in F3 population of wheat. Pure Appl. Biol.,19(45):10. https://doi.org/10.19045/bspab.2018.700169
Shah, M.M., P.S. Baenziger, Y. Yen, K.S. Gill, B.M. Silva and K. Halilogu. 1999. Genetic analysis of agronomic traits controlled by wheat chromosome 3A. Crop Sci., 39: 96-102. https://doi.org/10.2135/cropsci1999.0011183X003900040009x
Sial, M.A., J. Akhter, A.A. Mirbahar, K.D. Jamali, N. Ahmed and H. Bux. 2013. Genetic studies of yield contributing traits of F2 segregation of wheat. Pak. J. Bot., 45(5): 1841-1846.
Singh, G. and H. Chaudhary. 2006. Selection parameters and yield enhancement of wheat under different moisture stress condition. Asian. J. Plant. Sci., 5: 894-898. https://doi.org/10.3923/ajps.2006.894.898
Singh, K., M.S. Punia and V. Singh. 2016. Inter-varied from between grain yield and its component characters in F2progenies of bread wheat. Int. J. Sci. Res., 5(4): 749-751.
Sobia, A.M., A. Shahid, I.A. Shehzad, A.K. Muhammad and A.A. Muhammad. 2014. Estimation of genetic variability, heritability and correlation for some morphological traits in spring wheat. J. Biol. Agric. Healthcare, 4(5): 10-16.
Subhashchandra, B., H.C. Lohithaswa, S.A. Desal, R.R. Hanchinal, I.K. Kalappanavar, K.K. Math and P.M. Salimath. 2009. Assessment of genetic variability and varied from between genetic diversity and transgressive segregation in tetraploid wheat. Karnataka J. Agric. Sci., 22(1): 36-38.
Tahmasebi, G., H. Javad and J.A. Aboughadareh. 2013. Evaluation of yield and yield components in some of promising wheat lines. Int. J. Agric. Crop. Sci., 5(20): 2379-2384.
USDA. 2018. World Agricultural Production, United Stated Department of Agriculture, Foreign Agricultural Services.
Waleed, M., T. Muhammad, M. Amin, F. Subhan, M.I. Khan and A.J. Khan. 2008. Identification of traits in wheat lines (Triticumaestivum L.) contributing to grain yield through correlation and path coefficient analysis. Pak. J. Bot., 40: 2393-2402.
Waqas, M., M. Faheem, A.S. Khan, M. Shehzad and M.A.A. Ansari. 2014. Estimates of heritability and genetic advance for some yield traits in eight F2 population of wheat. Sci. Let., 2:43-47
Yousaf, A., B.M. Atta, J. Akhter, P. Monneveux and Z. Lateef. 2008. Genetic variability, varied from and diversity studies in wheat (Triticum aestivumL.) germplasm. Pak. J. Bot., 40(5): 2087-2097.
To share on other social networks, click on any share button. What are these?


