Genetic Analysis for Yield Traits using F3 Populations in Rapeseed (Brassica napus L.)


Research Article
Genetic Analysis for Yield Traits using F3 Populations in Rapeseed (Brassica napus L.)
Fazli Ahad1, Raziuddin1, Nazir Ahmad1,2*, Muhammad Nauman1, Touheed Iqbal3, Nabeel Khan1, Fazli Hameed4 and Quaid Hussain2
1Department of Plant Breeding and Genetics, The University of Agriculture-Peshawar, Khyber Pakhtunkhwa, Pakistan; 2Key Laboratory of Biology and Genetic Improvement of Oil Crops-Ministry of Agriculture, Oil Crops Research Institute (Wuhan), The Graduate School of Chinese Academy of Agricultural Sciences, P.R. China; 3Directorate General Agriculture Research, Khyber Pakhtunkhwa, Peshawar, Pakistan; 4College of Agricultural Engineering, Hohai University-210098, Nanjing, P.R. China.
Abstract | The present study was conducted to estimate heritability, genetic advance, and correlation coefficient in a set of 31 rapeseed genotypes, comprised of 10 parental lines and their 21 F3 populations. These genotypes were evaluated in a randomized complete block design at The University of Agriculture-Peshawar-Khyber Pakhtunkhwa-Pakistan with three repeats. Significant differences were recorded for days to 50% flowering, plant height, primary branches plant-1, main raceme length, pods main raceme-1, pod length, seeds pod-1, 1000-seed weight, seed yield plant-1 among genotypes, parents and F3 population. Similarly, parents vs. F3 population also showed significant differences for all the studied traits except primary branches plant-1 and pods main raceme-1, which revealed non-significant differences. Among parents DH4, DH5 performed better for seed yield plant-1 (15.2 g), seeds pod-1 (23.7), respectively, while DH8 showed better performance for pods main raceme-1 (76.6), pod length (7.7 cm) and 1000-seed weight (7.3 g). Cross combinations CA5 × DH6, CA5 × DH7, CA2 × DH7 and CA5 × DH3 showed potential performance for pods main raceme-1 (80.9), pod length (8.2 cm), seeds pod-1 (25.7), 1000-seed weight (7.8 g) and seed yield plant-1 (18.4 g). All the studied traits showed moderate (>30%) to high (>60%) broad sense heritability coupled with maximum genetic advance in F3 populations, hence indicated that selection could be effective in the early generation for the improvement of these traits. Correlation analysis indicated that flowering (rp=0.45), primary branches plant-1 (rp=0.49), main raceme length (rp=0.41), seeds pod-1 (rp=0.41) and 1000-seed weight (rp=0.38) had positive and significant association with seed yield plant-1. Genotypes, DH4, DH5, DH8, CA5 × DH6, CA5 × DH7, CA5 × DH3, and CA2 × DH7 displayed well genetic potential for the majority of the traits hence could be used in future rapeseed breeding programs.
Received | January 29, 2020; Accepted | March 13, 2020; Published | April 25, 2020
*Correspondence | Nazir Ahmad, Department of Plant Breeding and Genetics, The University of Agriculture-Peshawar, Khyber Pakhtunkhwa, Pakistan; Email: nazir_aup@yahoo.com
Citation | Ahad, F., Raziuddin, N. Ahmad, M. Nauman, T. Iqbal, N. Khan, F. Hameed and Q. Hussain. 2020. Genetic analysis for yield traits using F3 populations in rapeseed (Brassica napus L.). Pakistan Journal of Agricultural Research, 33(2): 253-263.
DOI | http://dx.doi.org/10.17582/journal.pjar/2020/33.2.253.263
Keywords | Brassica napus, Rapeseed, Genetic variability, Heritability, Genetic advance
Introduction
Rapeseed (Brassica napus) is an ancient crop that belongs to family Cruciferae. The name crucifer came from the shape of flowers having four diagonally opposite petals in the form of a cross. Cruciferae (Brassicaceae) family consists of 350 genera and 3500 species in which genus Brassica comprised about 160 species (Zhou et al., 2006). The amphidiploid Brassica napus (2n= 38) were originated naturally from the cross between Brassica rapa (2n=20) and Brassica oleraceae (2n=18) (Nagaharu and Nagaharu, 1935).
Rapeseed oil is mainly used for cooking purposes, but it is also used as a lubricant and illuminant and in the manufacturing of soup. Residual rapeseed cake is used as livestock feed. Brassica contributes about 21% of the total edible oil produced in Pakistan (Abbas et al., 2008). The local production of edible oil meets less than 30% of the country’s need while rest is met through import by spending a considerable amount of foreign exchange. In 2012-13, 2.149 million tons of edible oil worth Rs. 270 billion (US$ 2.7 billion) was imported (FBS, 2012-13). The import bill is increasing by passing each day due to the rapid increase in population and change in lifestyle of the Pakistani population. This situation offers challenges for both government and scientists to improve the present production of oilseed crops by (a) bringing more area under oilseed crops (b) developing superior varieties of rapeseed and (c) adopting new technologies to improve yield.
Achievement of any crop improvement depends upon the presence of genetic variability, heritability, correlation, as well as genetic gain in selection (Khan et al., 2006). A fundamental aspect of plant breeding is to estimate the fraction of the total variance among plants of a population that may be attributed to genetic differences between them. This ratio is called heritability, which is one of the essential components of the breeder’s equation that aims to predict the expected response to selection. In general, the higher the heritability of a trait, the greater the expected genetic gain since artificial selection can be carried out more efficiently (Mazurkievicz et al., 2019). Correlations are important in determining the degree to which different yield contributing characters are associated (Wright, 1921). Plant traits having satisfactory variability, high heritability, and genetic advance would be an effective tool for crop improvement (Aytac and Kinaci, 2009). Keeping in view the importance of Brassica napus, the present study was conducted to (a) evaluate the magnitude of genetic variability in parental and F3 populations of Brassica napus (b) estimate heritability, genetic advance, and correlation for morphological traits in segregating population of Brassica napus and (c) find out best segregants for future breeding programs of Brassica napus.
Materials and Methods
This experiment was conducted at The University of Agriculture, Peshawar, during (2013-14) for studying genetic variability, heritability, genetic advance, and traits association in a set of 31 genotypes (Table 1) of Brassica napus. The breeding material comprised three lines (CA2, CA4, and CA5; collected from Canada) and seven testers (DH2, DH3, DH4, DH5, DH6, DH7 and DH8; collected from China). From 2007-2010, this material was evaluated for its stability at Peshawar conditions. In 2010-11, F1 hybrids were developed and evaluated during 2011-12, whereas F2 populations were raised in 2012-13 at the Department of Plant Breeding and Genetics, The University of Agriculture, Peshawar. Parents and F3 populations were sown on October 14, 2013. All genotypes were planted in a randomized complete block design (RCBD) with three replications. Standard agronomic practices were performed uniformly for all genotypes. Data were recorded on days to 50% flowering, plant height, primary branches plant-1, main raceme length, pods main raceme-1, pod length, seeds pod-1, 1000-seed weight, seed yield plant-1.
Table 1: List of genotypes used in the experiment.
| Parents |
F3 Populations |
|
| CA2 | CA2 × DH2 | CA4 × DH5 |
| CA4 | CA2 × DH3 | CA4 × DH6 |
| CA5 | CA2 × DH4 | CA4 × DH7 |
| DH2 | CA2 × DH5 | CA4 × DH8 |
| DH3 | CA2 × DH6 | CA5 × DH2 |
| DH4 | CA2 × DH7 | CA5 × DH3 |
| DH5 | CA2 × DH8 | CA5 × DH4 |
| DH6 | CA4 × DH2 | CA5 × DH5 |
| DH7 | CA4 × DH3 | CA5 × DH6 |
| DH8 | CA4 × DH4 | CA5 × DH7 |
| CA5 × DH8 | ||
Statistical analysis
Analysis of variance: The data were statistically analyzed according to the appropriate method, as suggested for RCB design (Singh and Chaudhary, 1979). Mean separation was carried out following the LSD (0.05) test.
Heritability (broad sense): Broad sense heritability for a particular trait was computed using variances of parental and F3 populations of each cross combination using the modified version of the formula (Mahmud and Kramer, 1951):
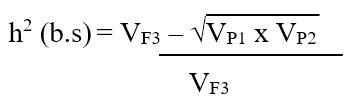
Where;
VF3= variances of F3 population for a specific trait, VP1 and VP2= variances of parent-1 and parent-2. The heritability was categorized as low, moderate, and high, as indicated (Robinson et al., 1951).
0-30%=Low, 31-60%=Moderate, 61% and above= High
Genetic advance: The genetic advance was computed using the following formula of Panse and Sukhatme (1965):
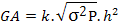
GA= genetic advance, K = 1.76 at 10 % selection intensity, h2 = heritability infraction for a particular cross, √σ2P= Phenotypic standard deviation.
Phenotypic correlation: Phenotypic correlations (rp) between two traits x and y were calculated as suggested by Johnson et al., (1955). The correlation between yield and its components was calculated from the following formula:
rp (x, y) = Covp (x, y) / √ Vp (x). Vp (y)
Where ;
Covp (x, y) is phenotypic covariance between (x) and (y), Vp (x) is the phenotypic variance of characters (x), and Vp (y) is the phenotypic variance of characters (y).
Results and Discussion
Days to 50% flowering
Early flowering in Brassica results in early maturity; hence earliest flowering is preferred in rapeseed while breeding for early maturity. In the present study, days to 50% flowering showed highly significant differences among genotypes, parents, F3 populations, and parents vs. F3 populations (Table 2). Among parental lines, days to 50 % flowering ranged from 106 (CA5 and DH2) to 113 days (CA2) while cross combinations showed a range of 109 (CA4 × DH7) to 113 days (CA2 × DH8, CA4 × DH4, CA4 × DH5 and CA5 x DH2) (Figure 1). Our results show the existence of significant variation among the tested breeding material. Earlier researchers (Muhammad et al., 2014a; Nasim et al., 2013; Nazeer et al., 2003; Aytac and Kinaci, 2009; Azam et al., 2013) also found significant differences among genotypes for 50% flowering in rapeseed. Variances among parental cultivars ranged from 1.1 (DH2, DH7) to 4.7 (DH3). Among F3 populations, minimum variation (3.9) was observed for CA5 × DH6, while maximum (15.5) was observed for CA5 × DH2 (Table 3). Moderate (0.44) to high (0.80) road sense heritability was recorded (Table 3) High broad-sense heritability was observed for CA5 × DH2 (0.80) followed by CA2 × DH8 (0.78), indicating the predominant role of additive gene action and less environmental influence. CA5 × DH6 revealed low value for broad-sense heritability (0.44). Majority of crosses have high heritability while the rest of the crosses have moderate heritability. The genetic advance was maximum (5.6) for CA5 × DH2 while minimum (1.5) for CA5 x DH6 (Table 3). Present findings are in agreement with the results of previous researchers (Mahto and Haider, 2002; Chaghakaboodi et al., 2012), who also reported high heritability associated with a high genetic advance in Brassica napus genotypes for days to flowering. Days to 50% flowering showed positive and significant correlation with 1000-seed weight (rp=0.40), seed yield plant-1 (rp=0.45) (Table 6). Significant correlation for days to flowering with 1000-sed weight and seed yield plant-1 also reported by previous researchers (Meena et al., 2010; Ghosh and Gulati, 2001).
Plant height (cm)
Plant height is an important trait that indicates plants strength towards lodging and another clematis. Mean squares values revealed significant differences among the genotypes, parents, F3, and parents vs. F3 (Table 2). Parental cultivars showed a range of 165.3cm (DH7) to 195.3cm (DH5). In F3 populations, maximum height (193.3 cm) was observed for CA5 × DH3, and minimum height (165.7 cm) was recorded for CA2 × DH4 (Figure 1). Among parental genotypes, variances for plant height ranged from 42.4 to 111.4 for CA2 and DH7 respectively, while in F3 populations, CA2 × DH3 showed minimum variation (116.6) and cross combination CA4 × DH7 showed maximum variation (391.4). Moderate to high broad-sense heritability for plant height was observed. Moderate (0.44) heritability was recorded for cross combinations (CA4 x DH6, CA5 × DH8), while CA5 × DH5 revealed high (0.72) heritability (Table 3).
Five crosses had high heritability estimates, whereas other crosses showed moderate estimates indicating the predominant role of additive gene action. Genetic advance for plant height was maximum (23.6)
Table 2: Mean squares of parental genotypes and F3 populations for various traits.
| Source of Variance |
Replication (df = 02) |
Genotype (df = 30) |
Parents (df = 09) |
F3 (df = 20) |
P vs.F3 (df = 01) |
Error (df = 92) |
CV % |
| Days to 50% flowering | 38.0 |
12.2** |
16.6** | 4.2* | 133.7** | 2.4 | 1.40 |
| Plant height | 136.5 | 247.6** | 340.5** | 191.2** | 539.2** | 46.1 | 3.76 |
| Primary branches | 0.5 | 0.9** | 0.8* | 1.0** | 0.5 | 0.4 | 13.79 |
| Main raceme length | 51.6 | 103.8** | 145.0** | 49.1* | 827.4** | 27.2 | 6.15 |
|
Pods main raceme-1 |
90.7 | 72.6** | 77.0* | 71.9** | 46.2 | 34.9 | 8.64 |
| Pod length | 0.1 | 2.2** | 2.9** | 1.9** | 1.6** | 0.9 | 7.77 |
|
Seeds pod-1 |
1.9 | 19.1** | 4.6** | 25.9** | 14.4** | 0.7 | 3.92 |
| 1000-seed weight | 0.4 | 1.5** | 1.2** | 0.7* | 21.0** | 0.4 | 9.54 |
|
Seed yield plant-1 |
7.1 | 29.2** | 27.7** | 20.7** | 212.1** | 5.1 | 16.98 |
*, ** = Significant at the 1% and 5% level of probability, respectively.
for CA5 × DH5 while minimum (9.0) for CA2 × DH3 (Table 3). Zhang and Zhou (2006) and Mahmood et al. (2003) also reported moderately high heritability and high genetic advance for plant height. Correlation analysis revealed that plant height has a significant correlation with primary branches (rp=0.38) and pods main raceme-1 (rp=0.40) (Table 6). These findings suggested that upsurge in the height of plant affect a number of primary branches and cause an increase in pods main raceme-1. The correlation between plant height and seed yield was non-significant. Khan et al. (2008b) and Kumar et al. (1984) reported a strong association between plant height and seed yield. The difference in the present findings could be due to the differences in the genetic material and environmental conditions.
Primary branches plant-1
Primary branches plant-1 is the yield contributing character associated directly to the number of pods plant-1, which is the main factor that contributes to the final yield. Statistical analysis revealed significant
Table 3: Variances, heritability and genetic advance of days to 50% flowering, plant height and primary branches in Brassica napus.
| Genotypes |
Days to flowering |
Plant height | Primary branches | ||||||
| Var. |
h2 |
GA | Var. |
h2 |
GA | Var. |
h2 |
GA | |
| CA2 | 2.8 | 42.4 | 0.7 | ||||||
| CA4 | 3.2 | 92.5 | 0.9 | ||||||
| CA5 | 2.0 | 93.7 | 1.1 | ||||||
| DH2 | 1.1 | 88.7 | 1.1 | ||||||
| DH3 | 4.7 | 78.7 | 0.4 | ||||||
| DH4 | 3.4 | 79.2 | 0.8 | ||||||
| DH5 | 3.0 | 91.1 | 0.9 | ||||||
| DH6 | 2.6 | 92.4 | 0.5 | ||||||
| DH7 | 1.1 | 111.4 | 0.8 | ||||||
| DH8 | 2.6 | 103.5 | 0.8 | ||||||
| CA2×DH2 | 6.4 | 0.68 | 3.0 | 247.2 | 0.65 | 18.0 | 2.1 | 0.55 | 1.4 |
| CA2×DH3 | 8.6 | 0.56 | 2.9 | 116.6 | 0.47 | 9.0 | 1.7 | 0.65 | 1.5 |
| CA2×DH4 | 5.8 | 0.51 | 2.2 | 124.4 | 0.49 | 9.7 | 2.2 | 0.57 | 1.5 |
| CA2×DH5 | 14.2 | 0.75 | 5.0 | 145.0 | 0.51 | 10.7 | 1.3 | 0.39 | 0.8 |
| CA2×DH6 | 6.4 | 0.58 | 2.6 | 146.9 | 0.53 | 11.4 | 1.6 | 0.63 | 1.4 |
| CA2×DH7 | 7.5 | 0.70 | 3.4 | 165.8 | 0.54 | 12.2 | 1.5 | 0.54 | 1.2 |
| CA2×DH8 | 13.1 | 0.78 | 5.0 | 147.6 | 0.51 | 10.8 | 1.7 | 0.59 | 1.4 |
| CA4×DH2 | 6.0 | 0.63 | 2.7 | 178.8 | 0.48 | 11.4 | 2.1 | 0.54 | 1.4 |
| CA4×DH3 | 12.8 | 0.57 | 3.6 | 179.9 | 0.51 | 12.1 | 1.9 | 0.63 | 1.5 |
| CA4×DH4 | 11.1 | 0.74 | 4.3 | 161.9 | 0.45 | 10.1 | 1.7 | 0.49 | 1.1 |
| CA4×DH5 | 9.8 | 0.57 | 3.1 | 194.8 | 0.53 | 13.0 | 1.7 | 0.50 | 1.2 |
| CA4×DH6 | 5.5 | 0.54 | 2.3 | 164.2 | 0.44 | 9.8 | 1.8 | 0.61 | 1.5 |
| CA4×DH7 | 6.8 | 0.67 | 3.1 | 391.4 | 0.64 | 22.4 | 2.4 | 0.67 | 1.8 |
| CA4×DH8 | 5.3 | 0.50 | 2.0 | 215.5 | 0.54 | 14.0 | 2.6 | 0.66 | 1.9 |
| CA5×DH2 | 15.5 | 0.80 | 5.6 | 303.4 | 0.69 | 21.3 | 2.8 | 0.58 | 1.7 |
| CA5×DH3 | 12.1 | 0.59 | 3.6 | 182.4 | 0.51 | 12.0 | 1.7 | 0.54 | 1.2 |
| CA5×DH4 | 5.8 | 0.58 | 2.5 | 169.8 | 0.50 | 11.5 | 2.5 | 0.57 | 1.6 |
| CA5×DH5 | 14.0 | 0.76 | 5.0 | 349.8 | 0.72 | 23.6 | 1.7 | 0.39 | 0.9 |
| CA5×DH6 | 3.9 | 0.44 | 1.5 | 270.7 | 0.65 | 18.8 | 1.8 | 0.57 | 1.4 |
| CA5×DH7 | 4.7 | 0.62 | 2.4 | 246.3 | 0.48 | 13.3 | 1.7 | 0.44 | 1.0 |
| CA5×DH8 | 9.7 | 0.66 | 3.6 | 183.7 | 0.44 | 10.6 | 2.1 | 0.55 | 1.4 |
differences among genotypes, parents, and F3 populations, whereas parents vs. F3 populations showed non-significant differences (Table 2). Maximum branches (5.2) were observed for CA2, while minimum primary branches (3.7) were noted on the DH6 parental line. In F3 populations, primary branches varied from 3.7 to 5.6. Maximum branches (5.6) were observed for CA5 × DH6, while minimum branches (3.7) were observed for CA4 × DH4 (Figure 1). Khan et al. (2013), Gangapur et al. (2009) and Azadgoleh et al. (2009) also reported significant
Table 4: Variances, heritability and genetic advance of main raceme length, pods main raceme-1 and pod length in Brassica napus.
| Genotypes | Main raceme length |
Pods main raceme-1 |
Pod length | ||||||
| Var. |
h2 |
GA | Var. |
h2 |
GA | Var. |
h2 |
GA | |
| CA2 | 84.5 | 66.5 | 0.4 | ||||||
| CA4 | 73.9 | 67.1 | 0.5 | ||||||
| CA5 | 85.3 | 55.4 | 0.7 | ||||||
| DH2 | 43.8 | 65.3 | 0.5 | ||||||
| DH3 | 74.6 | 77.0 | 0.8 | ||||||
| DH4 | 77.7 | 82.6 | 0.5 | ||||||
| DH5 | 88.1 | 61.6 | 0.7 | ||||||
| DH6 | 67.6 | 79.2 | 0.5 | ||||||
| DH7 | 63.6 | 73.1 | 0.4 | ||||||
| DH8 | 69.1 | 73.3 | 0.5 | ||||||
| CA2×DH2 | 132.8 | 0.51 | 10.4 | 155.5 | 0.56 | 12.4 | 0.9 | 0.51 | 0.9 |
| CA2×DH3 | 153.5 | 0.48 | 10.4 | 160.5 | 0.56 | 12.5 | 1.4 | 0.55 | 1.1 |
| CA2×DH4 | 160.0 | 0.49 | 10.9 | 159.5 | 0.53 | 11.8 | 1.0 | 0.47 | 0.8 |
| CA2×DH5 | 152.5 | 0.43 | 9.4 | 136.7 | 0.53 | 11.0 | 0.9 | 0.42 | 0.7 |
| CA2×DH6 | 146.0 | 0.48 | 10.2 | 161.6 | 0.55 | 12.2 | 0.9 | 0.49 | 0.8 |
| CA2×DH7 | 140.9 | 0.45 | 9.3 | 172.3 | 0.57 | 13.2 | 1.7 | 0.76 | 1.7 |
| CA2×DH8 | 130.6 | 0.40 | 8.1 | 149.1 | 0.52 | 11.2 | 1.3 | 0.62 | 1.2 |
| CA4×DH2 | 158.0 | 0.59 | 13.1 | 162.5 | 0.58 | 13.0 | 1.0 | 0.44 | 0.8 |
| CA4×DH3 | 131.7 | 0.43 | 8.8 | 150.6 | 0.50 | 10.9 | 1.5 | 0.53 | 1.2 |
| CA4×DH4 | 134.6 | 0.42 | 8.6 | 156.7 | 0.52 | 11.4 | 1.0 | 0.47 | 0.8 |
| CA4×DH5 | 119.0 | 0.31 | 6.0 | 134.2 | 0.52 | 10.6 | 1.2 | 0.47 | 0.9 |
| CA4×DH6 | 107.4 | 0.34 | 6.3 | 220.6 | 0.56 | 14.5 | 1.0 | 0.45 | 0.8 |
| CA4×DH7 | 132.4 | 0.46 | 9.4 | 121.6 | 0.42 | 8.1 | 0.9 | 0.49 | 0.8 |
| CA4×DH8 | 100.8 | 0.30 | 5.3 | 162.8 | 0.55 | 12.3 | 0.9 | 0.37 | 0.6 |
| CA5×DH2 | 153.0 | 0.55 | 12.0 | 195.5 | 0.66 | 16.1 | 1.0 | 0.40 | 0.7 |
| CA5×DH3 | 135.4 | 0.41 | 8.4 | 111.9 | 0.41 | 7.6 | 1.5 | 0.49 | 1.0 |
| CA5×DH4 | 211.9 | 0.56 | 14.4 | 210.8 | 0.61 | 15.6 | 2.6 | 0.74 | 2.1 |
| CA5×DH5 | 181.4 | 0.45 | 10.7 | 298.1 | 0.80 | 24.3 | 1.3 | 0.46 | 0.9 |
| CA5×DH6 | 201.5 | 0.60 | 15.0 | 252.7 | 0.69 | 19.3 | 1.1 | 0.44 | 0.8 |
| CA5×DH7 | 136.5 | 0.43 | 8.8 | 122.5 | 0.46 | 9.0 | 1.5 | 0.64 | 1.4 |
| CA5×DH8 | 140.2 | 0.45 | 9.4 | 120.7 | 0.46 | 8.9 | 1.1 | 0.44 | 0.8 |
genetic variability for primary branches plant-1 among rapeseed genotypes. However, Abideen et al. (2013), reported non-significant differences among rapeseed genotypes for primary branches plant-1; this contradiction may be due to the difference in environment and breeding material used. Among parents, the variances ranged from 0.4 (DH3) to 1.1 (CA5, DH2). Among F3 populations, maximum variation (2.80) was shown by CA5 × DH2, and minimum variation (1.3) was recorded for CA2 × DH5 (Table 3). Heritability estimates for primary branches ranged from moderate (0.39) to high (0.67). These results suggested that selection for primary branches plant-1 could be effective in the early generation. Cross combination, CA4 × DH7 had the highest heritability (0.67), while the lowest heritability (0.39) was estimated for F3 populations CA2 × DH5, CA5 × DH5 (Table 3). Minimum genetic advance (0.8) was observed for CA2 × DH5, and maximum genetic advance (1.9) was observed for CA4 × DH8 (Table 3). Earlier researchers (Marinkovic et al., 2003; Bozokalfa et al., 2010; Muhammad et al., 2014b) also reported high heritability with the moderate genetic advance in Brassica napus genotypes for primary branches plant-1. Primary branches exhibited a highly significant relationship with seed yield plant-1 (rp=0.49) and pods main raceme-1 (rp=0.40) (Table 6). These results indicated that primary branches plant-1 significantly affected pods main raceme-1 and may have increased seed yield. The positive association between primary branches and seed yield plant-1 confirms the findings of Gangapur et al. (2009).
Main raceme length (cm)
Data for main raceme length revealed significant genetic variability among genotypes, parents, F3 populations, and parents vs. F3 populations (Table 2). Among parental cultivars, the main raceme length ranged from 73.9 to 97.2cm for DH5 and DH8, respectively. Among F3 populations, maximum raceme length (93.3 cm) was recorded for CA5 × DH5, while minimum length (79.9 cm) was recorded for CA2 × DH4 (Figure 1). Our results are also in agreement with the earlier findings of Tahir et al. (2006). Maximum variation (88.1) was observed for parental line DH5, while minimum variation (43.8) was recorded in DH2. Among cross combinations, maximum variation (211.9) was recorded for CA5 × DH4, whereas minimum variation (100.8) was calculated for CA4 × DH8 (Table 4). For the main raceme length, broad-sense heritability estimates varied from 0.30 to 0.60 for CA4 × DH8 and CA5 × DH6, respectively (Table 4). All cross combinations showed moderate heritability, indicating less environmental influence. The genetic advance was maximum (15.0) for CA5 × DH6, while minimum value (5.3) was recorded for CA4 × DH8 (Table 4). Zhang and Zhou (2006) reported high heritability coupled with a high genetic advance in segregating populations of Brassica napus. The phenotypic correlation of main raceme length was positive and significant with pod main raceme-1 (rp=0.55), 1000-seed weight (rp=0.50), and seed yield plant-1 (rp=0.41) (Table 6). Sabaghina et al. (2010) and Sadat et al. (2010) also reported significant correlation between main raceme length and seed yield plant-1.
Table 5: Variances, heritability and genetic advance of seed pod-1, 1000-seed weight and seed yield plant-1 in Brassica napus.
| Genotypes |
Seeds pod-1 |
1000-seed weight |
Seed yield plant-1 |
||||||
| Var. |
h2 |
GA | Var. |
h2 |
GA | Var. |
h2 |
GA | |
| CA2 | 7.4 | 0.5 | 12.8 | ||||||
| CA4 | 5.2 | 0.9 | 14.1 | ||||||
| CA5 | 7.4 | 0.6 | 4.6 | ||||||
| DH2 | 5.7 | 0.3 | 12.7 | ||||||
| DH3 | 6.9 | 0.7 | 12.7 | ||||||
| DH4 | 6.7 | 0.7 | 11.1 | ||||||
| DH5 | 6.4 | 0.4 | 12.0 | ||||||
| DH6 | 5.6 | 0.7 | 6.5 | ||||||
| DH7 | 8.6 | 0.6 | 2.3 | ||||||
| DH8 | 8.8 | 0.7 | 9.9 | ||||||
| CA2×DH2 | 15.7 | 0.56 | 3.9 | 1.0 | 0.59 | 1.1 | 46.6 | 0.59 | 7.1 |
| CA2×DH3 | 16.1 | 0.56 | 3.9 | 1.7 | 0.56 | 1.3 | 47.4 | 0.61 | 7.4 |
| CA2×DH4 | 16.8 | 0.59 | 4.2 | 1.8 | 0.67 | 1.6 | 23.3 | 0.48 | 4.1 |
| CA2×DH5 | 15.0 | 0.54 | 3.7 | 1.7 | 0.60 | 1.4 | 20.6 | 0.39 | 3.1 |
| CA2×DH6 | 13.5 | 0.52 | 3.4 | 1.3 | 0.41 | 0.8 | 16.9 | 0.44 | 3.2 |
| CA2×DH7 | 14.4 | 0.45 | 3.0 | 1.5 | 0.57 | 1.2 | 35.8 | 0.77 | 8.1 |
| CA2×DH8 | 15.8 | 0.48 | 3.4 | 1.0 | 0.40 | 0.7 | 22.7 | 0.49 | 4.1 |
| CA4×DH2 | 12.2 | 0.53 | 3.3 | 1.2 | 0.53 | 1.0 | 26.9 | 0.43 | 3.9 |
| CA4×DH3 | 13.1 | 0.53 | 3.4 | 1.7 | 0.50 | 1.1 | 25.4 | 0.45 | 4.0 |
| CA4×DH4 | 12.9 | 0.52 | 3.3 | 1.7 | 0.52 | 1.2 | 24.9 | 0.49 | 4.3 |
| CA4×DH5 | 11.9 | 0.50 | 3.1 | 1.2 | 0.46 | 0.9 | 29.6 | 0.53 | 5.1 |
| CA4×DH6 | 12.4 | 0.53 | 3.3 | 1.7 | 0.57 | 1.3 | 20.5 | 0.49 | 3.9 |
| CA4×DH7 | 12.4 | 0.44 | 2.7 | 1.3 | 0.43 | 0.9 | 30.9 | 0.67 | 6.5 |
| CA4×DH8 | 13.8 | 0.49 | 3.2 | 1.4 | 0.37 | 0.8 | 31.1 | 0.56 | 5.5 |
| CA5×DH2 | 13.5 | 0.50 | 3.2 | 1.5 | 0.56 | 1.2 | 17.0 | 0.47 | 3.4 |
| CA5×DH3 | 12.8 | 0.44 | 2.8 | 1.0 | 0.33 | 0.6 | 14.2 | 0.40 | 2.7 |
| CA5×DH4 | 20.9 | 0.54 | 4.3 | 1.0 | 0.36 | 0.6 | 20.4 | 0.58 | 4.6 |
| CA5×DH5 | 28.9 | 0.76 | 7.2 | 1.0 | 0.49 | 0.9 | 13.3 | 0.38 | 2.4 |
| CA5×DH6 | 16.1 | 0.55 | 3.9 | 1.7 | 0.55 | 1.2 | 25.0 | 0.65 | 5.7 |
| CA5×DH7 | 24.7 | 0.63 | 5.5 | 1.0 | 0.47 | 0.8 | 18.2 | 0.78 | 5.9 |
| CA5×DH8 | 14.5 | 0.44 | 2.9 | 0.8 | 0.25 | 0.4 | 32.7 | 0.76 | 7.7 |
Pods main raceme-1
Number of pods main raceme-1 is a major seed yield-contributing trait. Significant genetic variability was observed genotypes, parents, and F3 populations, while parents vs. F3 revealed non-significant genetic variability (Table 2). Among parental cultivars, CA5 produced minimum pods (63.1), while maximum pods (76.6) were present on the main raceme of DH8. Among F3 populations, the maximum number of pods (80.9) were present on the main raceme of CA5 × DH6, while the least number of pods (61.3) were present on the main raceme of CA2 x DH6 (Figure 1). Tahir et al. (2006) also observed significant differences among brassica genotypes for pods main raceme-1. Maximum variation (82.6) was observed for DH4, and minimum variation (55.4) was observed for CA5 in parents. Among F3 populations, variances varied from 111.9 to 298.1 for CA5 × DH3 and CA5 × DH5, respectively (Table 4). Heritability values ranged from moderate (0.41) to high (0.80). CA5 × DH3 showed moderate (0.41) heritability, and CA5 × DH5 revealed high (0.80) broad-sense heritability for the number of pods main raceme-1. The majority of F3 populations showed moderate broad-sense heritability, indicating that selection should be delayed until later generations to get efficient results. CA5 × DH5 showed maximum (24.3) genetic advance whereas, CA5 × DH3 showed minimum (7.6) value for genetic advance (Table 4). High heritability coupled with high genetic advance for Brassica napus genotypes was also reported by (Khan et al., 2014; Khan et al., 2008a; Rameeh, 2011). Pods the main raceme-1 displayed a significant and positive correlation with 1000-seed weight (rp=0.36), while no correlation was observed with the remaining traits (Table 6). Our results are contradictory to the findings of Ghosh and Gulati (2001) reported a significant association between pods main raceme-1 and seed yield plant-1. The difference in results could be due to the differences in genetic material and environmental conditions.
Pod length (cm)
Pod length is an important yield-contributing trait and plays a significant role in the upsurge of yield because longer pods produce more seed, which has a direct effect on seed yield. Data for pod length revealed significant differences among genotypes, parents, F3 populations, and parent vs. F3 (Table 2). Parental cultivars (CA5 and DH6) revealed a minimum (5.6 cm) pod length while DH7 showed a maximum (8.6 cm) pod length. Among F3 crosses, pod length ranged from 4.8 cm (CA5 × DH6) to 8.2 cm (CA2 × DH7, CA5 × DH7) (Figure 1). Azadgoleh et al. (2009) also reported significant variation among Brassica napus genotypes for pod length. Among parental cultivars, maximum variation (0.8) regarding pod length was found for DH3, and CA2 and DH7 showed minimum variation (0.4). Among F3 populations, the maximum variance (2.6) was observed for CA5 × DH4, while minimum variance (0.9) was indicated by cross combinations, CA2 × DH2, CA2 × DH5, CA2 × DH6, CA4 × DH7 and CA4 × DH8 (Table 4). Broad sense heritability for pod length ranged from moderate (0.37) to high (0.76). High heritability (0.76) was estimated for CA2 × DH7, whereas low heritability (0.37) was estimated for CA4 × DH8. The majority of F3 cross combinations revealed a moderate type of heritability while a few were present in the high region. Genetic advance for pod length ranged from 0.6 to 2.1 for CA4 × DH8 and CA5 × DH4, respectively (Table 4). These results suggested that selection for longer pods in the early generation could be more effective. Khan et al. (2014), Bozokalfa et al. (2010) and Mahmood et al. (2003), also stated high broad-sense heritability with maximum genetic advance for pod length. Pod length was significantly and positively correlated with seed pod-1 (rp=0.46) (Table 6).
Table 6: Phenotypic correlation coefficient among important traits in F3 populations of Brassica napus.
| DF | PH | PB | MRL | PMR | PL | SPP | TSW | SYP | |
| DF | 0 | 0.11 | -0.07 | 0.29 | 0.08 | -0.01 | 0.21 | 0.40* | 0.45* |
| PH | 0 | 0.38* | 0.33 | 0.40* | -0.08 | -0.03 | -0.14 | 0.23 | |
| PB | 0 | 0.29 | 0.40* | -0.08 | -0.05 | -0.09 | 0.49** | ||
| MRL | 0 | 0.55** | 0.12 | 0.04 | 0.50** | 0.41* | |||
| PMR | 0 | -0.03 | -0.24 | 0.36* | 0.31 | ||||
| PL | 0 | 0.46** | 0.35 | 0.17 | |||||
| SPP | 0 | 0.20 | 0.41* | ||||||
| TSW | 0 | 0.38* | |||||||
| SYP | 0 |
**: highly significant; *: significant. Note: DF: days to flowering, PH: plant height, PB: primary branches, MRL: main raceme length, PMR: pods main raceme-1, PL: pod length, SPP; seeds pod-1, TSW: 1000-seed weight, SYP: seed yield plant-1.
Seeds pod-1
Seed pod-1 is an important yield-contributing trait. Analysis of variance for seed pod-1 revealed highly significant differences among genotypes, parents, F3 populations, and parent vs. F3 populations (Table 2). Among parents, it ranged from 20.0 to 23.7 for DH7 and DH5, respectively. Among F3 populations, it varied from 12.6 to 25.7 seeds pod-1 for CA5 × DH6 and CA5 × DH7, respectively (Figure 1). Variances among parents ranged from 5.2 to 8.8 for CA4 to DH8, respectively (Table 5). Among F3 cross combinations, maximum variation (28.9) was observed for CA5 × DH5, whereas minimum variation (11.9) was observed for CA4 × DH5 cross combination (Table 5). Heritability estimates for F3 populations ranged from 0.44 (CA4 × DH7, CA5 × DH3, CA5 × DH8) to 0.76 (CA5 × DH5) (Table 5). Maximum genetic advance (7.2) was observed for CA5 × DH5, whereas minimum genetic advance (2.7) was observed for cross combination CA4 x DH7. These results suggested that selection based on this trait could be more effective in early generations. High heritability with maximum genetic advance was reported by (Khan et al., 2014). The correlation of seed pod-1 was positive and significant with seed yield plant-1 (rp=0.41) (Table 6). Our results are following the findings of Ivanovska et al. (2007), also described a significant association of seed pod-1 with pod length and seed yield plant-1.
1000-seed weight (g)
Analysis of variance revealed significant differences among genotypes, parents, F3 populations, and parents vs. F3 populations (Table 2). For parents, maximum 1000-seed weight (7.3g) was observed for DH8, whereas minimum seed weight (5.1g) was observed for CA5. Among F3 cross combinations, maximum 1000-seed weight (7.8g) was found for CA2 × DH7, while minimum (5.9g) was observed for cross combination CA2 × DH2 (Figure 1). Variances for parents ranged from 0.3 (DH2) to 0.9 (CA4). Among F3 populations, variation ranged from 0.8 to 1.8 for CA5 × DH8 and CA2 × DH4, respectively (Table 5). High heritability (0.67) associated with high genetic advance (1.6) was estimated for CA2 × DH4, while low heritability (0.25) along with low genetic advance (0.4) was estimated for CA5 × DH8. Majority of heritability values were estimated in the moderate range (Table 5). Our conclusions are in agreement with the results of Khan et al. (2013), Zhang and Zhou (2006) and Nazeer et al. (2003) estimated moderately high heritability and genetic advance for 1000-seed weight. A significant relationship of 1000-seed weight was observed with seed yield plant-1 (rp=0.38) (Table 6). Our results are in line with the findings of Bikram (2004), who reported a positive association of 1000-seed weight with seed yield.
Seed yield plant-1
In rapeseed, seed yield is a complex trait and economically the most important factor. Analysis of variance showed significant differences among genotypes, parents, F3 populations, and parents vs. F3 populations (Table 2). For parents, maximum seed yield plant-1 (15.2g) was observed for DH4, while minimum (6.3g) was observed for DH7. For F3 cross combinations, minimum seed yield plant-1 (8.7g) was observed for CA2 × DH6, while maximum seed yield plant-1 (18.4g) was recorded for CA5 × DH3 (Figure 1). Present results are following per the findings of Khan et al. (2013), who reported highly significant differences for seed yield plant-1 in Brassica napus genotypes. In parents, minimum variance (2.3) was observed for DH7, while CA4 had a maximum variance of 14.1. Among F3 populations, CA2 × DH3 had maximum variance (47.4), whereas, CA5 × DH5 had minimum variance (13.3) value (Table 5). Heritability estimates facilitate the evaluation of genetic and environmental effects, which aids in selection. Estimates of heritability can also be used to predict genetic advance under selection. Most of the heritability values were estimated in the moderate range. The highest heritability (0.78) was estimated for CA5 × DH7, followed by CA2 × DH7 (0.77), whereas, low heritability (0.38) was estimated for CA5 × DH5. The genetic advance value was high (8.1) for CA2 × DH7 and low (2.4) for CA5 x DH5 (Table 5). Zehra and Kinaci (2009) reported maximum variability, broad-sense heritability, and genetic advance for seed yield in Brassica napus. The correlation of seed yield with its components has considerable importance. Correlation study for seed yield plant-1 revealed the existence of positive and significant correlation with days to 50% flowering (rp=0.45), primary branches (rp=0.49), main raceme length (rp=0.41), seeds pod-1 (rp=0.41) and 1000-seed weight (rp=0.38) (Table 6). Tuncturk and Ciftci (2007) reported a positive correlation between seed yield with the number of branches, pods plant-1, seeds pod-1, and 1000-seed weight.
Conclusions and Recommendations
Significant amount of genetic variability was observed among brassica napus genotypes for all the traits studied. Moderate to high broad-sense heritability coupled with high genetic advance was recorded for the majority of the traits for most of the F3 populations, hence indicating that selection could be effective in the early generation for possible improvement. Correlation analysis uncovered the presence of positive and significant association of seed yield plant-1 with other traits, so more importance should be given to these characters for yield improvement. Parental lines, DH4, DH5, DH8 and F3 cross combinations, CA5 × DH6, CA5 × DH7, CA5 × DH3, and CA2 × DH7 performed better for most of the traits and displayed well genetic potential, hence could be used in future rapeseed breeding programs.
Author’s Contribution
Fazli Ahad: Conducted the experiment.
Raziuddin: Supervised the research.
Nazir Ahmad: Wrote the research article.
Muhammad Nauman: Data collection.
Touheed Iqbal: Data analysis.
Nabeel Khan: Organize the data.
Fazli Hameed: Organize the references.
Quaid Hussain: Revised the paper.
Conflict of interest
The authors have declared no conflict of interest.
References
Abideen, S.N., F. Nadeem and S.A. Abideen. 2013. Genetic variability and correlation studies in Brassica napus L. genotypes. Int. J. Innov. App. Stud. 2(4): 2028-9324.
Aytaç, Z. and G. Kinaci. 2009. Genetic variability and association studies of some quantitative characters in winter rapeseed (Brassica napus L.) Afr. J. Biotech. 8(15): 3547-3554.
Azadgoleh, E.M.A., M. Zamani and E. Yasari. 2009. Agronomical important traits correlation in rapeseed (Brassica napus L.) Genotypes. Res. J. Agric. Bio. Sci. 5(5): 798-802.
Azam, S.M., Farhatullah, A. Nasim, S. Shah and S. Iqbal. 2013. Correlation studies for some agronomic and quality traits in Brassica napus L. Sarhad J. Agric. 29(4): 547-550.
Bikram, S., 2004. Character association and path analysis under dryland condition in India mustard (B. Juncea). Cruciferae Newsl. 25: 99-100.
Bozokalfa, K.M., D.E. Ilbi and T.K. Asciogul. 2010. Estimates of genetic variability and association studies in quantitative plant traits of Eruca spp. Landraces. Genetika. 42(3): 501-512. https://doi.org/10.2298/GENSR1003501B
FBS. 2012-2013. Pakistan oilseed development board. Fed. Bur. Stat. pp. 22-23.
Gangapur, D.R., B.G. Prakash, P.M. Salimath, R.L. Ravikumar and M.S.L. Rao. 2009. Correlation and path analysis in Indian mustard (Brassica juncea L.Czern and Coss). Karnataka J. Agric. Sci. 22(5): 971-977.
Ghosh, S.K. and S.C. Gulati. 2001. Genetic variability and association of yield components in Indian mustard. Crop Res. 21(3): 345-349.
Ivanovska, S., C. Stojkovski, Z. Dimov, A.M. Jeromela, M. Jankulovska and L. Jankuloski. 2007. The interrelationship between yield and yield-related traits of spring canola (Brassica napus L.) Genotypes. Genetika. 39(3): 325-332. https://doi.org/10.2298/GENSR0703325I
Johnson, H.W., H.F. Robinson and R.I. Comstock. 1955. Estimates of genetic and environmental variability in soybeans. Agron. J. 47(7): 314-318. https://doi.org/10.2134/agronj1955.00021962004700070009x
Khan, F.U., Farhatullah, Raziuddin and F. Mohammad. 2014. Heritability estimates in intra and inter-specific F2 populations of Brassica napus. J. Biol. Agric. Healthc. 4(20): 102-107.
Khan, F.U., Raziuddin, I. A. Khalil, I.H. Khalil and I. Ullah. 2013. Heritability and genetic potential of Brassica napus genotypes for yield and yield components. Am. -Eurasian J. Agric. Environ. Sci. 13(6): 802-806.
Khan, S., Farhatullah, I.H. Khalil, I. Munir, M.Y. Khan and N. Ali. 2008a. Genetic variability for morphological traits in F3:4 Brassica populations. Sarhad J. Agric. 24(2): 217-222.
Khan, S., Farhatullah and I.H. Khalil. 2008b. Phenotypic correlation analysis of elite F3:4 brassica populations for quantitative and qualitative traits. ARPN J. Agric. Bio. Sci. 3(1): 38-42.
Kumar, P., Yadava, T.P. and A.K. Yadava. 1984. Association of seed yield and its components traits in the F2 generation of Indian mustard. Indian J. Agric. Sci. 54: 604-607.
Mahmood, T., M. Ali., S. Iqbal and M. Anwar. 2003. Genetic variability and heritability estimates in summer mustard (Brassica juncea L.). Asian J. Plant Sci. 2(1): 77-79. https://doi.org/10.3923/ajps.2003.77.79
Mahmud, I. and H.H. Kramer. 1951. Segregation for yield, height, and maturity following a soybean cross. Agron. J. 43(12): 605-609. https://doi.org/10.2134/agronj1951.00021962004300120005x
Marinkovic, R., A.M. Jeromela and D. Vasic. 2003. Genetic variability components of some quantitative traits of winter oil-seed rape (Brassica napus L.). Genetika. 35(3): 199-205. https://doi.org/10.2298/GENSR0303199M
Mazurkievicz, G., I.D.P. Ubert, F.A. Krause and I.C. Nava. 2019. Phenotypic variation and heritability of heading date in hexaploid oat. Crop Breed. Appl. Biotech. 19(4): 436-443. https://doi.org/10.1590/1984-70332019v19n4a61
Muhammad, A., Raziuddin, A. Muhammad, H. Raza, A. Rahman and I. Ali. 2014a. Combining ability and heritability studies for important traits in F2 populations of Brassica napus L. Int. J. Basic Appl. Sci. 14(1): 7-11.
Muhammad, A., Raziuddin, M. Sajid, Q.U. Bacha, A. Rahman and S.A. Khan. 2014b. Combining ability and heritability studies for yield contributing traits in F2 populations of Brassica napus L. Am. J. Agric. Environ. Sci. 14(06): 509-515.
Nagaharu, U. and N. Nagaharu. 1935. Genome analysis in Brassica with special reference to the experimental formation of Brassica napus and peculiar mode of fertilization. Japan J. Bot. 7: 389-452.
Nasim, A., Farhatullah, S. Iqbal, S. Shah and S.M. Azam. 2013. Genetic variability and correlation studies for morpho-physiological traits in (Brassica napus L.). Pak. J. Bot. 45(4): 1229-1234.
Nazeer, A., F. Javidfar, J.Y. Elmira and M. Mirza. 2003. The relationship among yield components and selection criteria for yield improvement in winter rapeseed (Brassica napus L.). Pak. J. Bot. 35(2): 167-174.
Panse, V.G. and P.V. Sukhatme. 1965. In: Statistical Methods for Agricultural Workers. Indian Counc. Agric. Res. New Delhi, India. pp. 381.
Rameeh, V., 2011. Correlation and path analysis in advanced lines of rapeseed for yield components. J. Oilseed Brassica. 1(2): 56-60.
Robinson, H.F., R.E. Comstock and P.H. Harvey. 1951. Genotypic and phenotypic correlation in corn and their implications in selection. Agron. J. 43(6): 282-287. https://doi.org/10.2134/agronj1951.00021962004300060007x
Sabaghnia, N., H. Dehghani, B. Alizadeh and M. Mohghaddam. 2010. Interrelationships between seed yield and 20 related traits of 49 canola (Brassica napus L.) Genotypes in non-stressed and water-stressed environments. Spanish J. Agric. Res. 8(2): 356-370. https://doi.org/10.5424/sjar/2010082-1195
Singh, R.K. and B.D. Chaudhary. 1979. Biometrical methods in quantitative genetic analysis Kalyani Publishers, New Delhi, India. pp. 318.
Tahir, M.H.N., S. Bashir and A. Bibi. 2006. Genetic potential of canola (Brassica napus L.) Varieties under water stress conditions. Caderno de Pesquisasér. Bio. 18(2): 127-135.
Tuncturk, M. and V. Ciftci. 2007. Relationships between yield and some yield components in rapeseed (Brassica napus L.) Cultivars by using correlation and path analysis. Pak. J. Bot. 39(1): 81-84.
Wright, S., 1921. Correlation and causation. J. Agric. Res. 20: 557-580.
Zehra, A. and G. Kinaci. 2009. Genetic variability and association studies of some quantitative characters in winter rapeseed (Brassica napus L.). Afr. J. Biotech. 8(15): 3547-3554.
Zhang, G. and W. Zhou. 2006. Genetic analysis of agronomic and seed quality traits of synthetic oilseed Brassica napus produced from interspecific hybridization of Brassica campestris and Brassica olearacea L. J. Genet. 85(1): 45-51. https://doi.org/10.1007/BF02728969
Zhou, W.J., G.Q. Zhang, S. Tuvesson, C. Dayteg and B. Gertsson. 2006. Genetic survey of Chinese and Swedish oilseed rape (Brassica napus L.) By simple sequence repeats (SSRS). Genet. Resour. Crop Evol., 53(3): 443-447. https://doi.org/10.1007/s10722-004-7862-6
To share on other social networks, click on any share button. What are these?