

Estimation of Cold Carcass Weight and Body Weight from Several Body Measurements in Sheep through Various Data Mining Algorithms


Estimation of Cold Carcass Weight and Body Weight from Several Body Measurements in Sheep through Various Data Mining Algorithms
Ali Karabacak1, Senol Celik2, Adile Tatliyer3, Ismail Keskin1, Yakup Erdal Erturk4, Ecevit Eyduran5, Yasir Javed6 and Mohammad Masood Tariq7,*
1Department of Animal Science, Faculty of Agriculture, Selcuk University, Konya, Turkey
2Department of Animal Science, Faculty of Agriculture, Bingol University, Bingol, Turkey
3Department of Animal Science, Faculty of Agriculture, Sutcu Imam University, Kahramanmaras, Turkey
4Department of Agricultural Economics, Faculty of Agriculture, Igdir University, Igdir, Turkey
5Department of Animal Science, Faculty of Agriculture, Igdir University, Igdir, Turkey
6COINS Research Group, Riyadh, Kingdom of Saudi Arabia
7Centre of Advanced Studies in Vaccinology and Biotechnology, University of Balochistan, Quetta, Pakistan
ABSTRACT
The goal of the present study was to compare the predictive performance of three data mining algorithms viz., CHAID, Exhaustive CHAID, and CART implemented in the estimation of cold carcass weight (CCW) and body weight (BW) from several body measurements (withers height (WH), chest depth (CD), body length (BL), hearth girth (HG) and leg circumference (LC)) measured from five sheep breeds (Akkaraman (9), Dağlıç (10), Kivircik (10), Merinos (10) and Karacabey Merino (8)) reared in Konya province conditions located in the Central Anatolia Region of Turkey. For measuring the predictive performance of three algorithms in Models I and II, goodness of fit criteria (coefficient of determination (R2%), adjusted coefficient of determination (Adj.R2%), coefficient of variation (CV%), SD ratio, Root Mean Square Error (RMSE), Relative Approximation Error (RAE), and Pearson correlation coefficient between actual and predicted values were calculated. For both Models, CHAID and CART were chosen as the best algorithms in the estimation of CCW trait, whereas only CHAID was the ideal tree-based algorithm in the estimation of BW trait. In conclusion, the determination of the best data mining algorithm on the estimation of BW and CCW traits might be utility for further researches linked with characterization of sheep breeds, and sheep breeding in very large flocks.
Article Information
Received 25 December 2015
Revised 16 September 2016
Accepted 13 May 2017
Available online 05 September 2017
Authors’ Contribution
AK designed the study, acquired and analyzed the data and wrote the article. AT, SC and EE statistically analyzed the data. IK, YEE and MMT helped in analysis of data and preparation of manuscript.
Key words
Data mining, CHAID, Exhaustive CHAID, CART, Cold carcass, Body weight, Regression tree analysis.
DOI: http://dx.doi.org/10.17582/journal.pjz/2017.49.5.1731.1738
* Corresponding author: tariqkianiraja@hotmail.com
0030-9923/2017/0005-1731 $ 9.00/0
Copyright 2017 Zoological Society of Pakistan
Introduction
Small ruminants like sheep and goat have a key role in developing the economy of the Turkey and the world, and meeting basic needs of humans living therein. In a country, carcass yield is one of the indicators that ascertain total meat amount. Meat production increases at desirable levels by virtue of increasing carcass yield. The fact that sheep and goat are among basic production components for those having low income level increases the importance of the issue. In Turkey, sheep carcass weight fluctuated from year to year and ranged between the 16 and 18 kg together with a statistically increasing trend. Red meat plays an essential role as the most important protein source in the mental and physical development of people and especially children. It reaches to consumers at reduced price, depending upon its supply at sufficient level. It is very necessary to improve suitable breeding methods by being properly analyzed factors affecting carcass yield. Sheep breeding studies are inescapable for increasing meat consumption, and therefore most researches are willing to study the interrelationship of the body weight (BW) and Carcass Weight (CW) with several body (morphological) measurements of sheep.
In literature, body measurements are utilized to predict BW fairly well in the situation where weighbridges are not present (Berge, 1977; Buvanendran et al., 1980; Goonerwardene and Sahaayuraban, 1983). The BW estimation is a leading tool to appropriately find medicinal dose, feed amount, and price of sheep (Khan et al., 2014). Also, the relationship between carcass weight and several important body measurements has been underlined both for sheep breeding efforts and for meeting increasing demand in red meat.
In recent years, more sustained attention has been received on the estimation of body weight (Afolayan et al., 2006; Kunene et al., 2009; Cam et al., 2010) and carcass weight from diversified body measurements taken easily from sheep. The estimation operations have been carried widely out by using simple linear regression (Topal and Macit, 2004; Cam et al., 2010), multiple linear regression (Topal et al., 2003; Younas et al., 2013), factor scores in multiple linear regression (Eyduran et al., 2009), and principle component scores in multiple linear regression (Mohammad et al., 2012; Jahan et al., 2013; Khan et al., 2014), but used very finitely by decision tree algorithms (Yakubu, 2012; Khan et al., 2014; Eyduran et al., 2017) in recent years.
Data mining algorithms i.e., CART, QUEST, CHAID, and Exhaustive CHAID are specified in SPSS statistical software (Ali et al., 2015; Koc et al., 2017). Among those, QUEST is applied mostly for a binary-nominal response variable. Whereas, CART (Kovalchuk et al., 2017), CHAID (Akin et al., 2016), and Exhaustive CHAID algorithms, having apparent diagrams, are likely to customize scale, nominal and ordinal response variables, and underutilized in the estimation of body weight from linear body measurements in sheep production (Ali et al., 2015). In the statistical comparison of the data mining algorithms in animal science, goodness of fit criteria have been highlighted very poorly with the exception of few researches (Grzesiak and Zaborski, 2012; Ali et al., 2015).
The data mining algorithms can have the ability of genetically and phenotypically characterizing the sheep breeds in the efficacious description of their own breed traits, and standards, and the information that will be obtained via them for BW and carcass weight (CW) is important for sheep breeders and marketing studies. To our best knowledge, importance of the tree-based algorithms with the aid of the goodness of fit criteria was very poorly highlighted (Eyduran et al., 2008; Yakubu, 2012). In more effective description of the studied data, the best algorithm selection is of the essence for sheep breeding. Accordingly, the main objectives of the present research were to measure performance of CHAID, EXHAUSTIVE CHAID, and CART data mining algorithms fitted in order to estimate cold carcass weight (CCW) and body weight (BW) from several body measurements (withers height (WH), chest depth (CD), body length (BL), hearth girth (HG) and leg circumference (LC)) from five sheep breeds, and especially to display how to interpret the results taken from the study. With the aims, two models were described as Models I and II, respectively. In Model I, BW, WH, CD, BL, HG, LC, and breed were thought as independent variables in the CCW estimation, as well as in Model II, WH, CD, BL, HG, LC and breed were used as independent variables in the BW estimation.
Materials and Methods
As animal material, the data of five sheep breeds (Akkaraman (9), Dağlıç (10), Kivircik (10), Merinos (10) and Karacabey Merinosu (8)) reared in Prof. Dr. Orhan DUZGUNES Research and Application Farm of Agricultural Faculty, Animal Science Department of Selcuk University in Konya province, located in the Central Anatolia Region of Turkey were used. The current data were taken from Karabacak et al. (2009) in order to implement three data mining algorithms. Fattening period for all the lambs (average 20 kg) at weaning period was 68 day. During fattening period, they were fed as ad-libutum with concentrate feed. Each of the lambs was fed with alfalfa of 150 g per day. At the starting of fattening period, body weight (BW), withers height (WH), chest depth (CD), body length (BL), hearth girth (HG) and leg circumference(LC)) were measured. At the end of fattening period, cold carcass weight (CCW) was taken for each lamb slaughtered after 68 days.
Variable structures used at this work were: Breed, a nominal variable (Akkaraman, Dağliç, Kivircik, Malya, and Karacabey Merino); BW, body weight (scale= continuous variable); WH, withers height (scale= continuous variable); CD, chest depth (scale= continuous variable); BL, body length (scale= continuous variable); HG, hearth girth (scale= continuous variable); LC, leg circumference (scale= continuous variable) and CCW, cold carcass weight (scale= continuous variable).
In the study, two models were defined as Models I and II, respectively. In Model I, BW, WH, CD, BL, HG, LC, and breed were involved as independent (explanatory) variables in the CCW estimation, as well as in Model II, WH, CD, BL, HG, LC and breed were employed as independent variables in the BW estimation. But, significantly meaningful variables were involved in constructing decision trees for both models.
Data mining algorithms
Data mining algorithms specified in SPSS statistical software in the current investigation were CART, CHAID, and Exhaustive CHAID, respectively (Ali et al., 2015). They can be fit to prove the relationship between scale dependent variable and several independent variables which can contain both categorical and scale variable structures.
The prediction models of CCW and BW were developed with CHAID, Exhaustive CHAID, and CART data mining (decision tree) algorithms, non-parametric and visual algorithms for some regression problems. Exhaustive CHAID is expressed as an extension of CHAID algorithm. Tree structure of CART algorithm was binary split nodes generated recursively compared with those of the rest algorithms growing multi-split nodes. In the CART algorithm, pruning option to avoid unnecessary nodes in the decision tree diagram was employed. Whereas, pruning option in SPSS program was implemented automatically for both CHAID algorithms. Any statistical assumption was not required for the tested algorithms in the current investigation. The node at the topmost of the decision tree visual diagram is the root node. At subsequent stages, the nodes which cannot be divided into new child nodes in tree diagram are terminal nodes. The aim of the three algorithms is to maximize the variance between nodes, depending upon their tree depth (Ali et al., 2015).
Statistically meaningful independent variables on the dependent variable were utilized in constructing the decision tree diagram. Minimum numbers of animals in parent and child nodes were set at 8 and 4 for optimal outcomes. Minimum starting values on animal numbers were assigned as N/6 and N/12 where N is total number of animals analyzed in the current study to construct optimal tree structure.
All the tree decision tree algorithms have the ability of being multipurpose tools to allow the phenotypic and genetic characterization of breed traits for sheep breeds.
Goodness of fit criteria
To choice the best algorithm, calculation of goodness of fit criteria were possibility via IBM SPSS 22 program. Formulas of the quality criteria as defined by Grzesiak and Zaborski (2012) and Ali et al. (2015) are shown below:
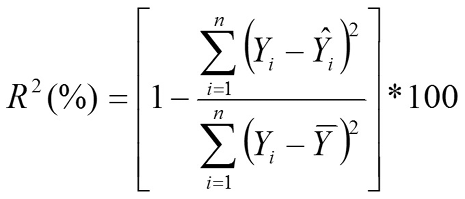
Coefficient of Determination (%)
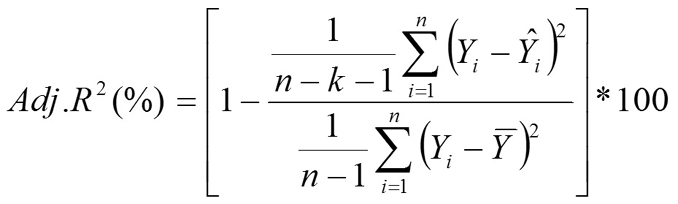
Adjusted Coefficient of Determination (%)
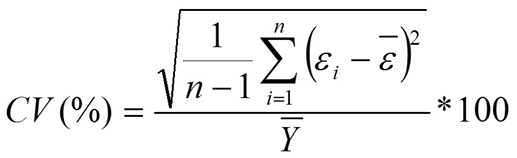
Coefficient of Variation (%)
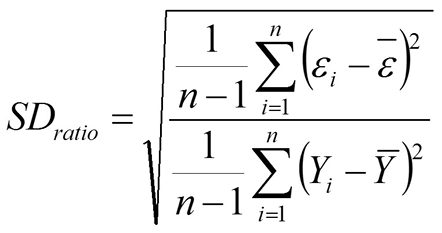
Standard Deviation Ratio
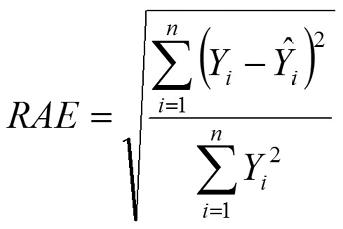
Relative Approximation Error (RAE)
Root Mean Square Error
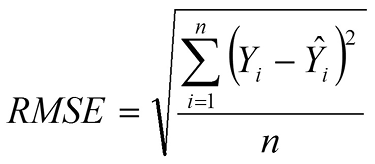
Where, Yi is actual cold carcass weight (Model I) or body weight (Model II) of ith sheep; Ŷi is the predicted cold carcass weight or body weight value of ith sheep; Ῡ is mean of the actual CCW or BW values of ith sheep; ɛi is the residual value of ith sheep associated with CCW or BW; έ is mean of the residual values associated with CCW or BW; k is number of independent variables included significantly in the model, and n is total sample size.
Pearson correlation coefficient between actual and predicted values was estimated for CCW or BW. All the statistical calculations were made by using IBM SPSS 22 software program.
Results and Discussion
This is the first modeling study pertaining to the estimation of CCW and BW via tree-based CART, CHAID and Exhaustive CHAID data mining algorithms from some morphological characteristics and breed factor. All the results and comments from the application of the algorithm having good predictive performance have been summarized below.
Model I (CCW estimation)
Summary results of goodness of fit criteria for data mining algorithms tested for estimating CCW trait are given in Table I. From Table I, it is clear evidence that the scrutinized CART and CHAID were data mining algorithms that had completely same results in goodness of fit criteria, but almost similar responses were also taken to Exhaustive CHAID. Since the suitability of CHAID algorithms for scale dependent variable as regression problem were agreed by some authors (Khan et al., 2014; Ali et al.,2015), visual results of the decision tree diagram constructed with CHAID algorithm were commented. Whereas, the attempt for better improving goodness of fit criteria is very likely to include more different and effective independent variables associated with CCW and to increase total sample size (animal number).
Table I.- Performance results of goodness of fit criteria for data mining algorithms for CCW trait.
| Algorithm |
r |
SD ratio |
CV % |
R2 (%) |
Adj-R2 (%) |
RAE |
RMSE |
|
CHAID |
0.802 |
0.598 |
6.099 |
64.3 |
61.8 |
0.060 |
1.053 |
|
Ex. CHAID |
0.795 |
0.607 |
6.192 |
63.2 |
60.6 |
0.061 |
1.069 |
|
CART |
0.802 |
0.598 |
6.099 |
64.3 |
61.8 |
0.060 |
1.053 |
Figure 1 depicts the regression tree diagram for the CCW estimation from the scale variables, BW, WH, CD, BL, HG and TC and breed factor. When looking at the decision tree diagram of CHAID algorithm, it was understood that breed factor was found as the premier factor influencing CCW trait (F=30.567, df1=1, df2=45, Adj- P=0.000). BW (Adj- P=0.010, F=15.096, df1=1, df2=18) and HG (Adj- P=0.008, F=13.549, df1=1, df2=25) were suggested to be the second degree most effective variables in Figure 1.
The overall CCW average of 17.451 (S=1.781) kg was estimated for Node 0 in which 47 sheep was present at the top section of CHAID decision tree diagram. Node 0 also nominated as root node was divided into two new child nodes (Nodes 1 and 2) with regard to breed factor, respectively. In the decision tree diagram, Akkaraman, Malya, and Karacabey Merino sheep breeds were clustered in Node 1 with the average CCW of 18.416 (S=1.335) kg , but the rest ones in Node 2 with the CCW average of 16.150 (S=1.461) kg. CCW trait of the group of Daglic and Kivircik sheep in Node 2 was influenced by BW, while HG had an important effect on CCW trait of the group of Akkaraman, Malya, and Karacabey Merino sheep breeds (Adj-P=0.008, F=13.549, df1=1, df2=25). As seen from Figure 1, the first branches revealed that, HG for CCW of Akkaraman, Malya, Karacabey Merino sheep as well as BW for CCW trait of Dağlıç and Kıvırcık sheep were initially determinant variables.
Node 1 was re-branched into Nodes 3 and 4, with respect to HG respectively (Adj-P=0.008, F=13.549, df1=1, df2=25). With the average CCW of 19.353 (S=1.008) kg, Node 4, a sub-group of Akkaraman, Malya, Karacabey Merino sheep with HG > 65 cm, was found heavier in CCW than Node 3 identified as a sub-group of Akkaraman, Malya, Karacabey Merino sheep with HG < 65 cm (Adj-P=0.008, F=13.549, df1=1, df2=25). The tree-based CHAID diagram displayed that the difference in CCW between Nodes 3 and 4 (17.772 vs. 19.353 kg) was significant (Adj-P=0.008, F=13.549, df1=1, df2=25) and the cut-off value of 65 cm in HG was obtained for CCW. The cut-off value might be important for breeding strategies under Konya condition of Turkey. In terms of BW, Node 2 (being a sub-group of all the Dağlıç and Kıvırcık sheep in the study) was split into 2 new child Nodes 5 and 6, respectively. Depicted as a sub-group of Dağlıç and Kıvırcık sheep with BW < 19.90 kg, Node 5 had the average CCW of 15.188 (S=1.073) kg. Average CCW for the sub-group of Dağlıç and Kıvırcık sheep with BW > 19.90 kg, also labeled as Node 6, was 17.111 (S=1.140) kg. The statistically significant difference was meaningfully seen in CCW between Nodes 5 and 6 (Adj-P=0.010, F=15.096, df1=2 and df2=18). The cut-off value of 19.900 kg in BW might help ones improve the superior sheep of both breeds in CCW.
Figure 1 showed that the heaviest CCW was obtained with the sub-group of Akkaraman, Malya, and Karacabey Merino sheep with HG > 65 cm. But, scanty information pertaining to CCW estimation via data mining algorithms is presented in literature.
Model II (BW estimation)
Results of goodness of fit criteria of three data mining algorithms for Model II are given briefly in Table II. It was understood from Table II that we need to use more animals and more decisive independent variables for improving goodness of fit criteria. But, limited numbers of animals were assessed in carcass quality studies.
Table II.- Performance results of goodness of fit criteria for data mining algorithms for BW trait.
| Algorithm |
r |
SD ratio |
CV % |
R2 (%) |
Adj-R2 (%) |
RAE |
RMSE |
|
CHAID |
0.805 |
0.594 |
5.940 |
64.8 |
63.2 |
0.058 |
1.181 |
|
Ex. CHAID |
0.787 |
0.616 |
6.168 |
62.0 |
61.2 |
0.061 |
1.226 |
|
CART |
0.754 |
0.657 |
6.572 |
56.9 |
54.9 |
0.065 |
1.306 |
For the best algorithm selection, smaller is better in SD ratio, CV(%), RAE, and RMSE, respectively, but greater is better in r, R2 and Adj. R2, respectively. Results of the goodness of fit criteria displayed that CHAID was the decision tree algorithm submitting better fitting performance in BW trait when compared with exhaustive CHAID and CART algorithms for minimum number of animals designated as 8:4 in parent and child nodes. Correspondingly, the biological advantage of CHAID algorithms in the estimation of BW was also highlighted (Mohammad et al., 2012; Khan et al., 2014; Ali et al., 2015). With this reason, a decision tree which was constructed based on CHAID algorithm is depicted in Figure 2.
With Figure 2, the predominant scale variable extensively affecting BW was depicted to be HG (F=31.370, df1=2, df2=44, Adj- P=0.000). As HG increased, the increment in BW would be expected according to Figure 2. Nodes 1 and 3 were terminal nodes. Among scale characteristics, HG and BL factor explained 64.8 %R2 and 63.2 % Adj-R2 of total variation existing in BW. BL was a scale variable that was of the second-degree significance for BW (Adj- P=0.025, F=10.043, df1=1, df2=19).
The overall BW average of 20.094 (S=2.011) kg was estimated at the crest of regression tree diagram. At starting step of the tree-based analysis, Node 0 was branched into three new child nodes (Nodes 1, 2 and 3) in HG, respectively. The sub-group of the lambs with HG<60 cm, Node 1, possessed the average BW of 16.960 kg (S=1.260). Node 2 was the sub-group of the lambs with 60<HG<65 cm regardless of breed factor with the average BW of 19.329 kg (S=1.269) and the average BW of 21.605 kg (S=1.380) happened for Node 3, the lambs with HG >65 cm.
In terms of BL, Node 2 (being a sub-group of the lambs with the 60<HG<65) was split into two new child Nodes 4 and 5, respectively. Node 4 was described in Figure 2 as a sub-group of the lambs with 60<HG<65 and BL < 46 cm with the average BW of 18.400 (S=1.073) kg. The lambs with BL > 46 cm and 60<HG<65 cm were clustered in Node 5 which generated the BW average of 19.900 (S=1.003) kg. The difference between Nodes 4 and 5 was meaningfully reported (18.400 vs. 19.900 kg) in BW (Adj-P=0.025, F=10.043, df1=1 and df2=19). The lambs with 60<HG<65 cm might be considered to be associated with BL trait for sheep breeding.
As also highlighted by many authors in introduction section, a sustained interest is available for BW estimation using morphological characteristics through simple ormultiple linear regression analysis, factor analysis or principle component analysis scores in multiple linear regression analysis (Khan et al., 2014). Grzesiak and Zaborski (2012) substantially contributed to literature on the use of data mining methods in animal breeding. Comparing four data mining algorithms, Ali et al. (2015) introduced goodness of fit criteria for the BW estimation through some morphological traits. Whereas, very limited knowledge on implementing tree-based data mining algorithms is existent for BW estimation (Yakubu, 2012; Mohammad et al., 2012; Khan et al., 2014; Ali et al., 2015) and CCW estimation procedures. According to the results of regression tree method applied by Mohammad et al. (2012), CG, WH, BL, and breed were significant variables for yearling indigenous five sheep with the explained variability of 72 (%) in yearling BW, which was not in line with those declared in the present survey in Figure 2, due to the variability in age, breed, and environmental conditions. Yakubu (2012) estimated the BW through CART algorithm from nine morphological characteristics (withers height (WH), rump height (RH), body length (BL), face length (FL), rump length (RL), chest circumference (CC), head width (HW), shoulder width (SW) and rump width (RW)) for 492 Uda rams with the predictive accuracy of 61.8 (%) R2, and found that CC and FL traits were significant. Estimating BW from morphological traits (body length (BL), withers height (WH), chest girth (CG), paunch girth (PG), face length (FL), length between ears (LBE), length of ears (EARL), width (FTW) and length (FTL) of tail, and sex factor in 757 Harnai sheep at very different ages, Khan et al. (2014) reported that, with the application of tree-based Exhaustive CHAID algorithm, FL, WH, CG, and BL traits explained with the high predictive accuracy, 84.4% of the variability in BW. For the restricted part of the data used in Khan et al. (2014), Ali et al. (2015) comparatively examined predictive capabilities of CART, CHAID, Exhaustive CHAID and Artificial Neural Network (Multilayer Perceptron) in the BW estimation at post weaning period (6 to 9 mo) from several morphological traits (body length (BL), withers height (WH), chest girth (CG), paunch girth (PG), face length (FL), length between ears (LBE), length of ears (EARL), width (FTW) and length (FTL) of tail, and sex factor in Harnai sheep, and obtained a better performance for Exhaustive CHAID algorithm with the high predictive power of 84.210 %R2 and 83.805 %Adj-R2, respectively. Aksahan (2015) used CHAID algorithm to find linear body measurements affecting final live weight (FLW) at fattening period of 103 young (Holstein, Simmental, Brown Swiss and crossbreed) bulls in Bolvadin district of Afyon province of Turkey, and detected with the very high predictive accuracy of 87.82 % Adj R2 that the effect of CC, BL, BRH, and FP on FLW trait was significant (Adj. P<0.05) with the exception of withers height (WH), back height (BH), front rump height (FRH), back rump width (BRW), and chest dept (CD), respectively. The author also found that the heaviest FLW (545.850 kg) from the sub-group of the young bulls with CC > 190 cm was recorded, averagely. The differences were due to species, breed, age, environmental variation, and separate statistical methods, and different morphological traits measured.
In present work, there are several limitations that are small sample size, and number of morphological traits recorded under the available survey. Specified statistical methods (CART, CHAID, and Exhaustive CHAID) along with sheep breeds used in the study differed from previous studies regarding the estimation of BW and CW in literature, and are be able to be agreeable tools for alternative sheep breeding practices in the detection of morphological traits thought as indirect selection criteria so as to detect those having better characteristics in sheep population (Khan et al., 2014).
Conclusion
The present work is the first publication to compare predictive performance of CART, CHAID, and Exhaustive CHAID algorithms in the BW and CCW for five popular sheep breeds. It is very important for sheep breeders to cluster superior sheep resembling each other in the evaluated characteristics and to assert breed related standards and morphological traits associated positively with BW and CCW for sheep with the contribution of the data mining algorithms. To more effectively interpret BW and CCW and generalize the present outcomes, further works must be conducted on very large flocks or populations in much more different sheep breeds.
Statement of conflict of interest
Authors have declared no conflict of interest.
References
Akin, M., Eyduran, E. and Reed, B.M., 2016. Use of RSM and CHAID data mining algorithm for predicting mineral nutrition of hazelnut. Plt. Cell Tissue Organ Cult., 128: 303–316.
Akin, M., Eyduran, E. and Reed, B.M., 2017. Developing hazelnut tissue culture medium free of ion confounding. Plt. Cell Tissue Organ Cult. https://doi.org/10.1007/s11240-017-1238-zY.(SCI)
Aksahan, R., 2015. Determination of body measurements influencing final live weight via regression tree method in some cattle breeds. MS thesis. The Graduate School of Natural and Applied Science of Selcuk University, Konya, Turkey.
Ali, M., Eyduran, E., Tariq, M.M., Tirink, C., Abbas, F., Bajwa, M.A., Baloch, M.H., Nizamani, A.H., Waheed, A., Awan, M.A., Shah, S.H., Ahmad, Z. and Jan, S., 2015. Comparison of artificial neural network and decision tree algorithms used for predicting live weight at post weaning period from some biometrical characteristics in Harnai sheep. Pakistan J. Zool., 47: 1579-1585.
Berge, S., 1977. On the estimation of weight and increase in weight by means of the chest girth in Norwegian red cattle at the Agricultural University at As, Norway in the years 1972 and 1974. Acta Agric. Scand., 27: 65-66. https://doi.org/10.1080/00015127709435110
Buvanendran, V., Umoh J.E. and Abubakar, B.Y., 1980. An evaluation of body size as related to weight of three West African breeds of cattle in Nigeria. J. Agric. Sci. (Cambridge), 95: 219-224. https://doi.org/10.1017/S0021859600029476
Cam, M.A., Olfaz, M. and Soydan, E., 2010. Posibilities of using morphometrics characteristics as a tool for body weight production in Turkish hair goats (Kilkeci). Asian J. Anim. Vet. Adv., 5: 52-59. https://doi.org/10.3923/ajava.2010.52.59
Eyduran, E., Karakus, K., Keskin, S. and Cengiz, F., 2008. Determination of factors influencing birth weight using regression tree (RT) method. J. appl. Anim. Res., 34: 109-112. https://doi.org/10.1080/09712119.2008.9706952
Eyduran, E., Karakus, K., Karakus, S. and Cengiz, F., 2009. Usage of factor scores for determining relationships among body weight and some body measurements. Bulg. J. agric. Sci., 15: 373-377.
Eyduran, E., Zaborski, D., Waheed, A., Celik, S., Karadas, K., Grzesiak, W. 2017. Comparison of the predictive capabilities of several data mining algorithms and multiple linear regression in the prediction of body weight by means of body measurements in the indigenous beetal goat of Pakistan. Pakistan J. Zool., 49: 257-265.
Goonerwardene, L.A. and Sahaayuruban, P., 1983. Analysis of body measurements and prediction of body weight in crossbred Lanka bulls. Proc. 5th World Conf. Prod., 2: 27-28.
Grzesiak, W. and Zaborski, D., 2012. Examples of the use of data mining methods in animal breeding. ISBN 978-953-51-0720-0. https://doi.org/10.5772/50893
Jahan, I., Pan, N., Kersigo, J. and Fritzsch, B., 2013. Beyond generalized hair cells: molecular cues for hair cell types. Hearing Res., 297: 30-41. https://doi.org/10.1016/j.heares.2012.11.008
Karabacak, A., Keskin, I. and Dag, B., 2009. Investigation of relationships between body measurements taken at the onset of the fattening period and cold carcass weight in five different sheep breeds by path analysis. Turkish Sheep Husbandry Congress. 296-303, 12-13 February, İzmir, Turkey.
Koc, Y., Eyduran, E. and Akbulut, O. 2017. Application of regression tree method for different data from animal science. Pakistan J. Zool., 49: 599-607.
Khan, M.A., Tariq, M.M., Eyduran, E., Tatliyer, A., Rafeeq, M., Abbas, F., Rashid, N., Awan, M.A. and Javed, K., 2014. Estimating body weight from several body measurements in Harnai sheep without multicollinearity problem. J. Anim. Pl. Sci., 24: 120-126.
Kovalchuk, I.Y., Mukhitdinova, Z., Turdiyev, T., Madiyeva, G., Akin, M., Eyduran, E. and Reed, B.M., 2017. Modeling some mineral nutrient requirements for micropropagated wild apricot shoot cultures. Plt Cell Tissue Organ Cult. 129: 325–335.
Kunene, N.W., Nesamvuni, A.E. and Nsahlai, I.V., 2009. Determination of prediction equations for estimating body weight of Zulu (Nguni) sheep. Small Rum. Res., 84: 41-46. https://doi.org/10.1016/j.smallrumres.2009.05.003
Mohammad, M.T., Rafeeq, M., Bajwa, M.A., Awan, M.A., Abbas, F., Waheed, A., Bukhari, F.A. and Akhtar, P., 2012. Prediction of body weight from body measurements using regression tree (RT) method for indigenous sheep breeds in Balochistan, Pakistan. J. Anim. Pl. Sci., 22: 20-24.
Topal M., Yildiz, N. Esenbuga, N., Aksakal, V., Macit, M. and Ozdemir, M., 2003. Determination of best fitted regression model for estimation of body weight in Awassi sheep. J. appl. Anim. Res., 23: 201-208. https://doi.org/10.1080/09712119.2003.9706422
Topal, M. and Macit, M., 2004. Prediction of body weight from body measurements in Morkaraman sheep. J. appl. Anim. Res., 25: 97-100. https://doi.org/10.1080/09712119.2004.9706484
Yakubu, A., 2012. Application of regression tree methodology in predicting the body weight of Uda sheep. Anim. Sci. Biotech., 45: 484-490.
Younas, U., Abdullah, M., Bhatti, J.A., Pasha, T.N., Ahmad, N., Nasir, M. and Hussain, A., 2013. Interrelationship of body weight with linear body measurements in Hissardale sheep at different stages of life. J. Anim. Pl. Sci., 23: 40-44.


