

Environmental Determinants of Zooplankton Community in the Damietta Estuary of the Nile River, Egypt


Environmental Determinants of Zooplankton Community in the Damietta Estuary of the Nile River, Egypt
Wael S. El-Tohamy1,*, Russell R. Hopcroft2 and Nagwa E.M. Abdel Aziz3
1Zoology Department, Faculty of Science, Damietta University, Egypt
2Institute of Marine Science, University of Alaska Fairbanks, AK, USA
3National Institute of Oceanography and Fisheries, Alexandria, Egypt
ABSTRACT
Zooplankton community and eleven environmental variables were investigated seasonally during 2014 through nine stations in the Damietta estuary of the Nile River. Meroplanktonic larvae were the major component representing 39.4% of the total zooplankton abundance. Copepods and their larval stages contributed 36.2%. Rotifers ranked the third important group (12.6%). Protozoa contributed 10.6% of the total community. According to the Canonical Correspondence Analysis (CCA), the variations in the species data were significantly (P< 0.05) related to salinity, temperature, phosphate concentration and phytoplankton biomass. The main spatial gradients along the estuary were associated with salinity. The high salinity zone in the estuary downstream was dominated by the calanoid paracalanidae and the harpacticoid Euterpina acutifrons. In the lower salinity transects, the tintinnid Favella serrata dominated the estuary midstream, together with several rotifer species in the estuary upstream. The juvenile copepods and the cyclopoid Oithona spp. together with the numerically dominant polychaete and cirriped larvae seemed little affected by salinity gradients.
Article Information
Received 23 August 2016
Revised 25 March 2017
Accepted 25 December 2017
Available online 03 August 2018
Authors’ Contribution
WSE-T designed the study, drafted the main text and prepared figures. RRH helped in the manuscript preparation and editing. WSE-T and NEMAA did field investigations and sampling .
Key words
Zooplankton community, Environmental variables, Damietta estuary, Nile River, Salinity gradients.
DOI: http://dx.doi.org/10.17582/journal.pjz/2018.50.5.1785.1798
* Corresponding author: waelsalah@du.edu.eg
0030-9923/2018/0005-1785 $ 9.00/0
Copyright 2018 Zoological Society of Pakistan
Introduction
The ecological importance of estuaries arises from being a habitat where freshwater and marine organisms exist together and can tolerate a wide range of salinity variations. Such areas are usually rich in the elements essential for the growth of primary producers, which directly or indirectly attract organisms from higher trophic levels. Estuaries also serve as important nursery areas for many economic fish and shellfish species (Park and Marshall, 2000; Janakiraman et al., 2013; Champalbert et al., 2014). The estuarine and brackish-water biotas represent a unique setting for intimate collaboration between the fresh water biologists and oceanographers (Little, 2000). The Damietta estuary is a shallow temperate estuary on the Egyptian Mediterranean coast that provides critical habitat for fish and migrating birds (Hamza, 2006). This estuary ecosystem is subjected to direct or indirect human effects related to intensive agriculture, increasing industrial activities, maritime activities, and pollution (Saad and Abdel-Moati, 1984), all of which, in a particular, affect most of the estuary parts.
Spatiotemporal variations and habitat types are among the most important factors affecting patterns of species abundance and composition of estuarine plankton (Marques et al., 2006). The relation between distribution of zooplankton and environmental variables has been studied in several estuaries, and frequently salinity and temperature have been shown to be the most important parameters affecting the distribution and abundance of estuarine zooplankton (Graham and Bollens, 2010; Bollens et al., 2011). The continuous mixing processes in estuaries cause changes in the environmental conditions particularly salinity, while temperature changes are usually driven by weather and climate (Costello et al., 2006; Allen et al., 2008; Winder and Jassby, 2011; Champalbert et al., 2014). Horizontal gradients of salinity affect the spatial distribution of estuarine zooplankton and the species distribution is almost determined according to salinity tolerance (Lawrence et al., 2004).
The seasonal changes and the input of fresh and marine play a large role in the structuring of estuarine communities (Kimmel et al., 2009). The Damietta estuary is now isolated from the Damietta branch of the Nile River by tight and permanent closure of the Faraskour′s Dam, such that no river water is any longer released to the estuary. The estuary is now filled with Mediterranean seawater mixed with irrigation water and water effluents from Manzalla Lake that allow it to maintain its estuarine status (Cameron and Pritchard, 1963).
Currently, no studies have examined the zooplankton community in the Damietta estuary. For this reason, the current status of Damietta estuary, its plankton community, and the mechanisms affecting their dynamics are important to understand. This study examined the zooplankton community of Damietta estuary with two objectives. The first was to measure the composition, distribution, and abundance of zooplankton in the estuary. The second objective was to correlate community variations to physicochemical parameters including chlorophyll a concentration.
Materials and methods
Study area
The Nile River flows from Tanganyika Lake in Tanzania (4° S) to the Mediterranean Sea (31°31’N) over a distance of 6625 km (Khedr, 1998). About 23 km North of Cairo, the river bifurcates into two branches, the Rosetta and the Damietta. In 1989, Damietta branch was blocked by a permanent earth dam at the south of Damietta city, known as Faraskour Dam (Fig. 1); forming a completely isolated area of the Nile called the Damietta estuary. It’s a long stretch of water with an average length of about 13 km. The estuary is connected to the Damietta harbor by a navigational canal (Barge canal, 4.5 km long). Thus the water properties in the estuary are mainly controlled by the land runoff and by the tidal regime. Generally, the freshwater flows mainly due to the irrigation water and water effluents from Manzalla Lake which are relatively low when compared with the volume of seawater entering the estuary.
Samples collection and analysis
Zooplankton samples were collected seasonally during 2014, with surface water samples collected concurrently for the measurement of environmental parameters. The collection of samples was carried out at a fixed daytime (9.00-9.30am), at nine stations to represent the salinity gradients (Fig. 1), each with different anthropogenic influences (Table I).
Chlorophyll a and hydrographic parameters (temperature, salinity, transparency, dissolved oxygen , pH) and nutrients (PO4, NO3, NO2, NH4 and SiO3) were measured. The surface water temperature was measured to the nearest 0.5 °C with a mercury thermometer, and salinity to the nearest part per thousand with a refractometer. Water transparency was estimated by a standard secchi disc (25 cm in diameter) and pH with a digital pH meter. Dissolved oxygen, nutrients and phytoplankton biomass (chlorophyll a) were determined according to the methods described by Strickland and Parsons (1972).
Zooplankton collections were taken using a 54-µm mesh plankton ring-net of 45 cm mouth diameter hauled vertically slowly from the bottom to the surface at each station. Samples were preserved in 5% formalin. Zooplankton samples were identified to species using a combination of Rose (1933), Edmondson (1959), Marshall (1969), Cosper (1972), Newell and Newell (1979), Nishida (1985), and Boltovskoy (1999). Abundance was determined from the average counts of three aliquots of 5ml and expressed in number/ m3.
Statistical analysis
For zooplankton samples, the dominance of species was calculated according to Zhao and Zhou (1984). One-way ANOVA with Tukey’s-b test was employed to test the spatial and temporal differences between the environmental variables. Simple correlations were determined to define the relationship between some selected parameters . The data were tested for normality prior to analysis, and transformed to natural logarithms where necessary to satisfy the homogeneity of variances and normality of analysis. ANOVA and Correlations were performed using SPSS 18.
Hierarchical and non-metric Multidimensional Scaling (MDs) analysis of similarity between stations were computed on the basis of the Bay-Curtis similarity index. Stations groups were statistically identified and groupings were subjected to SIMPER (similarity percentages) routine to identify species contributing to similarity within and differences between groups [CAP v3.0 (Seaby et al., 2004)].
Table I.- Description of the sampling stations in the Damietta Estuary of the Nile River.
|
Stations |
Names |
Descriptions |
Position |
|
I |
Al Boghaz |
At the mouth of the estuary. -Average depth: 4.3m |
Lat. 31°31′.62N, Long. 31°50′.74E |
|
II |
Al Sohpara Canal |
At the canal front, receives water effluents from Manzalla Lake. -Average depth: 3.5m |
Lat. 31°31′.196N, Long. 31°50′.517E |
|
III |
Izbat Al Burj |
-Housing estate (point source of industrial and domestic discharge). - Maritime activities of the fisheries fleet -Average depth: 3.5m |
Lat. 31°30′.43N, Long. 31°50′.15E |
|
IV |
El Gerbe Ras El Bar |
-Housing estate. - Maritime activities of the fisheries fleet. -Average depth: 3.9m |
Lat. 31°29′.55N, Long. 31°49′.56E |
|
V |
El Sheikh Dorgham |
- Housing estate and Agricultural wastes. - Maritime activities of the fisheries fleet. -Average depth: 4.63m |
Lat. 31°29′.11N, Long. 31°49′.39E |
|
VI |
El Ratma Canal |
-Housing estate and Agricultural wastes. - At the front of the Ratma Canal, receives water effluents from Manzalla Lake. -Average depth: 5.5m |
Lat. 31°28′.34N, Long. 31°49′.39E |
|
VII |
Izbt Tabl |
- Housing estate and Agricultural wastes. -Average depth: 5.8m |
Lat. 31°27′.56N, Long. 31°49′.18E |
|
VIII |
Damietta Harbor Barge Canal |
At the front of the Barge canal and in addition to house estate and agricultural wastes, this site receives wastes of the Damietta port -Average depth: 5.3m |
Lat. 31°27′.32N, Long. 31°48′.9E |
|
IX |
Damietta City |
-Housing estate. -Average depth: 4.3m |
Lat. 31°26′.29N, Long. 31°48′E |
Lat., Latitude; Long., Longitude.
Table II.- Seasonal variations and average values of different physico-chemical parameters and chlorophyll a. Different letters denote significant differences between values based on One Way ANOVA with Tuckey’s-b test where a>b.
|
Win |
Spr |
Sum |
Aut |
ANOVA |
||
|
F |
P |
|||||
|
Temp (°C) |
17.02c |
20.7 b |
27.1 a |
21.6 b |
60.7 |
<0.001 |
|
Tran (cm) |
139a,b |
195.4 a |
140.1a,b |
110.2 b |
3.21 |
<0.05 |
|
Salinity (PSU) |
32.9 |
33.6 |
35.8 |
33.7 |
0.78 |
0.423 |
|
pH |
8.1b |
8 b |
8.3a |
8.1b |
2.99 |
<0.05 |
|
DO (mgl-1) |
8 |
7.9 |
7.7 |
8.2 |
1.11 |
0.214 |
|
NO3 (μml-1) |
0.61 |
0.86 |
1.12 |
0.91 |
1.15 |
0.208 |
|
NO2 (μml-1) |
0.37 |
0.42 |
0.56 |
0.33 |
0.82 |
0.483 |
|
NH4 (μml-1) |
3.42 |
10.6 |
13.1 |
12.61 |
0.461 |
0.721 |
|
PO4 (μml-1) |
0.02b |
0.01b |
0.13a |
0.013b |
17.5 |
<0.001 |
|
SiO3 (μml-1) |
1.8 |
2.26 |
9.87 |
10.45 |
1.75 |
0.18 |
|
Chlorophyll a (μgl-1) |
12.32 |
19.1 |
20.1 |
17.6 |
1.047 |
0.385 |
Tran, transparency; Win, winter; Spr, spring; Sum, summer, Aut, autumn.
Canonical Correspondence Analysis (CCA) was performed to assess the association of zooplankton species with environmental factors. A Monte Carlo test was used to evaluate the significance of canonical axes and the environmental variables by using 999 unrestricted permutations (Sousa et al., 2008). Software package CANOCO version 4.5 was used for both PCA and CCA analyses.
To examine the relationship between zooplankton community structure and the environmental variables, abundance-weighted averaging was used to calculate taxon-specific optima along gradients of chlorophyll a and salinity (Ter Braak and Smilauer, 1998). Calculations of weighted average optima (WAopt) of zooplankton taxa were carried out using the following equation:
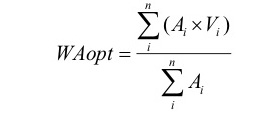
Where, Ai is the taxon’s abundance in sample i, Vi is the abundance/concentration of the environmental variable in sample i and n the number of samples.
Table III.- The average values of different physico-chemical parameters and chlorophyll a at the sampled stations. Different letters denote significant differences between values based on One Way ANOVA with Tuckey’s-b test where a>b>c>d.
|
I |
II |
III |
IV |
V |
VI |
VII |
VIII |
IX |
ANOVA |
||
|
F |
P |
||||||||||
|
Temperat-ure (°C) |
20.5 |
20.9 |
21 |
21.8 |
21.7 |
22.1 |
21.9 |
22.4 |
22.3 |
0.336 |
0.944 |
|
Transpare-ncy (cm) |
160.5 |
91 |
130.5 |
118.8 |
150 |
130.5 |
137.5 |
221.8 |
130.5 |
1.171 |
0.352 |
|
Salinity (PSU) |
38.8 a |
36.9a,b |
36.7a,b |
34.5b,c |
34.5b,c |
33.9b,c |
32.6c |
29.5 d |
29d |
20.47 |
<0.01 |
|
pH |
8.1 |
8.1 |
8.2 |
8.3 |
8.3 |
8.3 |
8.3 |
8.4 |
8.3 |
2.187 |
0.061 |
|
DO (mgl-1) |
6.3 c |
6.2 c |
6.5 c |
9.5 a,b |
9.7 a,b |
9.2 a,b |
8.7 a,b |
10.1 a |
10.1 a |
3.848 |
0.002 |
|
NO3 (μml-1) |
1.1 a,b |
0.74 a,b |
0.66a,b |
0.28 b |
0.52 a,b |
0.45 a,b |
1±0.94a,b |
3.83 a |
0.25 b |
2.66 |
0.026 |
|
NO2 (μml-1) |
0.3 b |
0.55 a,b |
0.33b |
0.08 c |
0.35 b |
0.36 b |
0.062 b |
1.88 a |
0.06 b |
3.62 |
0.006 |
|
NH4 (μml-1) |
10.23 a,b |
61.6a |
7.22b |
0.064 c |
2.1 b |
1.47b,c |
0.6b,c |
1.5b,c |
2.2b,c |
7.91 |
<0.01 |
|
PO4 (μml-1) |
10.23 |
0.07 |
0.014 |
0.03 |
0.03 |
0.044 |
0.041 |
0.048 |
0.06 |
0.25 |
0.977 |
|
SiO3 (μml-1) |
10.23 |
20.09 |
6.55 |
1.77 |
3.05 |
2.42 |
3.79 |
6.22 |
5.75 |
1.512 |
0.179 |
|
Chlorophyll a (μgl-1) |
10.23a,b |
10.8a,b |
19.8 a,b |
23.6 a,b |
19 a,b |
29.1 a |
13a,b |
9.2 a,b |
13.5a,b |
2.589 |
0.019 |
Results
Environmental variables
Estuaries are characterized by their environmental gradients, both temporally and spatially. Salinity showed the most noticeable spatial gradient in the Damietta estuary with a trend of decreasing toward the estuary upstream. Surface water temperatures (Table II) showed temporal variations between the minimum in winter (17.02°C) and the maximum in summer (27.1°C), but little difference between stations was noticed (Table III). Secchi disk transparency (SDT) varied significantly between seasons with values ranging between 110 cm in autumn and 195 cm in winter. Surface dissolved oxygen ranged from oversaturation at stations form IV to IX to considerably lower levels toward the estuary downstream. The pH displayed a little variation, with an average between 8.1 and 8.4 at the different stations (Table III). Nutrients (NO3, NO2, NH4, PO4, and SiO3) concentrations were generally high, consistent with the pronounced eutrophication of Damietta Estuary. ANOVA and statistical test (Tukey’s-b test) on nutrients concentration by seasons showed only significant differences in phosphate concentrations, with considerably higher value in summer versus the other seasons (Table II). Spatially, there were negligible differences in phosphate concentrations except at station 1 which showed the highest values. The concentrations of NO3 showed spatial significant differences, while NO2 was the highest at station VIII and the lowest at stations IV and IX. Also, ammonia concentrations were considerably higher at stations I and II versus the other stations (Table III). Silicate concentrations ranged from lowest values at station IV to the highest at station II. The high nutrient levels promoted the intensive growth of phytoplankton (always > 2 µg l-1), causing acute level of eutrophication along the estuary indicate the large influence of freshwater discharge in this region. Chlorophyll a demonstrated clear differences between the sampled stations, with the markedly high value (29.1 µg l-1) at station VI to much lower value (9.2 µg l-1) at station VIII; however temporal variations were not significant.
Zooplankton composition and abundance
In total, 61 holoplankton taxa belonging to 7 categories: Protozoa, Cnidaria, Rotifera, Crustacea (Copepoda, Cladocera, Ostracoda, Amphipoda and Mysidacea), Chaetognatha, Mollusca, Larvacea, and 8 different types of meroplankton were also recorded (Table IV). The highest diversified communities (34 taxa) were reported at station V in autumn, while the lowest (10 taxa) occurred at station IX in summer (Fig. 2). Total zooplankton abundance averaged over all stations varied from < 1.5×10³ individual m-3 in winter at the stations VII, VIII, and IX, to > 15×103 individual m-3 in spring at the station VI (Fig. 2). The meroplanktonic larvae dominated the community structure, representing > 39% of the total abundance. Dominant taxa were the larvae of Annelida and Cirripedia. Crustaceans were the most abundant component among the holoplankton, representing > 36 % and 39 % of the total abundance and species richness respectively. Copepods were the dominant organisms (17 taxa, mean abundance 1975 individual m-3). The three major orders of planktonic copepods (calanoida, cyclopoida and harpacticoida) demonstrated different roles along the estuary. Although all three orders of copepods had similar diversity, cyclopoida numerical density was considerably higher (Table IV). Rotifers were the third important group, comprising 6 species and contributed 13.37% of the total abundance. Although, there was high diversity of protozoans (26 taxa), they contributed only 10.55 % of the total abundance. They were represented by three groups; Tintinnids, non-Tintinnid ciliates and Foraminifera. Tintinnids were the most diversified groups (14 species), followed by non-Tintinnid ciliates (8 species) and Foraminifera (4 species). Other occurring taxa included Cnidaria, Cladocera, Ostracoda, Amphipoda, Mysidacea, Pteropoda, Larvacea, and Chaetognatha were represented by a small number of species (Table IV), contributed collectively 19.68% and about 1% of the species richness and total abundance, respectively.
Table IV.- Zooplankton species, richness, and average abundance (Ind.m-3) of each category.
|
Category |
Species |
Mean Abundance |
|||
|
Number |
% |
Ind.m-3 |
% |
||
|
Protozoa |
Foraminiferida |
4 |
6.56 |
3.99 |
0.07 |
|
Non Tintinnid ciliates |
8 |
13.11 |
32.22 |
0.59 |
|
|
Tintinnida |
14 |
22.95 |
542.37 |
9.89 |
|
|
Cnidaria |
1 |
1.64 |
1.67 |
0.03 |
|
|
Rotifera |
6 |
9.84 |
733 |
13.37 |
|
|
Crustacea |
Cladocera |
3 |
4.92 |
6.66 |
0.12 |
|
Ostracoda |
1 |
1.64 |
3.03 |
0.06 |
|
|
Copepod calanoida |
5 |
8.20 |
136.47 |
2.49 |
|
|
Copepod cyclopoida |
5 |
8.20 |
414.03 |
7.55 |
|
|
Copepod harpacticoida |
7 |
11.48 |
122.14 |
2.23 |
|
|
Copepod nauplii |
- |
- |
403.3 |
7.35 |
|
|
Copepod copepodites |
- |
- |
899.23 |
16.40 |
|
|
Amphipoda |
1 |
1.64 |
0.11 |
<0.01 |
|
|
Mysidacea |
2 |
3.28 |
0.34 |
<0.01 |
|
|
Chaetognatha |
1 |
1.64 |
6.87 |
0.13 |
|
|
Mollusca |
1 |
1.64 |
31.5 |
0.57 |
|
|
Larvacea |
2 |
3.28 |
8.99 |
0.16 |
|
|
Meroplankton |
Medusa of Obelia spp. |
- |
- |
138.62 |
2.53 |
|
Polychaeta larvae |
- |
- |
1134.3 |
20.68 |
|
|
Cirripeda larvae |
- |
- |
825 |
15.04 |
|
|
Decapoda larvae |
- |
- |
6.04 |
0.11 |
|
|
Molluscs lamellibranch veligers |
- |
- |
27.76 |
0.51 |
|
|
Ascidiacea larvae |
- |
- |
0.028 |
<0.01 |
|
|
Crustacea eggs |
- |
- |
5.79 |
0.11 |
|
|
Fish eggs and larvae |
- |
- |
0.58 |
<0.01 |
|
Community structure
All the recorded taxa were used for multivariate analysis. Results of hierarchical cluster analysis and multi-dimensional scaling are shown in Figure 3A and B. The cluster analysis and two-dimensional MDS plots divided the stations into three sectors (A, B, and C). The relative position of some stations within each sector reflects similarities in species composition among stations and also shows the anthropogenic influences. Sector A occupied the lower estuary stations (I, II, and III) and was influenced largely by seawater intrusion. Stations belonging to sector B were found in the middle region of the estuary and include most of sampling events from stations IV, V, VI, and VII. This sector being affected by maritime activities of the fisheries fleet and land runoff from the surrounding villages and Manzalla lake. Sector C at the upper estuary includes station VIII and IX; being affected directly by domestic and agricultural wastes. Mean zooplankton abundance in sector A was higher than the other 2 sectors (Table V).
Table V.- zooplankton abundance (ind.m-3) at different sectors.
|
Sector |
Mean abundance |
Standard deviation |
|
A |
6211.8 |
3050.2 |
|
B |
5897.4 |
5996.8 |
|
C |
3439.4 |
4538.6 |
According to the analysis of similarity (SIMPER), the mean densities and occurrence frequencies of the taxa that contributed ≥ 1% within sector similarity or between sector dissimilarity are summarized in Table VI. The listed taxa accounted more than 67% of within-group similarity across the three sectors. Some widely distributed taxa dominated the zooplankton community in the three sectors, such as polychaete larvae, cirriped larvae, the larval stages of copepods, and the copepod Oithona spp. The other taxa demonstrated different roles along the estuary. The copepod Euterpina acutifrons and the species of Paracalanidae dominated the community at the estuary downstream. The tintinnid Favella serrata dominated the estuary midstream, together with the rotifer Synchaeta okai, and Synchaeta pectinata was the only species that dominated the community in the estuary upstream (Table VI). Note: a large number of species (e.g. Leprotintinnus nordgvistii , Acartia clausi, Mesochra rapiens, Microsetella norvegica, Cypridina mediterrianea, Sagitta friderici, Medusa of Obelia spp., and Molluscs Lamellibranch veligers) were recorded in high frequencies at sector A. Overall, the estuary midstream and upstream supported the highest densities of protozoans, rotifers, and most meroplanktonic larvae, whereas the estuary downstream supported the highest densities of copepods, cladocerans, ostracods, molluscs, chaetognths, and larvaceans.
Table VI.- Mean abundance (ind. m-3) and Frequency of occurrence (%) averaged across all sectors by station grouping of those species/taxa that contributed ≥ 1% to within-group similarity or between-group dissimilarity. The values with asterisk indicate the dominancy.
|
Taxa |
Abb. |
Sector A Stations I, II and III |
Sector B Stations IV, V, VI and VIII |
Sector C Stations VIII and IX |
WAopt |
|
|
Chl a (µgl-1) |
Salinity (gl-1) |
|||||
|
Polychaeta larvae |
Plar |
954.6 (100)* |
1157.6(100)* |
1357.4 (100)* |
16.4 |
33.6 |
|
Cirripeda larvae |
Crlar |
364.5 (100)* |
1118.3(100)* |
929.4 (100)* |
16 |
33.5 |
|
Copepodite stages |
Cstag |
1899.5 (100)* |
493.1 (100)* |
211.1 (100)* |
14.2 |
36.6 |
|
Nauplii |
Nlar |
771.8 (100)* |
245.8 (100)* |
165.7 (100) |
14 |
36.1 |
|
Synchaeta pectinata (Ehrenberg) |
Spec |
215.8 (25) |
912.2 (100)* |
304.8 (100)* |
16.5 |
33.9 |
|
Oithona spp. |
Oisp |
868.3(100)* |
241.5(100)* |
201 (100)* |
16 |
36.9 |
|
Paracalanidae |
Para |
291.12 (100)* |
57.7 (56.25) |
20.7 (25) |
9.1 |
37.83 |
|
Medusa of Obelia spp. |
Mobe |
137.4 (100) |
203 (100) |
11.7 (87.5) |
18.6 |
34.8 |
|
Euterpina acutifrons (Dana) |
Eacu |
254.6 (100)* |
21.4 (100) |
24.5 (87.5) |
11.6 |
36.9 |
|
Lamellibranch veligers |
Lbve |
50.9 (83.3) |
14 (87.5) |
21 (87.5) |
11.3 |
35.7 |
|
Synchaeta okai (Sudzuki) |
Soka |
16.2 (41.7) |
246.3 (93.8)* |
61.4 (62.5) |
20.4 |
33.4 |
|
Favella ehrenbergii (Claparéde and Laachmann) |
Fehr |
4.8 (16.7 ) |
192.2 (50) |
106.5 (75) |
17.5 |
33.6 |
|
Decapoda larvae |
Delar |
8.3 (83.3) |
4.8 (37.5) |
5.2 (62.5) |
14.2 |
36.1 |
|
Acartia clausi (Giesbrecht) |
Acla |
27.04 (75) |
9.2 (87.5) |
2.8 (62.5) |
14.4 |
35.2 |
|
Synchaeta oblonga (Ehrenberg) |
Sobl |
4 (8.3) |
80.2 (56.3) |
43.7 (62.5) |
23.1 |
33.7 |
|
Paramecium sp. |
Pasp |
1.9 (16.7) |
11.64 (25) |
37.7 (12.5) |
20.9 |
31.9 |
|
Tintinnopsis campanula (Ehrenberg) |
Tcom |
9.2 (41.7) |
10.3 (43.8) |
2.4 (12.5) |
18.4 |
35.3 |
|
Acartia discaudata (Giesbrecht) |
Adis |
4.4 (33.3) |
13.4 (75) |
3.4 (50) |
15.7 |
34.4 |
|
Oikopleura dioica (Fol) |
Odio |
16.7 (66.7) |
1 (18.8) |
10.7 (25) |
9.6 |
36.9 |
|
Halicyclops magniceps (Lilljeborg) |
Hmag |
5.1 (25) |
2.1 (50) |
4.2 (50) |
11.5 |
32.5 |
|
Nitokra lacustris lacustris (Schmankevich) |
Nlac |
1.3 (16.7) |
7.36 (56.3) |
7.34 (75) |
17 |
32.8 |
|
Podon intermedius (Lilljeborg) |
Pinte |
14.8 (50) |
2 (31.3) |
2.5 (12.5) |
9.6 |
36.9 |
|
Synchaeta stylata (Wierzejski) |
Ssty |
154.9 (68.8) |
65.8 (37.5) |
18.9 |
32.2 |
|
|
Cypridina mediterrianea (Claus) |
Cmed |
6.1 (83.3) |
1.7 (56.3) |
1.1 (37.5) |
13.8 |
35.8 |
|
Mesochra rapiens (Schmeil) |
Mrap |
9.7 (68.8) |
8.8 (87.5) |
16.6 |
32.8 |
|
|
Leprotintinnus nordqvistii (Brandt) |
Lnor |
138.6 (100) |
0.3 (6.3) |
4.9 (12.5) |
5.5 |
38.4 |
|
Sagitta friderici (Ritter.Zàhon) |
Sfri |
18.7 (91) |
5.4 (43.8) |
1 (25) |
14.3 |
37.1 |
|
Acanthocyclops americanus (Marsh) |
Aamer |
16.8 (50) |
15.3 (56.3) |
21.4 |
32.1 |
|
Table VII.- Monte Carlo test with 999 permutations for the selection of environmental parameters.
|
Variables |
Variance explained |
F-ratio |
P-value |
|
Salinity |
0.23 |
6.42 |
0.001 |
|
Temperature |
0.13 |
4.01 |
0.001 |
|
PO4 |
0.09 |
2.32 |
0.01 |
|
Chlorophyll a |
0.08 |
1.93 |
0.046 |
|
Dissolved oxygen |
0.04 |
1.35 |
0.216 |
|
pH |
0.04 |
1.32 |
0.207 |
|
NH4 |
0.03 |
1.09 |
0.329 |
|
SiO3 |
0.03 |
1.19 |
0.294 |
|
NO2 |
0.02 |
0.78 |
0.619 |
|
Sechi disk transparency |
0.02 |
0.58 |
0.795 |
|
NO3 |
0.01 |
0.48 |
0.87 |
Linkage between zooplankton community and environmental variables
The Canonical Correspondence Analysis (CCA) ordination indicates that environmental parameters had significant influences on zooplankton species distribution (P< 0.05; Monte Carlo test), explaining 79.3 % of the total variance. Of the tested environmental variables, Monte Carlo permutations showed, in descending order, salinity (explained alone 23% of the variance), temperature, phosphate, and chlorophyll a had the major significant influences on the distribution of zooplankton species (Table VII). CCA ordination diagram for the two most important ordination axes (Fig. 4) showed the pattern of the variations in the community composition, which can be explained by the environmental variables, and also showed the distribution patterns of the species along each environmental gradient. From this, it can be inferred that salinity is the major factor that controlled the species distribution along the estuary. Sampling events from stations I, II, and III at the estuary downstream were positively correlated with salinity and distributed in the right hand side of the biplot. Meanwhile, most of sampling events from the other stations were negatively correlated with salinity and grouped in the left hand side of the biplot. Traditionally low salinity taxa (non tintinnid ciliates, rotifers, majority of freshwater copepods like the cyclopoid Acanthocyclops americanus and the harpacticoids Mesochra rapiens and Nitokra lacustris lacustris) and Favella spp. were mainly associated with the lowest values of salinity and the gradients of pH, temperature and phytoplankton biomass, indicating a great affinity of species for the terrestrial effluents and the high trophic conditions. Conversely, traditionally marine species were associated with the highest values of salinity and the low concentrations of phytoplankton biomass. Although, most meroplanktonic larvae were associated with the point of the diagram origin (0,0), shift toward sectors B and C can be noticed, indicating the distribution of these larvae along the estuary but their production increased with the decreasing of salinity and the increasing of phytoplankton biomass.
The abundance and distribution of the most important zooplankton taxa along the environmental gradients of eutrophication and salinity in the Damietta estuary can also be explored by calculating their abundance-weighted optima of chlorophyll a and salinity, respectively (Table VI). For example, the rotifers Synchaeta oblonga, and S. okai; the protozoan Paramecium sp.; and the copepod Acanthocyclops americanus showed their abundance weighted optima at the highest levels of algal biomass, whereas, Leprotintinnus nordgvistii; the larvacean Oikopleura dioica; and the cladoceran Podon intermedius were generally more abundant at the lowest concentrations of chlorophyll a. On the other hand, the results confirm that, the tintinnids Leprotintinnus nordgvistii; the chaetognath Sagitta friderici; and the species of Paracalanidae showed their optima at the highest levels of salinity, whereas Paramecium sp.; the copepod Acanthocyclops americanus; and Synchaeta stylata were more abundant in less saline water.
Discussion
Increasing human population has a direct link with nutrient loading in freshwater and coastal ecosystems (Nilsson and Malm-Renöfält, 2008; Prasad et al., 2014). A high nutrient load deteriorates the water quality in Damietta estuary and cause eutrophication. The significant spatial variations in nitrogenous nutrients concentrations along the estuary may be attributed to the rate and volume of land water. Compared to the only two prior studies for the Damietta estuary done by Khedr (1998) and Saad and Abdel-Moati (1984), the present study showed that the general physical status of the water in the estuary has not changed significantly over the last 15 years, despite the expansion of the human activities.
In this study, the multivariate analysis revealed the presence of three well-defined regions along the Damietta estuary (downstream, midstream, and upstream). The variations in the zooplankton assemblages between these regions were mainly a function of variations of environmental conditions; in particular, salinity had the major effect on zooplankton, in addition to temperature, phosphate concentration, and food availability (e.g. phytoplankton biomass). This is consistent with other studies that consider salinity the most important environmental variable determining spatial distribution of zooplankton in estuaries (e.g. Collins and Williams, 1982; Froneman, 2002; Kibirige and Perissinotto, 2003).
The zooplankton community in the Damietta estuary was characterized by low species diversity compared to that of the Nile’s Rosetta estuary (Setaita and Montaser, 2010), suggesting high levels of eutrophication in the Damietta estuary. Uriarte and Villate (2004) indicated that the estuarine zooplankton communities in Bay of Biscay were controlled by levels of pollution and the physical properties of the water. In most estuaries the greatest species diversity occurred near the mouth of the river since the diversity is enhanced through the mixture of estuarine and coastal zooplankton, and characterized by the presence of large consumers (chaetognathas, copepods and veligers) (Lam-Hoai et al., 2006; Primo et al., 2009). This is consistent with the present results; where high species number at the estuary mouth indicating the prevalence of coastal zooplankton species while the much lower values toward estuary’s upstream may be due to the high levels of pollutants and/or reduced salinity. Gray et al. (1979) stated that the pollution causes the loss of some sensitive species and leads to the dominance of the few most tolerant species. In most temperate estuaries, the freshwater flow at the upper estuary makes the freshwater zooplankton predominant (Primo et al., 2009). Although this wasn’t the case in the Damietta estuary due to the obstructed flow by the Farskour dam, 20 fresh water species were still recorded and some of these species like Acanthocyclops americanus and Nitokra lacustris lacustris appeared in high frequencies particularly at the estuary upstream indicating that the zooplankton communities are shaped by salinity variations
Total zooplankton, copepods, cladocerans, appendicularians, veliger larvae and tintinnids showed higher densities at the estuary mouth where salinities were highest. This finding could be attributed to the rapid exchange with seawater, which improved water quality and lowered eutrophication. These observations supported higher abundance of zooplankton organisms with increasing salinity and subsequent improvement in water quality (Siokou-Frangou and Papathanassiou, 1991; Uriarte and Villate, 2004).
Tintinnids frequently appeared along the estuary with relatively high diversity. They were mainly within genera classified as neritic (Favella, Leprotintinnus, Stenosemella and Tintinnopsis) or cosmopolitan (such as Amphorellopsis and Undella) (Dolan et al., 2006). Many factors typically control the spatial and temporal distribution of tintinnids including biological factors such as food supply and physicochemical factors as well as temperature and salinity (Sanders, 1987; Verity, 1987; Pierce andTurner, 1993). However, no clear correlations can be found between tintinnid abundance and chlorophyll a (Pearson’s: r= 0.0.122, P=0.480) or temperature (Pearson’s: r= 0.109, P=0.506) during the present study. Barría de Cao (1992) did not observe any correlation between the temperature and tintinnid abundance, while Kamiyama and Tsujino (1996) observed no correlation between tintinnids and chlorophyll a. The abundance of tintinnids during the present study seems to be affected primarily by salinity: the low salinity at the estuary upstream may have prohibited the tintinnids proliferation, while the three neritic species, namely Leprotintinnus nordqvistii, Stenosemella ventricosa and Tintinnopsis cylindrical, were frequently found at the mouth of the estuary potentially from mixing during the high tide. Similar observations were recorded by Rakshit et al. (2014) for some neritic tintinnids in Hooghly river estuary. On the other hand, the existence and dominance of Favella spp. along the estuary is evidence that these hyaline tintinnids can proliferate and survive in poor conditions. Non-tintinnid ciliates also showed low diversity and abundance during this study and similar to the pattern described by Rakshit et al. (2014) for the Hooghly river estuary, while contrasting with the pattern that usually described for tropical coastal waters (Pierce and Turner, 1994).
Rotifers showed significant contribution in both freshwater and estuarine systems may be attributed to their trophic status as major grazers of algae and small ciliates (Havens, 1991; Arndt, 1993; Tian et al., 2017). The dominant species of rotifer in Damietta estuary belonged to Synchaeta, a genus which is considered to be a marine rotifer (Wei and Xu, 2014) and is common in temperate estuaries (Townsend, 1984; Aboul-Ezz et al., 2014; Wei and Xu, 2014). Synchaeta were represented by 4 species and constituted more than 99% of the total rotifers abundance, likely due to relatively high salinity of the Damietta estuary. Heinbokel et al. (1988) reported the dominance of Synchaeta in Chesapeake Bay, while Aboul-Ezz et al. (2014) reported the significant contribution of Synchaeta to the rotifer community in the Egyptian Mediterranean water.
Although copepods dominated the holoplankton in Damietta estuary, only Oithona spp., Euterpina acutifrons and Paracalanidae were common; while the other species were recorded infrequently. Similar observations were found in both the Egyptian Mediterranean coast (Nour El-Din, 1987; Abdel-Aziz and Aboul-Ezz, 2004; Abdel-Aziz et al., 2007) and the Suez canal area (El-Serehy et al., 2001; El-Sherbiny et al., 2011). The dominance of the small Oithonidae and Paraclanidae is a characteristic of the inshore tropical waters (Stephen, 1978; Hopcroft et al., 1998; Abdel-Aziz and Aboul-Ezz, 2004; McKinnon et al., 2005; Duggan et al., 2008). Stephen (1978) claimed that, although the Paracalanidae were the dominant copepod family in Indian coastal waters, cyclopoid copepods were more represented as a consequence of the use of small mesh size net. In this study, a small mesh size net (54 µm) was used and the small cyclopoid copepods dominated the copepod community. The cyclopoid morphology or prey preferences may express a greater flexibility to environmental conditions than calanoides (Paffenhöfer, 1993).
Oithona spp. and Euterpina acutifrons are assumed from their distribution to be neritic, cosmopolitan and estuarine species (Dowidar, 1965; Hussein, 1977; Vieira et al., 2003). They are also eurytropic species tolerating a wide range of temperature and salinity (Dowidar, 1965; Nour El-Din, 1987). The copepod nauplii and copepodite stages dominated the zooplankton in Damietta estuary, as they do in other estuaries (Turner, 1982; Winder and Jassby, 2011). They formed the main bulk being 20.4% and 45.5% of the total copepod abundance respectively. Vieira et al. (2003), claimed that the neritic and estuarine plankton differ from the oceanic by the smaller size of organisms and by the higher abundance of larval stages.
The meroplankton abundance reflects the reproductive rates of the benthic adult forms with their high densities reflecting larval recruitments at the mouth of the estuaries (Raymont, 1983) where they sometimes dominated estuarine zooplankton (Fulton, 1984). This is consistent with the present results where the meroplanktonic larvae generally dominated the community structure during the study period. Among all the recorded meroplanktonic forms, cirriped larvae and polychaete larvae were consistently highly abundant at all stations of the estuary. A significant increase in density of polychaete larvae with decreasing salinity occurred along the estuary, while for cirriped larvae the effect of salinity was limited and their maximum abundance appeared at the estuary midstream. This suggests meroplanktonic populations may be more related to differences in benthic habitat or productivity than the pelagic environment (Sautour and Castel, 1995). Thus the large extent of mudflates toward the end of the estuary may provide an excellent habitat for polychaetes while the presence of hard substratum particularly at stations from IV to VIII at the estuary midstream can serve as habitat for barnacle populations.
Cnidarians were represented only by the coastal hydromedusae (Ectopleura dumortierii and Obelia spp.). It is known that cnidarian species can not flourish in estuaries due to difficulties with osmoregulation (Dumont, 1994). Therefore, low densities of cnidarians appeared only at the estuary’s lower end where salinities were >30%.
Conclusion
In general, the obstruction of Nile River flow by Farskour dam changed the properties of Damietta estuary water, with seawater now mixed primarily with land-based effluents. It seems that the Damietta estuary is now under environmental stress, that has resulted in changes in the species dynamics within the estuary. The abundance and diversity of zooplankton community structure was relatively homogenous within the high salinity region at the downstream part of the estuary, while considerable gradients in abundance and diversity of both meroplanktonic and holoplanktonic groups were found within the acute eutrophic region in the upstream part of the estuary.
Acknowledgements
FWe acknowledge UNESCO Egypt for providing partial financial support for this research.
Statement of conflict of interest
Authors have declared no conflict of interest.
References
Abdel-Aziz, N.E., Aboul-Ezz, S.M., 2004. The structure of zooplankton community in Lake Maryout, Alexandria, Egypt. Egypt. J. aquat. Res., 30: 160-170.
Abdel-Aziz, N.E., Ghobashi, A.E., Dorgham, M.M. and El-Tohamy, W.S., 2007. Qualitative and quantitative study of copepods in damietta harbor, Egypt. Egypt. J. aquat. Res., 33: 144-162.
Aboul-Ezz, S.M., Abdel-Aziz, N.E., Abou Zaid, M.M., El-Raeys, M. and Abo-Taleb, H.A., 2014. Environmental assessment of El-Mex Bay, Southeastern Mediterranean by using Rotifera as a plankton bio-indicator. Egypt. J. aquat. Res., 40: 43-57.
Allen, D.M., Ogburn-Matthews, V., Buck ,T. and Smith, E.M., 2008. Mesozooplankton responses to climate change and variability in a southeastern US estuary (1981-2003). J. Coast. Res., 55: 95-110. https://doi.org/10.2112/SI55-004.1
Arndt, H., 1993. Rotifers as predators on components of the microbial web (bacteria, heterotrophic flagellates, ciliates)-A review. Hydrobiologia, 255: 231-246. https://doi.org/10.1007/BF00025844
Barría de Cao, M.S., 1992. Abundance and species composition of Tintinnina (Ciliophora) in Bahia Blanca estuary, Argentina. Estuar. Coast. Shelf S., 34: 295-303. https://doi.org/10.1016/S0272-7714(05)80085-X
Bollens, S.M., Breckenridge, J.K., Hooff, R.C.V. and Cordell, J.R., 2011. Mesozooplankton of the lower San Francisco Estuary: spatio-temporal patterns, ENSO effects and the prevalence of non-indigenous species. J. Plankt. Res., 33: 1358-1377. https://doi.org/10.1093/plankt/fbr034
Boltovskoy, D., 1999. South Atlantic zooplankton and community. Backhuys, Leiden, The Netherlands.
Cameron, W.M. and Pritchard, D.W., 1963: Estuaries. In: The sea (ed. M.N. Hill). John Whileyand Sons, New York, pp. 306-324.
Champalbert, G., Paganom, M., Arfi, R. and Chevalier, C., 2014. Effects of the sandbar breaching on hydrobiological parameters and zooplankton communities in the Senegal River Estuary (West Africa). Mar. Pollut. Bull., 82: 86-100. https://doi.org/10.1016/j.marpolbul.2014.03.015
Collins, N.R. and Williams, R., 1982. Zooplankton communities in the Bristol Channel and Severn Estuary. Mar. Ecol-Prog. Ser., 9: 1-11. https://doi.org/10.3354/meps009001
Cosper, T.C., 1972. The identification of tintinnids (Protozoa: Ciliata: Tintinnida) of the St. Andrew Bay system, Florida. Bull. Mar. Sci., 22: 391- 418.
Costello, J.H., Sullivan, B.K. and Gifford, D.J., 2006. A physical–biological interaction underlying variable phenological responses to climate change by coastal zooplankton. J. Plankt. Res., 28: 1099-1105. https://doi.org/10.1093/plankt/fbl042
Dolan, J., Jacquet, S. and Torréton, J.P., 2006. Comparing taxonomic and morphological biodiversity of tintinnids (Planktonic ciliates) of New Caledonia. Limnol. Oceanogr., 51: 950-958. https://doi.org/10.4319/lo.2006.51.2.0950
Dowidar, N.M., 1965. Distribution and ecology of marine plankton in the region of Alexandria. PhD theiss ,University of Alexandria, Alexandria, EG.
Duggan, S., McKinnon, A.D. and Carleton, J.H., 2008. Zooplankton in an Australian tropical estuary. Estuar. Coast., 31: 455-467. https://doi.org/10.1007/s12237-007-9011-x
Dumont, H.J., 1994. The distribution and ecology of the fresh-and brackish-water medusae of the world. Hydrobiologia, 272: 1-12. https://doi.org/10.1007/BF00006508
Edmondson, W.T., 1959. Fresh water biology, 2nd edn. John Wiley and sons, New York, London, Sydney.
El-Serehy, H., Aboul-Ezzm, S.M., Samaan, A. and Saber, N., 2001. On the ecological role of Copepoda in the Suez Canal marine ecosystem. Egypt. J. Biol., 3: 116-123.
El-Sherbiny, M.M., Al-Aidaroos, A.M. and Gab-Alla, A., 2011. Seasonal composition and population density of zooplankton in Lake Timsah, Suez Canal, Egypt. Oceanologia, 53: 837-859. https://doi.org/10.5697/oc.53-3.837
Froneman, P.W., 2002. Seasonal changes in selected physico-chemical and biological variables in the temporarily open/closed Kasouga estuary, Eastern Cape, South Africa. Afr. J. aquat. Sci., 27: 117-123. https://doi.org/10.2989/16085914.2002.9626583
Fulton, R.S., 1984. Distribution and community structure of estuarine copepods. Estuaries, 7: 38-50. https://doi.org/10.2307/1351955
Graham, E.S. and Bollens, S.M., 2010. Macrozooplankton community dynamics in relation to environmental variables in Willapa Bay, Washington, USA. Estuar. Coast., 33: 182-194. https://doi.org/10.1007/s12237-009-9235-z
Gray, J.S., Waldichuk, M., Newton, A.J., Berry, R.J., Holde, A.V. and Pearson, T.H., 1979. Pollution-induced changes in populations [and Discussion]. Phil. Trans. R. Soc. B, 286: 545-561. https://doi.org/10.1098/rstb.1979.0045
Hamza, W., 2006. The Nile estuary. In: Estuaries. Springer, pp. 149-173. https://doi.org/10.1007/698_5_025
Havens, K.E., 1991. The importance of rotiferan and crustacean zooplankton as grazers of algal productivity in a freshwater estuary. Arch. Hydrobiol., 122: 1-22.
Heinbokel, J.F., Coats, D.W., Henderson, K.W. and Tyler, M.A., 1988. Reproduction rates and secondary production of three species of the rotifer genus Synchaeta in the estuarine Potomac River. J. Plankt. Res., 10: 659-674. https://doi.org/10.1093/plankt/10.4.659
Hopcroft, R.R., Roff, J.C. and Lombard, D., 1998. Production of tropical copepods in Kingston Harbour, Jamaica: the importance of small species. Mar. Biol., 130: 593-604. https://doi.org/10.1007/s002270050281
Hussein, M.M., 1977. A study of the zooplankton in the Mediterranean waters off the Egyptian coast during 1970-1971 with special reference to copepods. MSc thesis,University of Alexandria, Alexandria ,EG.
Janakiraman, A., Naveed, M.S., Muthupriya, P., Sugumaran, J., Sheriff, M.A. and Altaff, K., 2013. Studies on the zooplankton biodiversity and density in Adyar estuary, Chennai, India. J. environ. Biol., 34: 273-275
Kamiyama, T. and Tsujino, M., 1996. Seasonal variation in the species composition of tintinnid cilates in Hiroshima Bay, the Seto Inland Sea of Japan. J. Plankt. Res., 18: 2313-2327. https://doi.org/10.1093/plankt/18.12.2313
Khedr, A.A., 1998. Vegetation zonation and management in the Damietta estuary of the River Nile. J. Coast. Conserv., 4: 79-86. https://doi.org/10.1007/BF02806493
Kibirige, I. and Perissinotto, R., 2003. The zooplankton community of the Mpenjati Estuary, a South African temporarily open/closed system. Estuar. Coast. Shelf S., 58: 727-741. https://doi.org/10.1016/S0272-7714(03)00180-X
Kimmel, D.G., Miller, W.D., Harding, L.W., Houde, E.D. and Roman, M.R., 2009. Estuarine ecosystem response captured using a synoptic climatology. Estuar. Coast., 32: 403-409. https://doi.org/10.1007/s12237-009-9147-y
Lam-Hoai, T., Guiral, D. and Rougier, C., 2006. Seasonal change of community structure and size spectra of zooplankton in the Kaw River estuary (French Guiana). Estuar. Coast. Shelf S., 68: 47-61. https://doi.org/10.1016/j.ecss.2006.01.009
Lawrence, D., Valiela, I. and Tomasky, G., 2004 Estuarine calanoid copepod abundance in relation to season, salinity, and land-derived nitrogen loading, Waquoit Bay, MA. Estuar. Coast. Shelf S., 61: 547-557. https://doi.org/10.1016/j.ecss.2004.06.018
Little, C., 2000. The biology of soft shores and estuaries. Oxford University Press Inc., New York.
Marques, S.C., Azeiteiro, U.M., Marques, J.C., Neto, J.M. and Pardal, M.Â., 2006. Zooplankton and ichthyoplankton communities in a temperate estuary: Spatial and temporal patterns. J. Plankt. Res., 28: 297-312. https://doi.org/10.1093/plankt/fbi126
Marshall, S.M., 1969. Protozoa order Tintinnida. In: Fishes d’ Identification du Zooplankton (eds. J.H. Fraser and V.K. Hansen). Counseil International Pour l’explaration de la mer, Zooplankton Sheet: Charlottenlund, DK, pp. 112-117
McKinnon, A.D., Duggan, S. and De’ath, G., 2005. Mesozooplankton dynamics in nearshore waters of the Great Barrier Reef. Estuar. Coast. Shelf S., 63: 497-511. https://doi.org/10.1016/j.ecss.2004.12.011
Newell, G.E. and Newell, R.C., 1979. Marine plankton: A practical guide. Hutchinson Educational Ltd., London, UK.
Nilsson, C. and Malm-Renöfält, B., 2008. Linking flow regime and water quality in rivers: a challenge to adaptive catchment management. Ecol. Soc., 13: 1-18. https://doi.org/10.5751/ES-02588-130218
Nishida, S., 1985. Taxonomy and distribution of the family Oithonidae (Copepoda, Cyclopoida) in the Pacific and Indian Oceans. Bull. Ocean Res. Inst. Univ. Tokyo, 20: 1-167.
Nour El-Dinm, N.M.N., 1987. Ecology and distribution of pelagic copepods in the Mediterranean waters of Egypt. MSc thesis,University of Alexandria, Alexandria, EG.
Paffenhöfer, G., 1993. On the ecology of marine cyclopoid copepods (Crustacea, Copepoda). J. Plankt. Res., 15: 37-55. https://doi.org/10.1093/plankt/15.1.37
Park, G.S. and Marshall, H.G., 2000. Estuarine relationships between zooplankton community structure and trophic gradients. J. Plankt. Res., 22: 121-136. https://doi.org/10.1093/plankt/22.1.121
Pierce, R.W. and Turner, J.T., 1993. Global biogeography of marine tintinnids. Mar. Ecol-Prog. Ser., 94: 11-126. https://doi.org/10.3354/meps094011
Pierce, R.W. and Turner, J.T., 1994. Plankton studies in buzzards Bay, Massachusetts, USA. IV. Tintinnids, 1987 to 1988. Mar. Ecol-Prog. Ser., 112: 235-240. https://doi.org/10.3354/meps112235
Prasad, M.B.K., Maddox, M.C., Sood, A. and Kaushal, S., 2014. Nutrients, chlorophyll and biotic metrics in the Rappahannock River estuary: Implications of urbanisation in the Chesapeake Bay watershed, USA. Mar. Freshw. Res., 65: 475-485. https://doi.org/10.1071/MF12351
Primo, A.L., Azeiteiro, U.M., Marques, S.C., Martinho F. and Pardal, M.Â., 2009. Changes in zooplankton diversity and distribution pattern under varying precipitation regimes in a southern temperate estuary. Estuar. Coast. Shelf S., 82: 341-347. https://doi.org/10.1016/j.ecss.2009.01.019
Rakshit, D., Biswas, S.N., Sarkar, S.K., Bhattacharya, B.D., Godhantaraman, N. and Satpathy, K.K., 2014. Seasonal variations in species composition, abundance, biomass and production rate of tintinnids (Ciliata: Protozoa) along the Hooghly (Ganges) River Estuary, India: a multivariate approach. Environ. Monit. Assess., 186: 3063-3078. https://doi.org/10.1007/s10661-013-3601-9
Raymont, J.E.G., 1983. Plankton productivity in the oceans, volume 2: Zooplankton. Oxford Pergamon Press, UK.
Rose, M., 1933. Copepods pelagiques (in france). Le Chevalier, Paris, FR.
Saad, M. and Abdel-Moati, M., 1984. Dissolved organic matter status in Damietta estuary of the Nile. Arch. Inst. Pasteur Tunis, 61:453-462.
Sanders, R.W., 1987. Tintinnids and other microzooplankton-seasonal distributions and relationships to resources and hydrography in a Maine estuary. J. Plankt. Res., 9: 65-77. https://doi.org/10.1093/plankt/9.1.65
Sautour, B. and Castel, J., 1995. Comparative spring distribution of zooplankton in three macrotidal European estuaries. Hydrobiologia, 311: 139-151. https://doi.org/10.1007/BF00008577
Seaby, R., Henderson, P. and Prendergast, J.R., 2004. Community analysis package. Pisces Conservation Ltd, Lymington, UK.
Setaita, H.S. and Montaser, M.H., 2010. Impact of pollution on invertebrates biodiversity in the River Nile associated with Dahab and El-Warrak Islands, Egypt. Int. J. environ. Sci. Engg., 1: 15-25.
Siokou-Frangou, I. and Papathanassiou, E., 1991. Differentiation of zooplankton populations in a polluted area. Mar. Ecol-Prog. Ser., 76: 41-51. https://doi.org/10.3354/meps076041
Sousa, W., Attayde, J.L., Rocha, E.D.S. and Eskinazi-Sant’Anna, E.M., 2008. The response of zooplankton assemblages to variations in the water quality of four man-made lakes in semi-arid northeastern Brazil. J. Plankt. Res., 30: 699-708. https://doi.org/10.1093/plankt/fbn032
Stephen, R., 1978. Copepod composition along southwest and southeast coasts of India. In: Oceanography of the Indian Ocean (ed. B.N. Desai). Oxford and IBH, New Delhi, pp. 121-127.
Strickland, J.D.H. and Parsons, T.R., 1972. A practical handbook of seawater analysis, 2nd Edition. Fisheries Research Board of Canada, Ottawa.
Ter Braak, C.J.F. and Smilauer, P., 1998. Canoco. Reference manual and user’s guide to Canoco for Windows: Software for Canonical Community Ordination (version 4). Microcomputer Power, Ithaca, NY, USA.
Tian, W., Zhang, H., Zhang, J., Zhao, L., Miao, M. and Huang, H., 2017. Responses of zooplankton community to environmental factors and phytoplankton biomass in Lake Nansihu, China. Pakistan J. Zool., 49: 493-493.
Townsend, D.W., 1984. Comparison of inshore zooplankton and ichthyoplankton populations of the Gulf of Maine. Mar. Ecol-Prog. Ser., 15: 79-90. https://doi.org/10.3354/meps015079
Turner, J.T., 1982. The annual cycle of zooplankton in a Long Island estuary. Estuaries, 5: 261-274. https://doi.org/10.2307/1351749
Uriarte, I. and Villate, F., 2004. Effects of pollution on zooplankton abundance and distribution in two estuaries of the Basque coast (Bay of Biscay). Mar. Pollut. Bull., 49: 220-228. https://doi.org/10.1016/j.marpolbul.2004.02.010
Verity, P.G., 1987. Abundance, community composition, size distribution, and production rates of tintinnids in Narragansett Bay, Rhode Island. Estuar. Coast. Shelf S., 24: 671-690. https://doi.org/10.1016/0272-7714(87)90106-5
Vieira, L., Azeiteiro, U., Ré, P., Pastorinho, R., Marques, J.C. and Morgado, F., 2003. Zooplankton distribution in a temperate estuary (Mondego estuary southern arm: Western Portugal). Acta Oecol., 24: 163-173. https://doi.org/10.1016/S1146-609X(03)00038-9
Wei, N. and Xu, R.L., 2014. Distinct difference of littoral rotifer community structure in two mangrove wetlands of Qi’ao Island, Pearl River estuary, China. Zool. Stud., 53: 1-12. https://doi.org/10.1186/s40555-014-0030-6
Winder, M. and Jassby, A.D., 2011. Shifts in zooplankton community structure: implications for food web processes in the upper San Francisco Estuary. Estuar. Coast. Shelf S., 34: 675-690. https://doi.org/10.1007/s12237-010-9342-x
Zhao, Z.M. and Zhou, X.Y., 1984. Introduction to ecology. Scientific and Technical Documents Publishing House, Chongqing, pp. 108-119.
To share on other social networks, click on any share button. What are these?


