
Effects of Climate Change on Productivity of Maize Crop in Khyber Pakhtunkhwa


Research Article
Effects of Climate Change on Productivity of Maize Crop in Khyber Pakhtunkhwa
Muhammad Ashfaq* and Inayatullah Jan
Institute of Development Studies (IDS), The University of Agriculture, Khyber Pakhtunkhwa, Pakistan.
Abstract | This study aims to assess the impact of climate change on productivity of maize in Khyber Pakhtunkhwa (KP) province of Pakistan over a period of thirty years from 1986 to 2015. According to the ecological landscape, KP is divided into three climatic regions; the northern climatic region, the central climatic region, and the southern climatic region. The study uses Autoregressive Distributed Lag (ARDL) model for maize crop in KP. This study reveals that the impacts of climatic variables are increasing from the southern climatic region to the northern climatic region. The study also reveals that any negative shock to the crops productivity can be overcome by increasing the area under maize cultivation. It is concluded that the variations in climatic variables have significant effects on maize productivity in the short-run as well as in the long-run in all the climatic regions of KP.
Received | October 23, 2018; Accepted | July 08, 2019; Published | August 30, 2019
*Correspondence | Muhammad Ashfaq, Institute of Development Studies (IDS), The University of Agriculture, Khyber Pakhtunkhwa, Pakistan; Email: khalileco@gmail.com
Citation | Ashfaq, M. and I. Jan. 2019. Effects of climate change on productivity of maize crop in Khyber Pakhtunkhwa. Sarhad Journal of Agriculture, 35(3): 925-932.
DOI | http://dx.doi.org/10.17582/journal.sja/2019/35.3.925.932
Keywords | Kharif, maize, Climate change, Productivity, Autoregressive Distributed Lag (ARDL), Khyber Pakhtunkhwa
Introduction
Climate encompasses temperature patterns, precipitation, humidity, winds, and seasons. The statistical disturbance of weather over longer time periods that ranges from a decade to million years is known as climate change (IPCC, 2007). It can be region specific or can occur across the whole earth. The pattern of climate had an important role in shaping natural ecosystems, human culture and economies. e.g. the usual timing of rains and temperatures effects plants growth and fruit, hatching of insects and streams, crops pollination, water for drinking and irrigation among others (Zafar et al., 2012).
The United Nations Framework Convention on Climate Change (UNFCCC) defines climate change as the alteration in global atmosphere’s composition due to direct or indirect human activity which is in addition to natural variability observed over a comparable period of time (UNFCCC, 2011). Climate change is considered as one the leading problems facing the world. The main culprit behind climate change is greenhouse gases (GHGs) which include carbon dioxide (CO2), methane (CH4), nitrous oxide (N2O), water vapors and others. The emissions of these gases are the result of a number of anthropogenic activities. Fossil fuels, fuel-wood and wastes combustion are the main producers of CO2. The responsibility of CO2 enriched world lies on human activities as the concentration of CO2 in the atmosphere has increased from 280 parts per million (ppm) to 380 ppm since pre industrial time (IPCC, 2007).
Agriculture sector is vulnerable, both physically and economically, to variability in climate patterns which threatens crop productivity. A number of climatic variables such as rainfall pattern, temperature fluctuations, changes in sowing and harvesting dates, availability of water and suitability of land affect productivity of agriculture sector. In Asia, uneven climate changes have adverse effects i.e. heavy rainfall during wet seasons have increased the chances of flood while on other hand dry season is increasing occurrence of drought. These changes in climate are threatening agriculture productivity (ADB, 2009). Majority of 500 million rural poor in Asia are subsistence farmers in rain fed land. Rise in temperature in the past few decades has stressed water availability causing fall in the production of rice, maize and wheat (UNFCCC, 2007). In South Asia, the effects of climate change are more devastating and may cause 50 percent reduction in wheat production by 2050 (GoP, 2009).
Pakistan is predominantly an agricultural country. The prosperity and affluence of Pakistan lies in its agriculture sector. It is the backbone of Pakistan’s economy. About 42.3 percent of people depend on agriculture sector and the share of this sector to the GDP is 18.9 percent (GoP, 2018). According to World Bank Report (2013), Pakistan is seriously bearing the impacts of climate change. It is among the 12 highly exposed countries to climate change. According to IPCC Fourth Assessment Report (IPCC, 2007), northern Pakistan would face intense rains and the recent floods were the result of those heavy rains. Pakistan will face substantial losses in crop yields due to changing climate because of the high dependence on natural climatic conditions. Increase in temperature and reduction in rainfall had made the agriculture sector of Pakistan vulnerable.
Agriculture has a significant role in the socio-economic development of Pakistan. The major portion of the economy is composed of agriculture and agricultural related activities. The unusual heavy rains in 2010 resulting in floods and its adverse effects on agriculture and property are the examples of climate change. Khyber Pakhtunkhwa was one of the heavily affected provinces in those floods.
Climate change affects the agriculture productivity through number of ways like variations in precipitation, changes in sowing and harvesting dates, variation in temperature, timely availability of water and evapotranspiration.
There is dearth of empirical studies on assessing the effects of climate change on agriculture sector in Khyber Pakhtunkhwa. The fact remains that Khyber Pakhtunkhwa contributes 18.9 percent to the gross domestic product (GDP) of Pakistan. Keeping in mind the gap, this study aims to gain better knowledge of the climate change and its impacts on major kharif crop i.e. maize. Future projections regarding the effects of changes in temperature and precipitation on the corps production will also be made in this study.
Materials and Methods
Selection of sample and data
Khyber Pakhtunkhwa (KP) Province of Pakistan which includes 25 districts is the focus of this study. KP can be divided into three regions depending on their climate i.e. the southern, the central and northern climatic regions. The southern region is the hottest, the central region has moderate climate and north has colder regions. On the basis of availability of secondary data on precipitation, temperature and crop output some of the districts in the three regions were selected randomly. District Swat and Chitral in northern region, Peshawar, Nowshera, Charsadda, and Mardan districts in the central region and in the southern region, Dera Ismail Khan and Tank districts were considered in the study. This study focuses on major kharif crop, i.e. maize, in KP. The data on districts wise productivity of maize was taken from Pakistan Bureau of Statistics, Khyber Pakhtunkhwa Bureau of Statistics and the data on climatic variables (temperature and precipitation) were obtained from Pakistan Meteorological Department. Balance panel design was used for the period 1986-2015 (Hsiao, 2014; Baltagi, 2008).
Analytical techniques
Model specification: The following model was used in this research:


Where;
Y= crop’s yield (000 tones), A= Area under cultivation (000 Hectare), Tmin=Average minimum temperature (oC), Tmax= Average maximum temperature (oC), P= Average precipitation (millimeter), β0= the intercept, βi= the variables respective coefficient, µ = Error term
Test for stationarity: This study applies Augmented Ducky-Fuller and Phillips-Perron (PP) unit root tests for checking stationarity in data. These tests also determine the integration order of variables. It is one of the qualities of ADF test that it deals with serial correlation among the residuals of the model, because it incorporates the lag of the dependent variables (Greene, 2008). Phillips-Perron (PP) test also has the ability to deal with the serial correlation but it does not use the lag of dependent variables. PP unit root test uses some non-parametric techniques (Nadeem and Munir, 2016). The general form of ADF models is given below:
With both constant and trend:
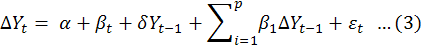
With only constant:
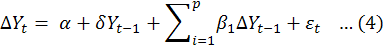
Where;
ΔYt= value of variable by taking first difference in time t, α = constant, βt= time trend, Yt-1= value of variable by taking 1st lag, δ= estimated value of parameter, p= lags number of variable and εt= error term. If the trend in ADF test is found significant then the results of model with intercept and trend are accepted. If the trend is insignificant then the result of the model with only intercept is accepted and the consequently the decision about stationarity is made. Same procedure is followed for results of PP test.
Optimum lag selection: Determination of appropriate number of lags is important for estimating the model. There are various criteria for selecting the appropriate lag. These criteria are Akaike Information Criterion (AIC), Schwarz Bayesian Criterion (SBC) or (BIC), and Hannan-Quinn Criterion (HQ). In this study utilizes AIC for appropriate lags selection, because AIC is efficient and accurate criterion (Liew, 2004).
Cointegration test: Autoregressive distributed lag (ARDL) model is employed in this study because the variables under consideration are integrated of different order i.e. I (0) and /or I(1) (Pesaran and Shin, 1999).
The specific ARDL models for the study, to estimate long-run relationship among the variables is as follow:
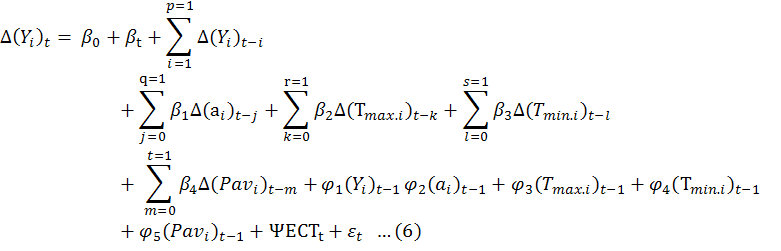
While the short-run dynamics of ARDL model can be estimated through the following equation.
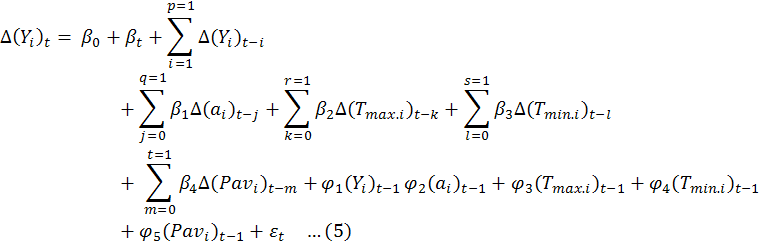
Where;
∆ = differenced operator, p, q, r, s, t, = length of lag, β0 and βt are constant and trend terms, β1 and β4 are the short-run coefficients while φ1 to φ5 are the long-run coefficients, Ψ is the coefficient of error correction term (ECT) (speed of adjustment). The subscripts i and t represents the cross section and time period respectively.
The error correction coefficient depicts the speed with which variables converge or diverge to equilibrium. For the consistency model the value of error correction term should be negative (but not less than-2) and significant (Hoang and Barker, 2012). Significance of ECT value indicates long-run relation among variables. If residual of the error-correction mode is serially uncorrelated, then the panel ARDL model is considered consistent.
Stability and consistency of ARDL model: Various diagnostic tests were applied to confirm the consistency and stability of selected model. Wald or F-statistics is utilized in this study for checking the significance of the conditional unrestricted constant and restricted trend, error correction model. The critical values are taken from Pesaran et al. (1999). The calculated Wald test value is compared with the critical values proposed by Pesaran. If F-value calculated is greater than F- tabulated upper bound values then the null hypothesis of no cointegration, is rejected. The alternate hypothesis is accepted and it is conclusively inferred that long-run relationship exists among variables. The stability of the ARDL model is ensured by using Cumulative sum (CUSUM) and cumulative sum of square (CUSUMSQ) tests offered by Brown et al. (1975).
Results and Discussion
Stationarity analysis: unit root results
The ADF and PP tests results are given in Table 1. The results are mixed as some of the variables are integrated of order I (0) and other of order I (1).
| Augmented Dickey Fuller (ADF) test | Phillips-Perron (PP) test | |||
| Variables | Intercept | Intercept, linear trend | Intercept | Intercept, linear trend |
| Y | 6.04 (0.41) | 15.04 (0.01) | 6.95 (0.32) | 21.25 (0.00) |
| D(Y) | 62.48 (0.00) | 54.04 (0.00) | 92.03 (0.00) | 163.49 (0.00) |
| Tmax | 34.34 (0.00) | 26.13 (0.00) | 55.60 (0.00) | 47.37 (0.00) |
| D(Tmax) | 60.45 (0.00) | 48.00 (0.00) | 55.26 (0.00) | 790.17 (0.00) |
| A | 13.28 (0.03) | 7.53 (0.27) | 16.96 (0.00) | 9.57 (0.14) |
| D(A) | 42.93 (0.00) | 37.22 (0.00) | 84.08 (0.00) | 329.68 (0.00) |
| Tmin | 25.54 (0.00) | 27.71 (0.00) | 37.01 (0.00) | 34.26 (0.00) |
| D(Tmin) | 65.89 (0.00) | 57.09 (0.00) | 93.35 (0.00) | 466.97 (0.00) |
| PAV | 33.18 (0.00) | 26.70 (0.00) | 67.33 (0.00) | 76.42 (0.00) |
| D(PAV) | 67.75 (0.00) | 58.10 (0.00) | 55.26 (0.00) | 790.17 (0.00) |
Note: Values in parentheses are the respective probabilities.
In case of average maximum temperature, average minimum temperature, average precipitation and area under cultivation, the null hypothesis cannot be accepted. Hence, these variables are stationary at level. While for crop productivity, the null hypothesis of unit root is accepted and it is not stationary at level. Its first difference becomes stationary. The PP unit root test results validate ADF test results for all variables except for area under cultivation.
Optimum lag selection
Results of various criteria for optimal lag selection are presented in Table 2. One of the four criteria are suggesting one as optimal lag, one criteria is suggesting two as optimal lag, and one criteria is suggesting three as optimum lag length. But the model with one lag is better and clears the diagnostic tests, while other models have the instability problem and autocorrelation.
Table 2: VAR lag order selection criteria.
| M. | LogL | AIC | BIC | HQ | Specification |
| 1 | -128.646348 | 3.793737* | 4.532765 | 4.090245 | ARDL(1,1,1,1,1) |
| 3 | -110.985285 | 3.950254 | 5.398748 | 4.531409 | ARDL(1,3,3,3,3) |
| 2 | -125.316333 | 4.007811 | 5.101571 | 4.446642 | ARDL(1,2,2,2, 2) |
Results of Cointegration test
After setting 3 as lag-length, panel ARDL model has been estimated. The results of the cointegration test are presented in Table 3. It shows that the most appropriate model for overall Khyber Pakhtunkhwa, kharif season is ARDL (1,1,1,1,1).
Table 3: ARDL (1,1,1,1) results for maize crop in overall KP.
| Dependent Variable: D(Y) | ||||
| Method: ARDL | ||||
| Included observations: 87 | ||||
| Selected Model: ARDL(1, 1, 1, 1, 1) | ||||
| Variable | Coefficient | Std. Error | t-Statistic | Prob. |
| Long-run equation | ||||
| TMAX | -0.118270 | 0.314651 | -0.375877 | 0.7082 |
| TMIN | 0.933953 | 0.492180 | 1.897584 | 0.0622 |
| A | 0.659248 | 0.287109 | 2.296161 | 0.0249 |
| PAV | 0.006146 | 0.005862 | 1.048285 | 0.2984 |
| Short-run equation | ||||
| COINTEQ01 | -0.557164 | 0.053739 | -10.36805 | 0.0000 |
| D(TMAX) | 1.833058 | 1.671860 | 1.096419 | 0.2769 |
| D(TMIN) | -3.390328 | 2.501211 | -1.355475 | 0.1800 |
| D(A) | 0.393460 | 0.085100 | 4.623505 | 0.0000 |
| D(PAV) | -0.029253 | 0.026203 | -1.116397 | 0.2684 |
| C | 2.244930 | 6.037696 | 0.371819 | 0.7112 |
| @TREND | 0.178811 | 0.292583 | 0.611144 | 0.5432 |
| Mean dependent var. | 0.335632 | S.D. dependent var. | 7.057372 | |
| S.E. of regression | 5.574193 | Akaike info criterion | 3.824686 | |
| Sum squared resid. | 2019.656 | Schwarz criterion | 4.519078 | |
| Log likelihood | -147.1109 | Hannan-Quinn criterion | 4.104706 | |
The results of long and short-run of ARDL model show that the conintegration coefficient is -0.11 and its probability is significant at 1 percent. The null hypothesis for this model is rejected and alternate hypothesis accepted.
The long-run coefficients in the above table depict that among four independent variables, the area under cultivation and average minimum temperature are significant. So it can be concluded that area under cultivation and average minimum temperature has significant effect on the crop productivity. The results also depict that average maximum temperature and average precipitation has insignificant effects on crop productivity. Thus in long-run the effects of variations in rainfall and average maximum temperature are insignificant on maize crop productivity.
The long-run t-statistics values of average minimum temperature is significant revealing that small increase in average minimum temperature has positive effects on maize crop productivity in Khyber Pakhtunkhwa. In the kharif season the cultivation of maize is adjusted so that to get maximum benefit of minimum temperature on their productivity. Same are the findings of PARC (1982). The t-statistics for average maximum temperature is insignificant. We can infer that increase in average maximum temperature has insignificant effect on the maize productivity.
Similarly, the t-statistics value for average rainfall is also insignificant in the long-run. In the kharif season, maize plant is strong enough and can sustain for longer time as compare to other plants. Also, excess water during plant maturation period can have adverse effects on crop productivity. The t-statistics for area under cultivation is significant. It can be inferred that in the long-run, bringing more area under cultivation can lead to increased crop productivity.
The short-run coefficients of average minimum temperature, average maximum temperature and variations in average precipitation are insignificant. The coefficient for only area under cultivation is significant. From the results it is drawn that 1 unit increase in area under cultivation in short-run can cause 0.39 unit increase in crop productivity. So the only remedy for short-run high maize crop productivity in kharif season is the efficient use of area under cultivation.
Cross sectional short-run relationships
The climatic regions, of Khyber Pakhtunkhwa i.e. the northern climatic region, the central climatic region and the southern climatic regions are treated as cross sections in this model. Cross sectional short-run coefficients for maize (kharif) crop are presented in tables given below.
In the Table 4, short-run coefficients for northern climatic region are presented. The results show that the coefficient of error correction term is significantly negative. The coefficient estimated for ECT is -0.663203 which shows high speed of adjustment. From the coefficient of ECT, it is revealed that on average previous period disequilibrium is attained by 66 percent in the following period on annual basis. It can be inferred from results that the variation in maize production from short to long-run is restored by 66 percent each year, significantly. The results also show that any negative shock in maize production in short-run can only be controlled by variations in average rainfall in the northern climatic region as it is the only variable having negative coefficient and significant at 5 percent level. The coefficient of average maximum temperature is insignificant. The average minimum temperature has negative coefficient and significant at 10 percent level which reveals that the effects of minimum temperature are less on maize crop. The coefficient of area under cultivation is also insignificant. It can be inferred from the results that better adaptation strategies can be employed in order to averse the adverse effects of minimum temperature and variations in rainfall on crop productivity. Bandara et al. (2014) concluded similar results.
Table 4: Short-run coefficients for northern climatic region for maize crop.
| Variable | Coefficient | Std. error | t-statistic | Prob. |
| COINTEQ01 | -0.663203 | 0.011228 | -59.06563 | 0.0000 |
| D(TMAX) | 0.303860 | 0.270322 | 1.124067 | 0.3428 |
| D(TMIN) | -1.532915 | 0.643724 | -2.381324 | 0.0975 |
| D(A) | 0.443053 | 0.941856 | 0.470404 | 0.6702 |
| D(PAV) | -0.007657 | 9.87E-05 | -77.59338 | 0.0000 |
| C | 7.934945 | 11.40326 | 0.695849 | 0.5366 |
| @TREND | -0.233440 | 0.001942 | -120.2003 | 0.0000 |
In the Table 5, short-run coefficients for central climatic region are presented. The result of ECT is negative and significant.
Table 5: Short-run coefficients for central climatic region for maize crop.
| Variable | Coefficient | Std. Error | t-Statistic | Prob. |
| COINTEQ01 | -0.488970 | 0.026862 | -18.20305 | 0.0004 |
| D(TMAX) | 5.172829 | 12.47992 | 0.414492 | 0.7064 |
| D(TMIN) | -8.341556 | 19.25483 | -0.433219 | 0.6941 |
| D(A) | 0.509664 | 0.425142 | 1.198808 | 0.3167 |
| D(PAV) | -0.081404 | 0.002399 | -33.93041 | 0.0001 |
| C | 8.623756 | 57.17553 | 0.150829 | 0.8897 |
| @TREND | 0.744592 | 0.079139 | 9.408714 | 0.0025 |
The value of ECT for maize (Kharif) crop in central climatic region is -0.488970 indicating that variation in maize production from short to long-run is corrected by 48 percent each year. The results show that any negative shock in short-run to maize production in central climatic region can only be adjusted by average rainfall. The coefficient of average rainfall is the only significant with negative sign. It can be revealed that any variation in average rainfall will negatively affect the maize productivity. The variables, area under cultivation, average maximum temperature and average minimum temperature are all insignificant. It depicts that they have insignificant effects on kharif crop in central climatic region.
In the Table 6, short-run coefficients for southern climatic region are presented. It can be observed from the results that ECT is negative and significant.
Table 6: Short-run coefficients for southern climatic region for maize crop.
| Variable | Coefficient | Std. Error | t-Statistic | Prob. |
| COINTEQ01 | -0.519318 | 0.028320 | -18.33764 | 0.0004 |
| D(TMAX) | 0.022485 | 0.013907 | 1.616869 | 0.2043 |
| D(TMIN) | -0.296514 | 0.020672 | -14.34367 | 0.0007 |
| D(A) | 0.227662 | 0.026803 | 8.493891 | 0.0034 |
| D(PAV) | 0.001301 | 4.83E-06 | 269.5187 | 0.0000 |
| C | -9.823912 | 19.47849 | -0.504347 | 0.6487 |
| @TREND | 0.025280 | 7.77E-05 | 325.1707 | 0.0000 |
The coefficient estimated for ECT is -0.519318 shows that annually, the disequilibrium that occurs in the previous period is regained about 51 percent in the following period. The coefficients of average rainfall and area under cultivation are positive and significant at 1 percent which depicts that increase in area under cultivation and rainfall will positively affect the maize crop in the region. Similarly, the negative coefficient of average minimum temperature with significance at 1 percent reveals that any increase in average minimum temperature will adversely affect maize productivity in the region. It is depicted that in short-run any negative shock in maize productivity is readjusted by average rainfall, area under cultivation and average minimum temperature. The coefficient of average maximum temperature is insignificant revealing that there is no significant effect of average maximum temperature on maize crop in the southern climatic region of Khyber Pakhtunkhwa.
Diagnostic and stability test for ARDL model
The calculated value of F-statistic (4.53), in Table 7, is higher than the F-statistic tabulated upper bound values of 4.05, 3.39 and 3.08 at 1 percent, 5 percent and 10 percent level of significance, respectively. The existence of long-run relationship among variables can be concluded from the results.
Table 7: ARDL F-bound test and diagnostic test.
| Wald Test: | |||
| Test Statistic | Value | df | Probability |
| F-statistic | 4.539342 | (4, 65) | 0.0027 |
| Significance Level | Lower bound value | Upper Bound Value | |
| 1 percent level | 2.70 | 4.05 | |
| 5 percent level | 2.24 | 3.39 | |
| 10 percent level | 1.98 | 3.08 | |
Figure 1 and 2 shows the CUSUM and CUSUMSQ graphs for the model. The figures show that estimates remain stable at 5 percent level of significance during the period under consideration, as the CUSUM and CUSUMSQ lines are drawn within critical region. It is deduced from the tests that the estimated model is stable.
Conclusions and Recommendations
In KP, area under cultivation is the only variable which affect maize productivity, in the long-run. The climatic variables have insignificant effects in long-run except average minimum temperature. Similarly, in short-run, area under cultivation is the only variable having significant effect on maize productivity in KP.
In northern climatic region, average precipitation in short-run has highly negative effect on productivity of maize. While in the long-run, it has highly positive effect on the crop. In the long-run, average minimum temperature has insignificant effect of on maize crop, while its short-run effect is highly positive. The effect of rise in average maximum temperature has negative effect on crop productivity while the short-run effects are positive. In the central climatic region, the effect of precipitation on productivity of maize is negative in long-run while in short-run, it has insignificant effect on the crop. The effect of average minimum temperature on crop productivity, in long-run, is positive, while the short-run effect is insignificant. The effect of average maximum temperature is insignificant on maize in long-run as well as in the short-run. In the southern climatic region, the effect of precipitation for the maize crop is highly positive in the long-run, while the short-run effect of precipitation is negative. Similarly, average minimum temperature negatively affects the productivity of maize crop. While in short-run, it negatively affects the maize crop. Increase in arable land, advanced irrigation system, plantation, awareness and education of farmer, and high yielding weather resistant seeds are some of the remedies that will mitigate the adverse effects of climate change.
Information about the variations in time of tilling and harvesting for different regions, along with education of farmer and strategies for land and water management will mitigate the effects of climate change. Moreover, specific crop incentives, crop insurances and easy credits conditions are introduced for farmers to cope with the varied climate conditions.
Author’s Contribution
Muhammad Ashfaq: Principal author who conducted research, collected data and did final analysis.
Inayatullah Jan: PhD advisor, who provided guidelines and improved final draft of the manuscript.
Novelty Statement
This research highlights the short-run and long run effects of climate change on productivity of maize in Khyber Pakhtunkhwa (KP) province of Pakistan.
References
ADB. 2009. Building climate resilience in the agriculture sector in Asia and in the Pacific. Ann. Dev. Rep. 9.
Baltagi, B.H. 2008. Forecasting with panel data. J. For. 27(2): 153-173. https://doi.org/10.1002/for.1047
Bandara, J.S. and C. Yiyong. 2014. The impact of climate change on food crop productivity, food prices and food security in South Asia. Griffith Bus. School, Queensland. 4111, Australia. https://doi.org/10.1016/j.eap.2014.09.005
Brown and Stephen. 1975. Global warming policy: some economic implication. Fed. Res. Bank Dallas. Eco. Rev. 4th Quarter.
GoP. 2009. Pakistan economic Survey, Ministry of finance, Islamabad.
GoP. 2018. Pakistan Economic Survey, Ministry of Finance, Islamabad.
Greene, W.H. 2008. Econometrics analysis. Upper Saddle River, N.J.
Hsiao, C. 2014. Analysis of panel data. Camb. Univ. Press. https://doi.org/10.1017/CBO9781139839327
Hoang, Y. and T. Barker. 2012. The clean development mechanism and low carbon development: A panel data analysis. En. Eco. 34(4): 1033-1040. https://doi.org/10.1016/j.eneco.2011.08.010
Liew. 2004. Which lag length selection criteria should we employ? Eco. Bul. 3(33): 55-88.
Nadeem, S.K. Munir. 2016. Energy consumption and economic growth in Pakistan: A sectoral analysis. MPRA. 74569.
PARC. 1982. Consumptive use of water for crops in Pakistan, Islamabad.
Pesaran, M.H., Y. Shin. 1999. An autoregressive distributive lag modeling approach to cointegration analysis. Econometric and economic theory in the 20th century, Camb. Univ. Press, UK.
UNFCCC. 2007. Climate change: Impacts, vulnerabilities and adaptation in developing countries. UN.
UNFCCC. 2011. Climate change: Impacts, vulnerabilities and adaptation in developing countries. UN.
WB. 2013. Turn Down the Heat: Climate extremes, regional impacts, and the case for resilience. World Bank, Washington, DC.
Zafar, S. and A. Shahzad. 2012. Climate change, its impact on food security and its implications (A case study of Pakistan), SANEI working paper, SA Network Econ. Res. Inst. Dhaka, 12-10.


