

Effect of Selected Variables Identified by Mars on Fattening Final Live Weight of Crossbred Beef Cattle in Eastern Turkey


Effect of Selected Variables Identified by Mars on Fattening Final Live Weight of Crossbred Beef Cattle in Eastern Turkey
Yakup Erdal Erturk1, Adem Aksoy2 and Mohammad Masood Tariq3,*
1Department of Agricultural Economics, Agricultural Faculty, Igdir University, Igdir, Turkey
2Department of Agricultural Economics, Agricultural Faculty, Ataturk University, Erzurum, Turkey
3Centre of Advanced Studies in Vaccinology and Biotechnology, University of Balochistan, Quetta, Pakistan
ABSTRACT
The main aim of the present work was to determine potential factors that influence average fattening final live weight (AFFLW) per enterprise for crossbred cattle reared in beef cattle enterprises in North East Anatolia region (comprising Erzurum, Igdir, Kars and Agri provinces) of Turkey. For this goal, Multivariate Adaptive Regression Splines (MARS), a-non parametric regression technique, was used to develop a respectable prediction equation that can denote interaction effects of influential predictors in the definition of the influential factors on AFFLW as an output variable for male and female crossbred cattle. Several predictors in the current survey were province (Erzurum, Igdir, Kars and Agri), farmer age, educational level (illiterate, primary school, secondary school, high school, and college), social security (available and unavailable), husbandry experience of farmer (year), farmer`s irrigated, dry and pasturage land, live weight before fattening, and fattening period. Predictive accuracy of MARS algorithm was evaluated using coefficient of determination (R2), Standard Deviation Ratio (SDRATIO), Generalized Cross Validation (GCV) and Pearson`s correlation (r) between actual and predicted AFFLW. Pearson`s correlation coefficients between actual and predicted AFFLW for male and female crossbred cattle were very strongly estimated (r~1.00, P<2.2e-16). Results of MARS, giving a very good fit for 2nd interaction order, denoted that almost all of the variability in AFFLW per enterprise was explained based on the lowest GCV. In this study, social factors (farmer’s age, experience, province, educational level, social security status, and aim in performing animal production), economic factors (dry land, irrigated land, and pasturage land of the farmer) and biological factors (first live weight before fattening, and fattening period of the beef cattle) were found as influential factors on fattening final live weight in the crossbred beef cattle. The achieved results suggested that interaction effects of influential predictors entered into MARS prediction equation could change AFFLW per enterprise.
Article Information
Received 26 October 2017
Revised 09 December 2017
Accepted 13 January 2018
Available online 19 June 2018
Authors’ Contribution
AA conceived and designed the study and collected the data. YEE statistically analysed the data. YEE and MMT interpreted the data and wrote the manuscript.
Key words
Fattening, Beef cattle, MARS, North East Anatolia.
DOI: http://dx.doi.org/10.17582/journal.pjz/2018.50.4.1403.1412
* Corresponding author: [email protected]
0030-9923/2018/0004-1403 $ 9.00/0
Copyright 2018 Zoological Society of Pakistan
Introduction
Red meat is a rich animal protein source that meets requirements of humans on basic essential amino acids. In this respect, cattle rearing, which is an important influence on Gross Domestic Product (GDP) of countries, is not only a remarkable option to meet the requirements in the world, but also to positively provide rural development in the countries of the world. Ecologic and geographic structure of Turkey is suitable for cattle breeding. However, Aksoy and Yavuz (2008) reported that leading region of Turkey in traditional cattle breeding is North Eastern Anatolia Region. Moreover, owning quality and large meadows appropriate for cattle breeding gives region a prominence (Table I). Forage crops are grown in 26.8% of total cultivated field in the region whereas the proportion of Turkey is only 5.4%. North Eastern Anatolia Region contains Ağrı, Iğdır, Kars and Erzurum which are the least developed provinces of Turkey. However, it is seen that applied policies and supports did not contribute to the region to develop and owing to this, the gap between the region and other regions increases (Polat, 2017). Cattle breeding in the region (Table II) is consisting of low productive domestic species; meadow based breeding conditions and limited input use (Ertuğrul et al., 2010). While culture species proportion of Turkey is 46.8%, it is very low in the region as 15.0%. Thus, it is important to find out the most employing sector of the region in terms of revealing current situation, present problems and solution suggestions of cattle breeding therein (Cozzi, 2007; Anonymous, 2011), which is possible with selecting most influential demographic, socio-economic, managerial factors as well as enterprise-based factors on cattle breeding. To preciously describe significant ones among the mentioned factors and to accurately make interpretations on cattle breeding, selection of powerful statistical analysis techniques viz. data mining methods Classification and Regression Tree (CART) (Ali et al., 2015; Kowalchuk et al., 2017), Chi-Square Automatic Interaction Detection (CHAID) (Eyduran et al., 2016, 2017a; Orhan et al., 2016; Akin et al., 2017a, b, c; Duru et al., 2017), Exhaustive CHAID (Eyduran et al., 2013) and Multivariate Adaptive Regression Splines (MARS) is very important. Among those, MARS is a robust and non-parametric regression technique that illustrates non-linear and interaction effects of the significant factors on its prediction equation and was used insufficiently in literature (Eyduran, 2016; Karadas et al., 2017; Eyduran et al., 2017b).
Table I.- Fields of plantations and forage crops located in Turkey and North East Anatolia region (Decar).
|
Cultivated agricultural area |
Forage crops |
Forage crops ratio (%) |
|
| Northeast Anatolia |
12 414 458 |
3 330 692 |
26.83 |
|
Turkey |
237 625 724 |
12 998 885 |
5.47 |
Table II.- Number of cattle in Northeast Anatolia and Turkey (2016).
| Breed |
North East Anatolia |
Turkey |
||
|
n |
% |
n |
% |
|
| Culture |
301029 |
15.0 |
6588527 |
46.8 |
| Crossbred |
1389352 |
69.2 |
5758336 |
40.9 |
| Domestic |
318546 |
15.9 |
1733292 |
12.3 |
| Total |
2008927 |
100.0 |
14080155 |
100.0 |
There are a limited number of studies on cattle breeding. Among the previous studies, Marle (1974) reported the data on past, present and future situations of beef cattle breeding in South Africa. Cozzi (2007) reported current situation and subsequent challenges of beef cattle breeding in Italy. Ozkan and Erkus (2003) revealed economic parameters regarding gross product values, average daily live weight gain and net return and farm income per head etc. in cattle fattening. Pacheco et al. (2014) made risk evaluation for beef cattle in terms of feedlot. Ertek et al. (2016) evaluated the factors affecting the cooperative membership of the beef producers. Ozden and Armagan (2014) made efficiency analysis regarding cattle fattening in Turkey. Umar et al. (2008) focused on small-scale beef fattening enterprises in Nigeria. Koknaroglu et al. (2006) determined the effect of concentrate level on beef cattle performance and profitability in beef cattle farms in Afyon province, Turkey. Muižniece and Kairiša (2016) comparatively revealed affecting fattening performances of Blonde d’Aquitaine, Hereford, Simmental and crossbred bulls in organic farming conditions.
Many factors are obtainable in final fattening live weight in beef cattle breeding; namely, animal age, breed, gender, ration, rearing systems (domestic, culture and crossbred), first fattening live weight before fattening, and managerial conditions etc. (Aytekin et al., 2017). Rahman et al. (2012) comprehensively examined main factors viz. vaccination status, breed type, fattening period, training and technological supports related to fattening for small-scale beef fattening farms in Bangladesh and evaluated age, education level, occupation and capital sources of farmers. Muižniece and Kairiša (2016) evaluated fattening performances (AFFLW) of some crossbred and exotic bulls reared in organic farming system in Latvia, and addressed the influence of breed, age, and live weight before fattening on fattening final live weight. Aytekin et al. (2017) predicted AFFLW from fattening period and morphological traits measured from 103 young bulls of native, crossbred and cultural breeds through MARS algorithm and mentioned the importance of genotype and fattening period in explaining the variability in AFFLW.
In Turkey and North East Anatolia Region, several reports were present on structural analysis of cattle breeding sector (Örüng and Karaman, 2002; Cukur and Saner, 2006; Uzal and Uğurlu, 2006; Han and Bakır, 2009; Aydın, 2011; Er and Özçelik, 2016). Abo Elfadl et al. (2015) addressed that it is indispensable that economic, biological and social factors should be inspected together for getting the greatest production level of the beef cattle. To reveal the effect of these addressed factors on fattening performance (AFFLW) of the beef cattle, more comprehensive studies is still required. However, more detailed information about the main factors affecting AFFLW in crossbreed beef cattle enterprises has not yet been documented for Ardahan, Agri, Iğdır and Kars provinces of Turkey. Therefore, the aim of this survey was to describe potential factors that influence AFFLW per enterprise for crossbred cattle reared in beef cattle enterprises in North East Anatolia region comprising Erzurum, Igdir, Kars and Agri provinces of Turkey using MARS. The second aim was to develop a remarkable prediction model for AFFLW, of primarily importance economically.
Materials and methods
Data collection and sampling
The present survey was conducted to identify possible factors affecting AFFLW per enterprise for crossbred cattle on 119 crossbred beef cattle enterprises in Eastern Anatolia region comprising Erzurum (10), Iğdır (25), Kars (53) and Ağrı (31) provinces in Turkey. A questionnaire study was performed using Random Sampling Method. The period of the study was between August and October months of the year 2015. In this study, there is a traditional housing type for most of beef cattle enterprises. Brown-Swiss and Eastern Anatolia Red crossbred F1 cattle were rearing mostly.
Variable structure
AFFLW per enterprise was considered as an output variable. Several predictors in the current survey were: farmer’s Province (Erzurum, Igdir, Kars and Agri), farmer’s age (year), farmer’s educational level (illiterate, primary school, secondary school, high school, and college), farmer’s social security (available and unavailable), farmer’s experience in animal husbandry (year), farmer`s irrigated land (da), farmer`s dry land (da), farmer`s pasturage land (da), live weight before fattening of the crossbred beef cattle (kg) and fattening period of the crossbred beef cattle (day).
Statistical analysis
Known as a powerful non-parametric regression approach, MARS algorithm was developed by Friedman (1991) for describing the complex relationship between sets of predictors and response variable(s). No assumptions about functional relationships between response and predictors are found for the algorithm, which is a divide-and-conquer strategy where the training data sets are split into piecewise linear segments (splines) of different slopes. The splines are linked smoothly to each other and, basis functions as piecewise curves permit researches to recognize linear, non-linear and interaction effects of influential predictors. Knots are the point connections between the pieces. The candidate knots were assigned at random location inside the defined range of each predictor. MARS yields the basis functions as a result of considering all likely candidate knots and interaction effects among predictors depending upon a stepwise procedure. To simplify pairs of the basis functions, the forward procedure forms the possible knots at random location within the range of each predictor. The MARS model at each of stages causes to form the knots and their pairs of the basis functions in order to decline error variance. Until the complex MARS model is constructed, the procedure about involving the basis functions carries on. The redundant terms providing an improperly contribution to the MARS model are excluded from the constructed model with the aid of the backward procedure in the MARS (Zhang and Goh, 2016).
The MARS model can be rewritten as follows:
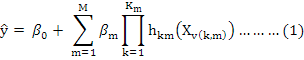
Where, ŷ is the predicted value of the response variable, β0 is a constant, hkm(Xv(k,m)) is the basis function, in which v(k, m) is an index of the predictor employed in the mth component of the kth product and Km is the parameter limiting the order of interaction.
Afterwards constructing the most complex MARS model, the redundant basis functions were removed by pruning process depending upon the following generalized cross-validation error (GCV):
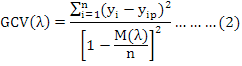
Where, n is the number of training cases, yi is the observed value of a response variable, yip is the predicted value of a dependent variable and M (λ) is a penalty function for the complexity of the model containing λ terms.
Formulas of the model evaluation criteria for estimating their predictive performance of the MARS algorithms are given below:
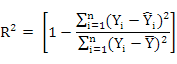
Coefficient of Determination
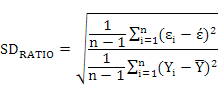
Standard Deviation Ratio
Pearson correlation coefficient between actual and predicted values in AFFLW (Kovalchuk et al., 2017, 2018; Akin et al. 2018).
Where, Yi is the actual or observed AFFLW (kg) value of ith enterprise, Ŷi is the predicted AFFLW of ith enterprise, Ῡ is the average of the AFFLW values of enterprise, ɛi is the residual value of ith enterprise, έi is the average of the residual values, k is the number of terms in the MARS model, and n is the total enterprise number. The residual value of each enterprise is expressed as ɛi = Yi – Ŷi.
In the 10-fold cross-validation, the whole data set in the MARS algorithm was randomly divided into equal ten parts from which nine were employed to train a given type of a prediction model and one served as an independent test set. This procedure was repeated 10 times. Accordingly, each part of the original data set was employed as a test set exactly once and each of the 10 iterations produced a separate prediction model. See Grzesiak and Zaborski (2012) for obtaining more detailed information.
Table III.- Results of the MARS data mining algorithm for male crossbred beef cattle.
| Basis functions | Coefficients |
|
Intercept PROVINCE_Kars EDUL_highschool max(0, 47-FARMERAGE) max(0, FARMERAGE-47) max(0, 15-EFAP) max(0, EFAP-15) max(0, 120-FATPERIOD) max(0, FATPERIOD -120) max(0, FIRSTLIVEWEIGHT-190) max(0, 250-FIRSTLIVEWEIGHT) max(0, FIRSTLIVEWEIGHT-250) PROVINCE_Kars * max(0, 250-FIRSTLIVEWEIGHT) max(0, FARMERAGE-47) * EFAP EDUL_secondaryschool * max(0, FIRSTLIVEWEIGHT-190) EDUL_secondaryschool * max(0, 250-FIRSTLIVEWEIGHT) EDUL_college * max(0, FIRSTLIVEWEIGHT-250) SOCSEC_unavailable * max(0, EFAP-15) SOCSEC_unavailable * max(0, FIRSTLIVEWEIGHT-250) max(0, 15-EFAP) * FATPERIOD APAP_home&trade * max(0, 250-FIRSTLIVEWEIGHT) ILF * max(0, 250-FIRSTLIVEWEIGHT) FATPERIOD * max(0, 250-FIRSTLIVEWEIGHT) |
196.917470 44.438404 16.391142 -2.656628 36.065672 4.785194 -4.673522 0.493280 0.134186 3.858836 -0.512110 -3.844703 -0.560515
-0.643221
-1.257278 0.259716
4.341465
-5.395561 -2.094940
-0.064268 0.307794
-0.010581 0.005717 |
GCV, 93.872; Residual Sum of Squares, 3661; R2, 0.994; PROVINCE, This presents province where farmer lives (Erzurum, Agri, Igdir and Kars); FARMERAGE, Age of Farmer; EDUL, Education Level education level (illiterate, primary_school, secondary_school, high_school and college); SOCSEC, Social Security (available and unavailable). Which aims do you perform animal production? The aim in performing animal production (APAP) To meet home’s needs (home), to trade (trade), home and trade (home&trade). Experience of farmer in Animal production (EFAP). Irrigated land (da) of farmer (ILF). Dry land (da) of farmer= (DLF). Pasturage (da) of farmer= PF. Fattening period (day) of male crossbred beef cattle =FATPERIOD. The first live weight before fattening (kg)=FIRSTLIVEWEIGHT.
The MARS model with the smallest GCV, SDRATIO and the highest coefficient of determination (R2) and Pearson coefficient (r) between observed and predicted values of AFFLW was accepted as the best one. All the statistical evaluations were performed through the package `earth` of R software. The R commands used for the present study were available in the appendix section.
Results and discussion
Male crossbred beef cattle
Results of the MARS data mining algorithm for male crossbred beef cattle are given in Table III. For male crossbred beef cattle, goodness of fit criteria viz. 0.994 R2 and Pearson coefficient (r=0.997, P<2.2 e-16) between predicted and observed AFFLW values of the MARS model with the interaction order of 2 showed a very perfect fit. A SD ratio of 0.078 also supported these results because the SD ratio was found less than 0.10. The GCV value of the MARS model was 93.872. Nearly all of the variability in AFFLW of enterprises was explained very efficaciously.
The term “PROVINCE_Kars” showed that an increase of 44.438404 kg would be expected for AFFLW of male crossbred beef cattle reared by enterprises in Kars province compared with other provinces. The MARS term “PROVINCE_Kars * max(250-FIRSTLIVEWEIGHT)” with the negative coefficient of 0.560515 reflected that AFFLW of male crossbred beef cattle by enterprises in the Kars province was dependent on the first live weight of the male beef cattle before fattening. In the first live weight of the male beef cattle, the lighter than 250 kg, the lighter AFFLW, but when the first live weight of the male crossbred cattle was 250 kg or heavier, the mentioned term could not affect AFFLW because, in the present case, max(0, 250-FIRSTLIVEWEIGHT)=0. AFFLW of the male crossbred beef cattle reared by enterprises with EDUL=high school regardless of their provinces would be expected to show increase by 16.391142 kg. This means that enterprises having EDUL=high school would be more successful in obtaining heavier AFFLW in the male crossbred animals. Whereas, only two terms peculiar to enterprises having EDUL=secondary school are available in the MARS equation equation; EDUL_secondaryschool*max(0, FIRSTLIVEWEIGHT-190) and EDUL_secondaryschool*max(0, 250-FIRSTLIVEWEIGHT). If the first live weight before fattening of the male crossbred beef cattle kept by enterprises whose EDUL was secondary school was 190 kg or heavier, max(0, FIRSTLIVEWEIGHT-190)=0, that is, there was no change in AFFLW, -1.257278*EDUL_secondaryschool*max(0, FIRSTLIVEWEIGHT-190)=0 considering together with the previous term, the term “EDUL_secondaryschool*max(0, 250-FIRSTLIVEWEIGHT)” with the positive coefficient of 0.259716 revealed that when the first live weights of the male crossbred beef cattle reared by enterprises with EDUL= secondary school reduced from 250 to 190 kg, AFFLW would be expected to increasingly obtain more gain. For example, an enterprise having EDUL= secondary school and FIRSTLIVEWEIGHT= 200 kg for the male crossbred animal would be expected to obtain an AFFLW of roughly 13 kg (0.259716*1*max(0, 250-200)) for the term “EDUL_secondaryschool * max(0, 250-FIRSTLIVEWEIGHT)” where EDUL_secondaryschool=1, max(0, 250-200)=50. The term “EDUL_college * max(0, FIRSTLIVEWEIGHT-250)” with the coefficient of 4.341465 displayed that it was very important that enterprises with EDUL=college should prefer male crossbred beef cattle which were much heavier than 250 kg in the first live weight before fattening to obtain more gain.
In the present study, the FIRSTLIVEWEIGHT was determined as a significant source of variation in beef cattle production, which supported the statements of Demircan (2008) and Muižniece and Kairiša (2016). However, in the present analysis, we obtained the effect of FIRSTLIVEWEIGHT on AFFLW changed based on socio-economic factors addressed above.
The term “max(0, FARMERAGE-47)” was determined to be one of the terms whose the coefficient (36.065672) was very high in the MARS prediction equation, which means that farmers who were much older than 47 showed tendency to obtain heavier animals in AFFLW; otherwise, those who were much younger than 47 illustrated to get lighter animals in AFFLW. Another term “max(0, FARMERAGE-47) * EFAP” with the coefficient of -0.643221 means that AFFLW might decrease if FARMERAGE is much younger than 47 whatever EFAP is.
The term “max(0, 15-EFAP)” with the coefficient of 4.785194 depicted that enterprises whose EFAP was much fewer than 15 years could obtain heavier animals in AFFLW, but the term “max(0, 15-EFAP) * FATPERIOD” with the coefficient of -0.064268 regardless of education level, province, etc. showed that EFAP < 15 might vary based on FATPERIOD, adversely. If EFAP > 15, the term “max(0, 15-EFAP) * FATPERIOD” became equal to zero.
When the term “max(0, EFAP-15)” with the coefficient of -4.673522 was taken into consideration, the term was zero for EFAP < 15, but AFFLW reduced more as EFAP was much more than 15.
The term“FATPERIOD * max(0, 250-FIRSTLIVEWEIGHT)” with the coefficient of 0.005717 means that animals which were much lighter than 250 kg in FIRSTLIVEWEIGHT should be exposed to much longer FATPERIOD for obtaining much heavier AFFLW.
It was reported that the effect of FATPERIOD on AFFLW was significant (Aytekin et al., 2017) as also in our study; however, the difference was attributable to the handled predictors, non-genetic and genetic factors, as well as various interaction effects.
When the term SOCSEC_unavailable * max(0, EFAP-15) with the coefficient of -5.395561 was examined, a decrease of -5.395561 would not be expected for those having EFAP ≤15 who were unavailable in SOCSEC.
Aytekin et al. (2017) also used to predicted fattening final live weight from withers height (WH), back height (BH), front rump height (FRH), back rump height (BRH), body length (BL), back rump width (BRW), chest depth (CD), chest circumference (CC) and fattening period in young bulls of crossbred cultural breeds with the greatest predictive accuracy of 0.9717 R2 and 0.9643 Adjusted R2 for MARS algorithm. In the predictive performance of MARS, these earlier results were in agreement with those reported in the present study. However, our present results were found much better than those reported by Bahashwan (2014) for classic regression approaches in Dhofari calves. For male Kamphaengsaen beef cattle, Sawanon et al. (2011) obtained lower predictive accuracy of 0.933 and 0.887 R2 for feedlot and grass fed subgroups. In line with those obtained by Siddiqui et al. (2015) predicting live weight of Sahiwal cattle, the present results were much better when compared to those obtained by Bozkurt et al. (2007), who found the maximum R2 of approx. 0.67 in estimating live weight of the beef cattle, but the results of Paputungan et al. (2015) were in almost agreement with our results.
Female crossbred beef cattle
Results of the MARS data mining algorithm for male crossbred beef cattle are presented in Table IV. For female crossbred beef cattle, 0.996 R2 and Pearson coefficient (r=0.998, P<2.2 e-16) between predicted and observed AFFLW values of the MARS model with the interaction order of 2 showed a very perfect fit. The present SD ratio (0.064), which was less than 0.10, also supported the aforementioned fitting results. The GCV value of the MARS model was 128.94. Approximately all of the variability in the AFFLW for female crossbred beef cattle enterprises was explained in the MARS model constructed here (Table IV).
AFFLW of female crossbred beef cattle reared at enterprises whose education level was high school (EDUL_highschool) would reduce by 130.433138 kg in the second term of MARS prediction equation. When the MARS prediction equation was considered, it was obvious that the effect of enterprises with high school on the AFFLW of the female crossbred beef cattle could be affected negatively based on unavailable social security according to the term: EDUL_highschool * SOCSEC_unavailable. According to EDUL_primaryschool * max(0, ILF-30), we clearly understood the interaction effect between education level and irrigated land (da) of farmer (ILF), which means that the effect of education level on AFFLW rested on irrigated land size that farmers owned. In other words, the AFFLW in female crossbred beef cattle for enterprises with EDUL=high school and ILF< 30 would not be changed because max(0, ILF – 30) = 0 when ILF< 30 da; however, when ILF > 30 for enterprises with EDUL= high school, AFFLW would reduce. For example, a decrease of 0.703876 kg (0.351938*max(0, 32-30)) for those having ILF=32 and EDUL= high school would be expected in the AFFLW of the female crossbred cattle.
When the farmer aimed to perform animal production (APAP), a decrease of 0.077664 kg would be predicted in the AFFLW for enterprises who conducted animal production for APAP= hometrade at the fourth term of the MARS equation model. However, the effect of APAP=hometrade on the AFFLW changed positively based on Erzurum province with the AFFLW of 153.585818 kg for the 17th term, PROVINCE_Erzurum * APAP=hometrade while the 17th term for other provinces became equal to zero. When enterprises with APAP=home was examined, the joint effect of APAP=home on the AFFLW would be expected to change based on EFAP. When EFAP was 15 or greater for enterprises with APAP=home, it was evidence that there was not any negative change in the AFFLW because in this case, max(0, EFAP-15)= 0. For the term APAP_home * max(0, 400-FIRSTLIVEWEIGHT), when the first live weight before fattening was lighter than 400 kg, a decrease would be expected for the AFFLW of female crossbred cattle reared by enterprises with APAP=home. When enterprises for APAP=trade was examined, the term “APAP_trade * max(0, 50-ILF)” showed that the effect of APAP=trade on the AFFLW could be changed based on ILF size of enterprises who reared female crossbred cattle. The lower than 50 da, the lighter AFFLW, inferring that the gain will be reduced more. It could be suggested that ILF size should be 50 da at least for enterprises with APAP=trade.
MARS results displayed that farmer’s experience in animal production (EFAP) affected the AFFLW for enterprises rearing female crossbred beef cattle. The terms “max(0,15-EFAP)” and “max(0, EFAP-15)” were scrutinized, the AFFLW would be expected to increase for enterprises who had EFAP longer than 15 years. However, the term “PROVINCE_Igdir * max(0, 15-EFAP)” reflected that enterprises younger than 15 years in only Iğdir province would be more successful in increasing the AFFLW. For instance, when the mentioned term was
Table IV.- Results of the MARS data mining algorithm for female crossbred beef cattle.
| Basis functions | Coefficients |
|
Intercept EDUL_highschool SOCSEC_unavailable APAP_home&trade max(0,15-EFAP) max(0, EFAP-15) max(0, ILF-30) max(0, 50-ILF) max(0, ILF-50) max(0, 50-DLF) max(0, DLF-50) max(0, 150-FATPERIOD) max(0, FATPERIOD-150) max(0, FIRSTLIVEWEIGHT-200) max(0, 400-FIRSTLIVEWEIGHT) max(0, FIRSTLIVEWEIGHT-400) PROVINCE_Erzurum * APAP_home&trade EDUL_highschool * SOCSEC_unavailable PROVINCE_Erzurum * max(0, 400-FIRSTLIVEWEIGHT) PROVINCE_Erzurum * max(0, FIRSTLIVEWEIGHT-400) PROVINCE_Igdir * max(0, 15-EFAP) PROVINCE_Igdir * max(0, DLF-50) PROVINCE_Kars * max(0, ILF-30) PROVINCE_Kars * max(0, DLF-50) FARMERAGE * max(0, FIRSTLIVEWEIGHT-400) EDUL_primaryschool * max(0, ILF-30) EDUL_highschool * max(0, 50-ILF) SOCSEC_unavailable * max(0, 15-EFAP) SOCSEC_unavailable * max(0, ILF-50) SOCSEC_unavailable * max(0, 400-FIRSTLIVEWEIGHT) max(0, EFAP-15) * APAP_home EFAP * max(0, 50-ILF) max(0, 15-EFAP) * PF EFAP * max(0, 400-FIRSTLIVEWEIGHT) APAP_home * max(0, 400-FIRSTLIVEWEIGHT) APAP_trade * max(0, 50-ILF) ILF * max(0, FIRSTLIVEWEIGHT-400) DLF * max(0, 150-FATPERIOD) DLF * max(0, 400-FIRSTLIVEWEIGHT) FATPERIOD * max(0, FIRSTLIVEWEIGHT-400) |
74.719946 -130.433138 -195.320129 -0.077664 -11.254729 0.537782 18.000921 11.325036 -17.785516 1.792578 -0.029076 -1.018032 -0.166832 0.647252 -0.923746 -0.635339 153.585818 -222.753297 0.983624
1.318302
10.663193 -0.939699 0.064555 -0.155093 0.035471
-0.351938 4.866173 177.103640 -0.307944 1.219412
-7.125798 -0.112649 0.045156 -0.003603 -0.015002
-0.701537 0.001429 0.004902 0.000682 -0.007641 |
GCV, 128.94; Residual Sum of Squares, 8639; R2, 0.996. For abbreviations, see Table III.
considered, AFFLW for those having EFAP=10 years in Iğdır province would increase by 10.663193*1*max(0, 15-10)=53.315965 kg where PROVINCE_Igdir=1 and max(0, 15-10)=5. Also, the term“SOCSEC_unavailable * max(0, 15-EFAP)” illustrated that enterprises whose EFAP was younger than 15 years with SOCSEC=unavailable would be expected to be heavier animals in AFFLW. This means that those having EFAP shorter than 15 years should work more hardly to obtain much more gain. The term “EFAP * max(0, 400-FIRSTLIVEWEIGHT)” depicted that, it was important that first live weight before fattening should be 400 kg at least, regardless of EFAP because the contribution of the term to the AFFLW of enterprises rearing female crossbred cattle became equal to -0.003603*EFAP* max(0, 400-FIRSTLIVEWEIGHT). Coefficients of “max(0, ILF-30)”, “max(0, 50-ILF)” were 18.000921 and 11.325036, which means that 30 < ILF < 50 da should be for providing positive contribution to the AFFLW of those rearing female crossbred beef cattle. The term “PROVINCE_Kars * max(0, ILF-30)” whose coefficient was 0.064555 indicated that lower bound of ILF size should be exceed to 30 da for increasing the AFFLW of enterprises in Kars province, but ILF size should not be to more closer to 50 da. The term “EDUL_primaryschool * max(0, ILF-30)” whose coefficient was -0.351938 depictured that ILF should be 30 da at least to prevent the reducement of the AFFLW for those with EDUL=primary school. When the term “EDUL_highschool * max(0, 50-ILF)” with the coefficient of 4.866173 was taken into consideration, ILF should be than larger 30 da but not be more closer to 50 da to increase the AFFLW in female crossbred beef cattle for those with EDUL= high school.
The term “max(0, 15-EFAP) * PF” with the coefficient of 0.045156 inferred that it was significant that enterprises whose EFAP was a lot shorter than 15 years should increase PF size to increase the AFFLW for female crossbred beef cattle. The terms “max(0, 50-DLF)” “max(0, DLF-50)” with the coefficients of 1.792578 and -0.029076 displayed that it was imperative that DLF should be much lower than 50 da for enterprises who reared female crossbred beef cattle because the coefficient (1.792578) of the term“max(0, 50-DLF)” was positive and greater, meaning to be the more contribution to the AFFLW in those animals. This finding was also in agreement with those obtained from the terms of “PROVINCE_Igdir * max(0, DLF-50)” and “PROVINCE_Kars * max(0, DLF-50)”.
Bene et al. (2007) recorded much lower performance in predictive accuracy of approx. 0.70 R2 in the prediction of body weight by haunch width, rump height and shoulder width for Hungarian beef cows compared to our MARS results.
This may be attributed to different predictors, sample size, interaction effects of predictors, breed, gender, first fattening live weight, managerial situations and especially use of MARS application, which was not used previously for similar studies. For further studies, other important factors that significantly influence fattening performance viz. calving season, age before fattening, plane of nutrition during fattening, veterinary services, management and diseases, genotypes of animals used in crossbreeding, nutritional status before fattening, length of fattening period, and extension services can be also included. Whereas, earlier authors highlighted that farmer’s age, educational level, and the number of animals were potential significant predictors in cattle enterprises in Turkey (Uzal and Uğurlu, 2006; Aksoy and Yavuz, 2012; Er and Özçelik, 2016).
Abo Elfadl et al. (2015) emphasized that socio-economic and biological factors should be considered jointly for AFFLW in ensuring desirable production level for the beef cattle enterprises, which confirmed the present results here. Papa and Kume (2010) mentioned genetic levels of the crossbred cattle to be a significant source of variation for AFFLW.
Conclusion
The current work is the first statement to describe factors affecting the AFFLW of crossbred beef cattle for Eastern Anatolia Region of Turkey. Present results displayed that social factors (farmer’s age, experience, province, educational level, social security status, and aim in performing animal production), economic factors (dry land, irrigated land, and pasturage land of the farmer) and biological factors (first live weight before fattening, and fattening period of the cattle) were found as influential factors on fattening final live weight in the crossbred beef cattle. As a result, we recommend for breeder and decision makers to jointly consider these three main factors. MARS data mining algorithm is advised for obtaining more reliable results and making more accurate interpretation.
Statement of conflict of interest
Authors have declared no conflict of interest.
References
Abo Elfadl, E.A., Fardos, A.M. and Radwan, H.A.A., 2015. Quantitative methods to determine factors affecting productivity and profitability of beef fattening enterprises in Egypt. Glob. Vet., 14: 77-82.
Akin, M., Eyduran, E. and Reed, B.M., 2017a. Use of RSM and CHAID data mining algorithm for predicting mineral nutrition of hazelnut. Pl. Cell Tiss. Organ Cult., 128: 303-316. https://doi.org/10.1007/s11240-016-1125-z
Akin, M., Eyduran, E. and Reed, B.M., 2017b. Developing of optimal tissue culture medium for Hazelnuts. IX. International Congress on Hazelnut, 15-19 August, Atakum, Samsun, Turkey.
Akin, M., Eyduran, E. Niedz, R.P. and Reed, B.M., 2017c. Developing hazelnut tissue culture medium free of ion confounding. Pl. Cell Tiss. Cult., 130: 483-494.
Akin, M., Hand, C., Eyduran, E. and Reed, B.M., 2018. Predicting minor nutrient requirements of hazelnut shoot cultures using regression trees. Pl. Cell Tiss. Cult., 132: 545:559.
Aksoy, A. and Yavuz, F., 2008. An Analysis on accordance to European Union and animal husbandry farms: The case of Eastern Anatolia. Turkish J. Agric. Econ., 14: 37-45
Ali, M., Eyduran, E., Tariq, M.M., Tirink, C., Abbas, F., Bajwa, M.A., Baloch, M.H., Nizamani, A.H., Waheed, A., Awan, M.A., Shah, S.H., Ahmad, Z. and Jan, S., 2015. Comparison of artificial neural network and decision tree algorithms used for predicting live weight at post weaning period from some biometrical characteristics in Harnai sheep. Pakistan J. Zool., 47: 1579-1585.
Anonymous, 2011. Eastern Anatolia region cattle breeding. Serhat Development Agency, pp. 21-22.
Aydın, E., 2011. Economic analysis of cattle fattening enterprises in Kars and Erzurum Provinces. Doctorate thesis, Institute of Health Sciences, Ankara University, Ankara.
Aytekin, I., Eyduran, E., Koksal, K., Akşahan, R. and Keskin, I., 2017. Prediction of fattening final live weight from some body measurements and fattening period in young bulls of crossbred and exotic breeds using MARS data mining algorithm. Pakistan J. Zool., 50: 189-195.
Bahashwan, S., 2014. Application of morphometric traits for live body weight estimation in Dhofari calves. Int. J. Scient. Res. Agric. Sci., 1: 90-96. https://doi.org/10.12983/ijsras-2014-p0090-0096
Bene, S., Nagy, B., Nagy, L., Kiss, B., Polgar, J.P. and Szabo, F., 2007. Comparison of body measurements of beef cows of different breeds. Arch. Tierz., 50: 363-373. https://doi.org/10.5194/aab-50-363-2007
Bozkurt, Y., Aktan, S. and Ozkaya, S., 2007. Body weight prediction using digital image analysis for slaughtered beef cattle. J. appl. Anim. Res., 32: 195-198. https://doi.org/10.1080/09712119.2007.9706877
Cozzi, G., 2007. Present situation and future challenges of beef cattle production in Italy and the role of the research. Italian J. Anim. Sci., 6: 389-396.
Cukur, F. and Saner, G., 2006. Analysis of beef cattle sector in Aegean region and its adaptation of European Union: Case study of İzmir province, Turkey VII. Agricultural Economics Congress, Antalya, Turkey.
Demircan, V., 2008. The effect of initial fattening weight on sustainability of beef cattle production in feedlots. Spanish J. agric. Res., 6: 17-24. https://doi.org/10.5424/sjar/2008061-290
Duru, M., Duru-Arslan, A., Karadas, K., Eyduran, E., Cinli, H. and Tariq, M.M., 2017. Effect of carrot (daucus carota) leaf powder on external and internal egg characteristics of Hy-Line White laying hens. Pakistan J. Zool., 49: 125-132. https://doi.org/10.17582/journal.pjz/2017.49.1.125.132
Eyduran, E., 2016. The possibility of using data mining algorithms in prediction of live body weights of small ruminants. Adv. Cal Anal., 1: 18-21.
Eyduran, E., Keskin, I., Erturk, Y.E., Dag, B., Tatliyer, A., Tirink, C., Aksahan, R. and Tariq, M.M., 2016. Prediction of fleece weight from wool characteristics of sheep using regression tree method (CHAID algorithm). Pakistan J. Zool., 48: 957-960.
Er, S. and Özçelik, A., 2016. The examination of economic structure of cattle fattening farms in Ankara province by factor analysis. YYU J. agric. Sci., 26: 17-25.
Ertek, N., Demir, N. and Aksoy, A., 2016. Analysis of the factors affecting the cooperative membership of the cattle enterprises: the case of TRA region. Alınteri J. agric. Sci., 30: 38-45.
Ertuğrul, M., Savaş, T., Dellal G., Taşkın T., Koyuncu, M., Cengiz, F., Dağ, B., Koncagül, S. and Pehlivan, E., 2010. Improving sheep and goats production in Turkey. Agricultural Engineering VII. Technical Congress, 11-15 Jan., Ankara, Turkey.
Eyduran, E., Yilmaz, I., Kaygisiz, A. and Aktas, Z.M., 2013. An investigation on relationship between lactation milk yield, somatic cell count and udder traits in first lactation Turkish Saanen goat using different statistical techniques. J. Anim. Pl. Sci., 23: 731-735.
Eyduran, E., Zaborski, D., Waheed, A., Celik, Ş., Karadas, K. and Grzesiak, W., 2017a. Comparison of the predictive capabilities of several data mining algorithms and multiple linear regression in the prediction of body weight by means of body measurements in the indigenous Beetal goat of Pakistan. Pakistan J. Zool., 49: 257-265. https://doi.org/10.17582/journal.pjz/2017.49.1.257.265
Eyduran, E., Akkus, O., Kara, M.K., Tirink, C. and Tariq, M.M., 2017b. Use of multivariate adaptive regression splines (Mars) in predicting body weight from body measurements in Mengali Rams. International Conference on Agriculture, Forest, Food Sciences and Technologies, Cappadocia, Turkey.
Grzesiak, W. and Zaborski, D., 2012. Examples of the use of data mining methods in animal breeding. In: Data mining applications in engineering and medicine (ed. A. Karahoca). InTech. https://doi.org/10.5772/2616
Han, Y. and Bakır, G., 2009. Structure of private beef farms and affecting factors. J. Facul. Agric., 40: 71-78.
Karadas, K,, Tariq, M., Tariq, M.M. and Eyduran, E., 2017. Measuring predictive performance of data mining and artificial neural network algorithms for predicting lactation milk yield in indigenous Akkaraman sheep. Pakistan J. Zool., 49: 1-7. https://doi.org/10.17582/journal.pjz/2017.49.1.1.7
Kornacki, J. and Ćwik, J., 2005. Statystczyn systemy uczqce sie. Wyd. Nauk.-Techn., Warszawa, pp. 90-95.
Kovalchuk, I.Y., Mukhitdinova, Z., Turdiyev, T. Madiyeva, G., Akin, M., Eyduran, E., and Reed, B.M., 2017. Modeling some mineral nutrient requirements for micropropagated wild apricot shoot cultures. Pl. Cell Tiss. Organ Cult., 129: 325-335. https://doi.org/10.1007/s11240-017-1180-0
Kovalchuk, I.Y., Mukhitdinova, Z., Turdiyev, T., Madiyeva, G., Akin, M., Eyduran, E. and Reed, B.M. 2018. Nitrogen ions and nitrogen ion proportions impact the growth of apricot (Prunus armeniaca) shoot cultures. Pl. Cell Tiss. Cult., 133: 263–273. https://doi.org/10.1007/s11240-018-1379-8
Koknaroglu, H., Yılmaz, H. and Demircan, V., 2006. Effect of concentrate level on beef cattle performance and profitability in Afyon province. Süleyman Demirel Univ. J. Agric. Sci., 1: 41-52.
Marle, J.V., 1974. The breeding of beef cattle in South Africa: Past, present and future. S. Afr. J. Anim. Sci., 4: 297-304.
Muižniece, I. and Kairiša, D., 2016. Different beef breed cattle fattening results analysis. Res. Rural Develop., 1: 57-62.
Orhan, H., Eyduran, E., Tatliyer, A. and Saygici, H., 2016. Prediction of egg weight from egg quality characteristics via ridge regression and regression tree methods. R. Bras. Zootec., 45: 380-385. https://doi.org/10.1590/S1806-92902016000700004
Örüng, I. and Karaman, S., 2002. A Research on the existing conditions properties and development possibilities of the beef cattle enterprises in Tokat province. J. Agric. Facul. Gaziosmanpaşa Univ., 19: 103-111.
Ozden, O. and Armagan, G., 2014. Efficiency analysis on cattle fattening in Turkey. Vet. Med. Zoot. T, 67: 88-93.
Özkan, U. and Erkuş, A., 2003. Economic analysis of cattle fattening farms in Bayburt province. Agricultural Economics Research Institute. Publish Number, (103), Ankara, Turkey.
Pacheco, P.S., Pascoal, L.L., Restle, J., Vaz, F.N., Arboitte, M.Z., Vaz, R.Z., Santos, J.P.A. and Oliveira, T.M.L., 2014. Risk assessment of finishing beef cattle in feedlot: Slaughter weights and correlation amongst input variables. R. Bras. Zootec., 43: 92-99. https://doi.org/10.1590/S1516-35982014000200007
Papa, L. and Kume, K., 2010. The effect of Holstein x meat cattle breeds crosses (F1) on meat production increasing in small scale farms conditions. J. Tekirdag Agric. Facul., 7: 49-55.
Paputungan, U., Hakim, L., Ciptadi, G. and Lapian, H.F.N., 2015. Application of body volume formula for predicting live weight in Ongole crossbred cows. Int. J. Livest. Prod., 6: 35-40. https://doi.org/10.5897/IJLP2014.0243
Polat, M., 2017. The effects of the livestock industry on the economic development of the Region TRA2. Int. J. Soc. Sci. Edu. Res., 3: 631-643.
Rahman, Z., Hossain, M.M., Hashem, M.A., Azad, M.A.K. and Khatun, H., 2012. Factors related to small scale beef fattening programs in Dinajpur district of Bangladesh. Progr. Agric., 23: 33-38.
Sawanon, S., Boonsaen, P. and Innuruk, P., 2011. Body measurements of male Kamphaengsaen beef cattle as parameters for estimation of live weight. Kasetsart J. Nat. Sci., 45: 428-434.
Siddiqui, M.U., Lateef, M., Bashir, M.K., Bilal, M.Q., Muhammad, G., Mustafa, M.I. and Rehman, S., 2015. Estimation of live weight using different body measurements in Sahiwal Cattle. Pak. J. Life Soc. Sci., 13: 12-15.
Uzal, S. and Uğurlu, N., 2006. The constructural analyses of beef cattle production farms in Konya. Selcuk J. Agric. Fd. Sci., 20: 131-139.
TURKSTAT, 2017. Turkish statistical institute Web Page. Animal Statistic Database.
Umar, A.S.S., Alamu, J.F. and Adeniji, O.B., 2008. Economic analysis of small scale cow fattening enterprise in bama local government area of Borno state, Nigeria. Prod. Agric. Technol., 4: 1-10.
Zhang, W. and Goh, A.T.C., 2016. Multivariate adaptive regression splines and neural network models for prediction of pile drivability. Geosci. Front., 7:45-52.
Below ones may find the codes of the package “earth” of R software for statistical analysis of MARS algorithm:
> d=read.table(“C:/fattening.txt”, header=T)
> str(d)
> install.packages(“earth”)
> library(earth)
> fattening=earth(AFFLW~., data = d, degree = 2, nfold=10, penalty=-1, pmethod=”backward”, nk=100, keepxy = T)
> summary(fattening)
> plot(fattening)
> plotmo(fattening)
To share on other social networks, click on any share button. What are these?


