


Research Article
Effect of Farm Labor Transformation on Households’ Income in Central Districts of Khyber Pakhtunkhwa, Pakistan
Sajid Khan* and Shahnaz Akhtar
Institute of Development Studies (IDS), The University of Agriculture, Peshawar, Khyber Pakhtunkhwa, Pakistan.
Abstract | This study was conducted to assess the effect of farm labor transformation on households’ income in central three districts of Khyber-Pakhtunkhwa Province of Pakistan. Data on different aspects of farm labor transformation were collected through a well-designed and pre-tested questionnaire. Nine village councils from three districts were selected through random sampling techniques. The data were collected from 393 sample households and were analyzed by using paired sample t-test through Statistical Packages for Social Sciences (SPSS) and descriptive statistics, percentages, and rank orders. Farm labor transformation was found significantly affecting the earnings of households’ in the study area. Data revealed that monthly income from farm production and livestock increased significantly. Moreover, households’ income from non-farm sources massively increased after the farm labor transformation. The study recommends that government and/or non-governmental organizations may provide off-farm employment opportunities by launching cottage industries in rural areas and by providing technical training to farmers for the dissemination of the latest technology and skill enhancement for growing various crops and vegetables to enhance agriculture and rural development.
Received | October 01, 2020; Accepted | November 30, 2020; Published | January 09, 2021
*Correspondence | Sajid Khan, Institute of Development Studies (IDS), The University of Agriculture, Peshawar, Khyber Pakhtunkhwa, Pakistan; Email: [email protected]
Citation | Khan, S. and S. Akhtar. 2021. Effect of farm labor trans formation on households’ income in central districts of Khyber Pakhtunkhwa, Pakistan. Sarhad Journal of Agriculture, 37(1): 32-42.
DOI | http://dx.doi.org/10.17582/journal.sja/2021/37.1.32.42
Keywords | Agriculture production, Farm labor, Households’ income, Rural development, Transformation
Introduction
The production of goods and services is made possible after putting all the needed factors together. The standard factors of production i.e. land, labor, capital, and enterprise are traded in their specialized markets where their usage is determined for their supply, demand, and market prices. It has been observed that any factor of production can change its standard usage either by transforming to alternate activities (as land) or by physical movement, typically in the case of labor, capital, and entrepreneur (FRBStL, 2016). Inputs are used to produce any commodity. In the case of agricultural production, the land is static as compared to other factors, where the essential and primary factor of production is farm labor. Farm labor is a key source of employment in developing countries. The majority of the farmworkers get low earnings from agriculture as compared to other sectors. Thus, farmworkers try to maximize their income which causes farm labor transformation to off-farm enterprises (Quiggin et al., 1982).
Farm labor
Farm labor is a key source of employment for the rural labor force in Asia (Francis and Anim, 2011). Efforts made by the human either mentally or physically in the production of goods and services is called labor. Thus, labor is a physical or mental struggle of the human being for the production of goods and services. The return given to the labor is called a wage. Among the primary factors of production, the land is a passive factor whereas labor is an active factor of production. It is, thus labor which together with other factors makes production possible. Land and labor are known as primary factors of production. In the current scenario, to remain competitive in the market, labor skills are to be developed. There is a growing necessity to plan and act with greater independence and dynamicity on the market. Adapting to this evolution, altering the farmers’ mentality to some extent, could lead to a more progressive approach in the goods and services market. In this framework, the labor-factor becomes strategically crucial in terms of supply and capacity, as well as for the relative cost and consequent productivity (Baraldi et al., 2006).
Labor transformation
The inclination of workers to change occupation or place of work or both in response to benefits or unfavorable or undesired situations is called Labor transformation. Transformation may be responsible for changes in the structure of the labor force and the availability of workers for certain types of occupation (FAO, 2007).
Determinants of farm labor transformation
These are the drivers that compel the farm labors to change their occupation of farming and adopt another profession for livelihood. The shortage of farmland and small landholding is one of the main reasons for leaving farming. It is one of the most important determinants of labor migration because they reduce the relative marginal income from labor in farming (Zhao, 1999b). The current land ownership system is another driver for farm labor transformation. It is an obstacle to increase farm productivity. The surplus farm labor is another factor to transform their profession. Thus, able and strong laborers increasingly work in non-farm sectors while leaving the women, the elderly, or children to take care of the farm work (Zhao, 1999a).
Importance of agriculture sector
Agriculture is a major source of earning and employment for the rural communities of the globe. It employs directly or indirectly 43.1% labor force of the earth. The raw materials contribute 1.6 percent of the imports and exports of all kinds of merchandise in the world. Growth in the agricultural sector contributes proportionally four times more to poverty reduction than growth in any other non-agriculture sector (FAO, 2017).
The agriculture sector in Pakistan is characterized by low or constrained productivity cannot hence absorb additional farm labor. The share of the agriculture sector in GDP declined from 30% in 1990-91 to 18% in 2018-19 (GoP, 2019). Due to land fragmentation and low farm productivity, farm labor is transformed to the non-agriculture sector. The low productivity in agriculture is mainly due to the use of conventional farming methods, unaffordability for new technology, and emerging environmental problems. These issues have not only caused inefficiency in the agriculture sector but are highlighting farm labor transformation to other prospective sectors (World Bank, 2016).
The economy of Khyber Pakhtunkhwa (KP) also depends on agriculture and related activities such as dairy, fishery, forestry, etc. Almost 80% of its total population lives in rural areas and agriculture is the major source of their livelihood. It contributes 22% to the provincial GDP and employs 44% of the labor force (GoP, 2018). The central belt of KP that is the districts of Mardan, Swabi, and Charsadda has the most fertile land in the province. These districts are producing major cash and cereal crops, i.e. wheat, maize, rice, sugar cane, sugar beet, and tobacco as well as vegetables, like tomato, potato, garlic, onion, okra, cabbage, etc.
Problem statement
The agriculture sector in KP is characterized by low or constrained productivity cannot hence absorb additional farm labor. The share of the agriculture sector in GDP declined from 30% in 1990-91 to 18% in 2018-19 (GoP, 2019). Due to small landholding and low farm productivity, farm labor is transformed to the non-agriculture sector. The low productivity in agriculture is mainly due to the use of conventional farming methods, unaffordability for new technology, emerging environmental problems such as waterlogging salinity, frequent flooding and pest attacks, etc. These issues have not only caused inefficiency in agriculture but are highlighting farm labor transformation to other prospective sectors.
The labor freed from agriculture either find alternate occupations in the same or neighboring villages or migrates to remote locations in search of a job. This way they find a secure livelihood and certain other attractions such as improved schooling health and recreational facilities for their families.
Objectives of the study
This study was conducted to assess the effects of farm labor transformation on households’ income and development of the area they transformed from. As for as, farm labor is an important factor of production, its productive readjustment is important for development; especially in rural areas.
Materials and Methods
Zhao (1999b) studied the earning differences in the farm labor transformation in China. It was revealed that the marginal contribution of the transformed laborers was very high. Family income of the households was increased significantly after the farm labor transformation in the study area.
Srivastava and Singh (2006) studied that idea of economic reforms was the stimulus for agricultural growth and demand for labor in rural India.
Khan et al. (2008) studied that majority of the small farmers were busy in off-farm work due to low landholding and farm machination in Pakistan. In addition to this, technological change continues to exert a significant long-run influence on farm sector employment. As a result, underemployment in the agricultural sector is likely to increase in the future which leads to farm labor transformation.
Alam and Mamun (2016) studied the effect of education and the labor market in Australia. They investigated that there was a positive and direct effect between educational attainment and labor market status. In the labor market equation, the effect of achieving higher educational attainment on the probability of being employed has been statistically significant.
Maharjan et al. (2013) found that the use of purchased agriculture inputs is not significantly influenced by household migration status. They revealed that when remittances were relatively high, farmers did not invest in low-productivity and subsistence farming and preferred the nonfarm sector. However, when remittances were low, farm households used the extra funds to supplement the income from their subsistence farming to meet their basic food and non-food requirements.
Tocco et al. (2013) investigated the labor allocation decisions of farmers in Europe. They found that the role of human capital for the mobility of labor and recognized the importance of economic and labor market conditions for off-farm employment. The low mobility of agricultural laborers might be an outcome of their occupational choice on the farm in the first place; this was very much dependent on individual and locational variables.
Alasia and Bollman (2009) investigated the factors associated with off-farm work by small and large farm holders. It was revealed educational attainment was a major determinant of the ability to be a farmworker and to participate in off-farm work. Moreover, farmworkers of holdings with more than one farmworker and small farmers were more likely to do off-farm work.
Barkley (1990) studied the determinants of farm labor leaving the agriculture sector in the United States. They found that the quantity of labor employed in the agricultural sector in the United States has diminished dramatically over the past several decades. To obtain correct and updated estimates of the determinants of occupational migration is vital for the evaluation of agricultural policies that attempt to increase farm income and stabilize farm employment.
Universe of the study
The universe of this study was all those districts that mainstream agriculture in the central belt of KP. The study objective encompasses all farm households from where individuals have left the agriculture sector and transformed to other sectors for livelihood. It was estimated that 12.87% of the total population of 10 years and above of age had migrated from their home place (GoKP, 2015). Mardan, Charsadda and Swabi districts are known for having a favorable agriculture environment, producing major cash, cereal crops, and vegetables. The majority of the households in these districts have a joint family structure and they rely on farming for subsistence.
The above-mentioned districts were centrally built of agricultural activity in the province of KP. It was observed that some farmers were shifting from farm labor to other sectors for livelihood. Therefore, these districts were purposively selected for this research study.
Sampling procedure and sample size
The study plan followed a multistage sampling procedure to ensure the statistical precision of the results from the field data. In the first stage, three districts of KP were purposively selected, i.e. Mardan, Charsadda, and Swabi. In the second stage of the sampling scheme, 9 village councils were selected through random sampling techniques (3 from each district), considering the sensitivity related to farm labor transformation as per the required objectives of this study. In the third stage of sampling, those households from whom farm labor had been transformed were selected purposively. To gain secondary data regarding transformed farm labors’ households, the assistance of the concerned union council secretary was taken. As per the study, the data were collected from the heads of all those households from whom the farm labor had transformed. So, the transformed farm laborers were potential respondents of the study.
The formula used by Mawakaje (2013) was used for the selection of samples from the selected districts. The formula used is given below:
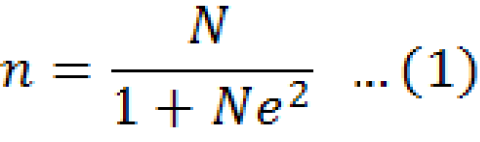
Where:
n = Sample size required; N= Total population; e= margin of error (5percent for the study); The resulted sample size obtained by using the formula was 393.
Now for the selection of samples from each district and each village council, proportional allocation techniques were used which is given as under:
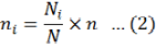
Where:
ni= Required number of sample households in each sample district /VC; n= Total number of sample size; N= Total number of households in each district/ VC; Ni= Total number of households in ith district/ VC.
Analytical techniques
Data on respondents’ perception about the effect of farm labor transformation on households’ income were analyzed by using descriptive statistical tools such as frequencies, percentages and ratios, etc.
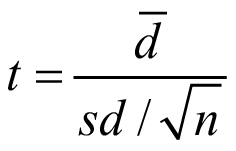
The collected data were analyzed by using a paired sample t-test through a computer program (Statistical Packages for Social Sciences).
 …(3)
…(3)
Which under the null hypothesis follow a t-distribution with (n-1) degrees of freedom.
Where;
d=Mean difference between two sample; sd= standard deviation of d-values; n= No of pairs.
Limitations of the study
The study focused on the effect of farm labor transformation on households’ income in nine village councils of district Mardan, Charsadda, and Swabi due to limitations associated with time, resource constraints, and infrastructure. In this regard, the results may not be representative of the whole KP or the entire country due to the small sample size. Some respondents were uncertain about expressing accurate figures relating to their income after farm labor
Table 1: District wise sample design and size of the study area.
|
District |
Union councils sample household of the transformed farm labor |
Total households to be Interviewed |
|||||
|
V. Council |
Sample size |
V. Council |
Sample |
V. Council |
Sample |
393 |
|
|
Mardan |
Babiani |
26 |
JahangirAbad |
32 |
Jamal Garhi |
70 |
|
|
Charsadda |
Bahloola |
39 |
Daman Shabqadar |
50 |
Koz-Behram Dheri |
39 |
|
|
Swabi |
Bam-Khel |
58 |
Manki |
55 |
Sudher |
24 |
|
|
Total |
123 |
137 |
133 |
||||
Source: Field Survey, 2017.
transformation, which was avoided by emphasizing the confidentiality of information during the interviews. Many of the questions in the questionnaire were based on the recall ability of the respondents who may not have given very accurate information due to memory lapses considering most of them had only basic education. However, the research recommendations may as well be applicable in other areas having similar ecological and socio-economic characteristics.
Results and Discussion
This section of the study deals with results and interpretations of the findings in pursuance of the objective of the study. This section mainly focuses on the effect of farm labor transformation on sampled households’ income in the study area. Moreover, it also includes different livelihood sources of the sampled households found in the study area.
Distribution of sample by different age categories
The Table 2 describes the different age categories of the sample transformed farm laborers in the study area. The sample transformed farm laborers were divided into four age groups; i.e. below 30 years, 31-40 years, 41-50 years, and above 50 years of age group. It also shows that 42% of the sample transformed farm laborers belonged to the group of 31-40 years of age. Among the Village Councils, this pattern of farm labor transformation was not alike throughout the study area. It was as high as 59% in VC Jahangir Abad while as low as 31% in VC Bamkhel.
Table 2: Age of sample transformed farm workers.
|
Village council |
Age categories (Percentage) |
||||
|
<30 |
31-40 |
41-50 |
> 50 |
No. |
|
|
Babiani |
47 |
37 |
11 |
5 |
26 |
|
Jahangir Abad |
31 |
59 |
8 |
2 |
32 |
|
Jamal Garhi |
42 |
40 |
15 |
3 |
70 |
|
Bahloola |
26 |
51 |
21 |
2 |
70 |
|
Daman Shabqadar |
22 |
38 |
32 |
8 |
50 |
|
Behram Dheri |
23 |
38 |
31 |
8 |
39 |
|
Bam Khel |
34 |
31 |
28 |
7 |
58 |
|
Manki |
32 |
47 |
18 |
3 |
55 |
|
Sudher |
27 |
46 |
19 |
8 |
24 |
|
All |
32 |
42 |
21 |
5 |
393 |
Source: Field Survey, 2018.
The second-largest percentage of farm labor was of the age category of 16-30 years of age. It was 32% in overall data while as high as 47% in VC Babiani and as low as 22% in VC Daman Shabqadar. The third age category (41-50) year was 21% in the study area. The lowest percentage of the age category (Above 50) was 5% in the study area. This pattern of farm labor transformation was similar among all the VC’s in the study area. The findings of the present study are in line with the findings of Rogers (2003) and Ali (2016) who found that young farm laborers are more adoptive, risk-takers, and are innovators.
Literacy status of sample transformed farm workers
Education, not only plays an important role in building societies and strengthening communities but it is also pivotal in adopting modern agricultural techniques for solving problems, developing attitudes, and advanced decision making (Rogers, 2003). The Table 3 shows the literacy status of the transformed farm labor in the study area. The data reveals that as much as 55% of the respondents were literate while 45% were illiterate in the study area. The reason for this high illiteracy might be the respondents’ full-time engagement in agriculture as laborers before the transformation.
The highest literacy found was 63% in VC’s Jahangir Abad and Bahloola while the lowest was 41% in Sudher. Similarly, the highest illiteracy was found 59% in Sudher while the lowest was 37% in VC’s Jahangir Abad and Bahloola both. The findings of the current research study are similar to the Government of Pakistan, labor Force Survey, Bureau of Statistics, 2017-18. As per a government report, 2017-18 literacy ratio in rural areas of KP was 52.7% while for urban it was 66.8%.
Table 3: Literacy status of sample transformed farm workers.
|
Village Council |
Literacy status (Percentage) |
No. |
|
|
Illiterate |
Literate |
||
|
Babiani |
53 |
47 |
26 |
|
JahangirAbad |
37 |
63 |
32 |
|
Jamal Garhi |
50 |
50 |
70 |
|
Bahloola |
37 |
63 |
70 |
|
Daman Shabqadar |
38 |
62 |
50 |
|
Behram Dheri |
49 |
51 |
39 |
|
Bam Khel |
41 |
59 |
58 |
|
Manki |
44 |
56 |
55 |
|
Sudher |
59 |
41 |
24 |
|
All |
45 |
55 |
393 |
Source: Field Survey, 2018.
Livelihood sources of sample households
Livelihood sources of the households in the study area were divided into two categories i.e. farm sources and non-farm sources. The farm sources of livelihood include all activities and outcomes from the farm, such as crop production, livestock, and farm wages while the non-farm sources of livelihood include the services sector, business, and small-scale enterprises, manufacturing sector, foreign remittances, and non-farm labor sector.
Farm sources
The farm sources of livelihood generally dominate in rural areas, Israr (2010). These include many sources but for clarity and convenience of the study, farm sources were categorized into farm production, livestock rearing, and farm wages in the study area.
Change in households’ monthly income from farm production
In rural areas of Pakistan and KP particularly, farming is the major source of livelihood. About 72% of people in KP are directly or indirectly involved in farming (GoP, 2018). The table below reports the households’ average monthly income from farm production before and after farm labor transformation as well. The farm production includes income from cereal crops, cash crops, vegetables, fruits, and agro-forestry. Among cereal crops, wheat and maize were grown by the majority of the farmers. In cash crops, sugarcane and tobacco crops were grown. The data shows that overall households’ income from farm production was increased. An overall 3% increment was observed in income from farm production after the farm labor transformation. The average income from farm production was increased from PKR. 29,550 per month to PKR. 30,720. Although, this change in income from farm production was not similarly increased among all village councils in the study area. The change in income from farm production was decreased by 2% and 1% in VC Daman Shabqadar and VCK. Behram Derhi respectively.
Change in monthly income from livestock of sample households after farm labor transformation
Livestock makes a great contribution to household income in rural areas of Pakistan. It accounts for 58.92% share in agriculture and 11.11% in GDP of the country, GoP (2018). Table 5 shows the average income of households’ in the study area from livestock before and after transformation as well. It was revealed that the average monthly income of the households from livestock, before farm labor transformation was PKR. 8,378. The Table 5 reports a significant increase in the average monthly income of the households after the farm labor transformation. Average monthly income from livestock increased 18% after farm labor transformation in the study area. The trend was more or less similar for all the village councils in the study area. The average monthly income from livestock was increased in 4 village councils i.e. Babiani, Jahangir Abad, Jamal Garhi, and Bamkhel by 55%, 31%, 28%, and 22% respectively. Although in the remaining village councils’ average monthly income from livestock was observed but non-significant. The findings of the present study were confirmed by Naz and Khan (2018) that raising livestock was one of the key sources of income generation in KP, Pakistan.
Table 4: Change in Monthly Income from farm production of sample households after farm labor transformation.
|
Village council |
Before (PKR) |
After (PKR) |
% change |
t value |
P value |
No. |
|
Babiani |
32,269 |
33,538 |
4 |
0.751 |
0.459 |
26 |
|
Jahangir Abad |
26,312 |
27,656 |
5 |
3.144*** |
0.004 |
32 |
|
Jamal Garhi |
27,329 |
28,586 |
5 |
3.575*** |
0.001 |
70 |
|
Bahloola |
25,769 |
27,128 |
5 |
3.370*** |
0.002 |
39 |
|
Daman Shabqadar |
38,500 |
37,840 |
-2 |
-0.055 |
0.956 |
50 |
|
K. Behram Derhi |
31,231 |
30,923 |
-1 |
-0.393 |
0.696 |
39 |
|
Bamkhel |
27,621 |
29,483 |
7 |
0.401 |
0.690 |
58 |
|
Manki |
27,582 |
30,236 |
10 |
8.460*** |
0.000 |
55 |
|
Sudher |
31,333 |
32,750 |
5 |
0.776 |
0.446 |
24 |
|
All |
29,550 |
30,720 |
3 |
0.705 |
0.481 |
393 |
Source: Field Survey, 2018; * P ˂ 0.10; ** P ˂ 0.05; ***P ˂ 0.01.
Table 5: Change in monthly income from livestock of sample household after farm labor transformation.
|
Village council |
Before (PKR) |
After (PKR) |
% change |
t-value |
P value |
No. |
|
Babiani |
10,654 |
16,500 |
55 |
2.987*** |
0.006 |
26 |
|
Jahangir Abad |
6,047 |
7,922 |
31 |
1.950* |
0.060 |
32 |
|
Jamal Garhi |
5,067 |
6,471 |
28 |
2.382** |
0.020 |
70 |
|
Bahloola |
6,974 |
7,179 |
3 |
0.211 |
0.834 |
39 |
|
D. Shabqadar |
8,780 |
9,824 |
12 |
1.353 |
0.182 |
50 |
|
K. Behram Derhi |
9,500 |
11,038 |
16 |
3.507*** |
0.001 |
39 |
|
Bamkhel |
10,552 |
12,855 |
22 |
3.393*** |
0.001 |
58 |
|
Manki |
10,836 |
11,291 |
4 |
0.736 |
0.465 |
55 |
|
Sudher |
7,417 |
7,488 |
1 |
0.069 |
0.946 |
24 |
|
All |
8,378 |
9,882 |
18 |
5.343*** |
0.000 |
393 |
Source: Field Survey, 2018; * P ˂ 0.10; ** P ˂ 0.05; ***P ˂ 0.01.
Change in monthly income from farm wages of sample households after farm labor transformation
Farm wages are of greater importance in agrarian economies. In agriculture, a bulk of labor is needed in the time of harvesting or sowing, or peak seasons. Therefore, farm laborers are hired on a daily wage basis. Table 6 reports the change in households’ average monthly income from farm wages after the farm labor transformation. The data reveals that a significant decrease was observed in average farm wages after the farm labor transformation in the study area. The reason for this decrease in farm wages is obvious. The farmworkers who were engaged in on-farm activities moved out of agriculture. The reason for this moving out of the farm was low wages in the agriculture sector as compared to other sectors. The data reveals that households’ average monthly income from farm wage was declined 43% after the farm labor transformation. The highest decrease (67%) was observed in K. Behram Derhi. This trend was almost more or less similar in the majority of the village councils in the study area.
Table 6: Change in monthly income from farm wages of sample households after farm labor transformation.
|
Village council |
Before (PKR) |
After (PKR) |
% change |
t value |
P value |
No. |
|
Babiani |
700 |
419 |
-40 |
-1.879* |
0.072 |
26 |
|
Jahangir-Abad |
1,001 |
722 |
-28 |
-1.768* |
0.087 |
32 |
|
Jamal Garhi |
770 |
396 |
-49 |
-3.662** |
0.000 |
70 |
|
Bahloola |
432 |
287 |
-34 |
-1.359 |
0.182 |
39 |
|
Daman Shabqadar |
373 |
256 |
-31 |
-1.422 |
0.161 |
50 |
|
K. BehramDerhi |
329 |
108 |
-67 |
-2.047* |
0.048 |
39 |
|
Bamkhel |
647 |
334 |
-48 |
-2.935*** |
0.005 |
58 |
|
Manki |
552 |
282 |
-49 |
-2.791*** |
0.007 |
55 |
|
Sudher |
879 |
479 |
-46 |
-2.064** |
0.050 |
24 |
|
All |
614 |
347 |
-43 |
-6.929*** |
0.000 |
393 |
Source: Field Survey, 2018; * P ˂ 0.10; ** P ˂ 0.05; ***P ˂ 0.01.
Non-farm sources
Rural non-farm activities contribute more than farm activities to the households’ income (Davis et al., 2007). The non-farm sources of livelihood are categorized into the services sector, business and small-scale enterprises, manufacturing sector, foreign remittances, and non-farm labor sector in the study area. John and Wobst (2006) stated that in rural Tanzania, non-farm activities were contributing more than farming activities to the households’ income. Same findings were revealed by Israr (2010) who stated that non-farm sources contribute greatly to the rural households’ income in KP, Pakistan.
Change in monthly income from services sector of sample household after farm labor transformation
The services sector is one of the largest and fastest-growing sectors of Pakistan’s economy. It provides steady support for the economic growth of the country. This sector contributes 58% to the GDP of the country (GoP, 2018). Table 7 reports the households’ average monthly income from the public and private services sector before and after farm labor transformation in the study area. It was found that the average monthly income from the public and private services sector increased massively. The average monthly of the sampled households from the said sector rose significantly (322%) from PKR. 1,545 to PKR. 6,520. This was observed more or less similar in all village councils in the study area. The average monthly income of the households from this sector increased significantly in all the village council. The highest increase (488%) was observed in village council Daman Shabqadar. Similar findings were reported by John and Wobst (2006) who stated that in rural Tanzania non-farm sources, in terms of services, were contributing more than farming activities to the households’ income.
Table 7: Change in monthly income from services sector of sample households after farm labor transformation.
|
Village council |
Before (PKR) |
After (PKR) |
% change |
t value |
P value |
No. |
|
Babiani |
2,846 |
13,462 |
373 |
5.762*** |
0.000 |
26 |
|
Jahangir-Abad |
1,344 |
4,844 |
260 |
2.793*** |
0.009 |
32 |
|
Jamal Garhi |
1,336 |
6,929 |
419 |
5.734*** |
0.000 |
70 |
|
Bahloola |
1,077 |
5,205 |
383 |
2.979*** |
0.005 |
39 |
|
D.Shabqadar |
1,000 |
5,880 |
488 |
3.948*** |
0.000 |
50 |
|
K. Behram Derhi |
1,987 |
6,449 |
225 |
3.567*** |
0.001 |
39 |
|
Bamkhel |
2,207 |
5,569 |
152 |
3.683*** |
0.001 |
58 |
|
Manki |
1,545 |
6,509 |
321 |
3.644*** |
0.001 |
55 |
|
Sudher |
1,667 |
5,958 |
257 |
3.376*** |
0.003 |
24 |
|
All |
1,545 |
6,520 |
322 |
11.661*** |
0.000 |
393 |
Source: Field Survey, 2018; * P ˂ 0.10; ** P ˂ 0.05; ***P ˂ 0.01.
Change in monthly income from business and small-scale enterprises of sample households after farm labor transformation
Business and small-scale enterprises are contributing significantly to the households’ income in rural areas of KP (Israr, 2010). Among the transformed farm laborers, the highest percentage (27%) laborers had adopted the business and small-scale enterprise sector in the study area. Table 8 states the households’ mean monthly income from business and small-scale enterprises before and after farm labor transformation in the study area. The data reports a significant increase in the average monthly income of the households from the business and small-scale enterprise sector. The overall mean income from this sector rose significantly by 367% from PKR. 2,580 to PKR. 12,042. The trend seemed more or less similar among all village councils in the study area. The greater significantly increase (609%) was observed in village council Manki. The results of the study were confirmed by Israr (2010) who stated that income from small-scale enterprises contributed significantly to households’ income in rural areas of KP.
Table 8: Change in monthly income from business and small-scale enterprises of sample households after farm labor transformation.
|
Village council |
Before (PKR) |
After (PKR) |
% change |
t value |
P value |
No. |
|
Babiani |
3,269 |
10,077 |
208 |
3.048*** |
0.005 |
26 |
|
Jahangir-Abad |
1,875 |
6,906 |
268 |
3.677*** |
0.001 |
32 |
|
Jamal Garhi |
2,629 |
8,743 |
233 |
5.287*** |
0.000 |
70 |
|
Bahloola |
1,333 |
8,821 |
562 |
4.041** |
0.000 |
39 |
|
D. Shabqadar |
1,880 |
12,840 |
583 |
6.066*** |
0.000 |
50 |
|
K. Behram Derhi |
4,462 |
12,936 |
190 |
4.470*** |
0.000 |
39 |
|
Bamkhel |
2,224 |
8,776 |
295 |
4.694*** |
0.000 |
58 |
|
Manki |
3,564 |
25,273 |
609 |
1.992** |
0.051 |
55 |
|
Sudher |
1667 |
10,333 |
520 |
2.889*** |
0.008 |
24 |
|
All |
2,580 |
12,042 |
367 |
5.838*** |
0.000 |
393 |
Source: Field Survey, 2018; * P ˂ 0.10; ** P ˂ 0.05; ***P ˂ 0.01.
Change in monthly income from the manufacturing sector of sample households after farm labor transformation
The manufacturing sector is also an important sector for income generation. Among the transformed laborers, 19% of laborers had adopted the manufacturing sector in the study area. Table 9 shows households’ average monthly income from the manufacturing sector before and after farm labor transformation in the study area. The data confirm that households’ average monthly income from the manufacturing sector was increased significantly after the farm labor transformation. Average monthly income was increased significantly by 400% from PKR. 1,095 to PKR. 5,470. This increase was observed with a more or less similar pattern among all the village councils in the study area.
Table 9: Change in monthly income from manufacturing sector of sample households after farm labor transformation.
|
Village council |
Before (PKR) |
After (PKR) |
% change |
t value |
P value |
No. |
|
Babiani |
1,654 |
3,308 |
100 |
2.010** |
0.055 |
26 |
|
Jahangir Abad |
1,000 |
4,063 |
306 |
2.888*** |
0.007 |
32 |
|
Jamal Garhi |
729 |
5,286 |
625 |
4.973** |
0.000 |
70 |
|
Bahloola |
872 |
3,795 |
335 |
2.716*** |
0.010 |
39 |
|
D. Shabqadar |
720 |
4,940 |
586 |
3.449*** |
0.000 |
50 |
|
K. Behram Derhi |
1,769 |
8,436 |
377 |
3.921** |
0.000 |
39 |
|
Bamkhel |
1,552 |
8,034 |
418 |
5.811** |
0.000 |
58 |
|
Manki |
1,191 |
3,945 |
231 |
3.663** |
0.001 |
55 |
|
Sudher |
1,167 |
5,771 |
395 |
3.125* |
0.005 |
24 |
|
All |
1,095 |
5,470 |
400 |
11.345*** |
0.000 |
393 |
Source: Field Survey, 2018; * P ˂ 0.10; ** P ˂ 0.05; ***P ˂ 0.01.
Change in monthly income from foreign remittances of sample households after farm labor transformation
Foreign remittances play an important role in the economic growth and development of a country (GoP, 2019). Those transformed laborers who had joined overseas employment contributed a lot to household income as compared to other employment sectors of the transformed laborers. Table 8 shows the mean monthly income of the households before and after farm labor transformation in the study area. The results show that households’ average monthly income from foreign remittances increased significantly after the farm labor transformation. An overall increase of 504% was observed in the study area. The average monthly income was increased from PKR. 1,809 to PKR. 10,921. This trend was more or less similar among all concerned village councils in the study area.
Change in monthly income from non-farm wages of sample households after farm labor transformation
Non-farm wages are one of the livelihood sources in rural areas in Pakistan. The majority of rural farmers rely on subsistence farming. Due to the high dependency ratio and small landholdings, farm laborers started moving out of agriculture. Table 11 depicts average households’ monthly income from non-farm wages before and after farm labor transformation in the study area. The data reveals that respondents’ average monthly income from non-farm wages were increased significantly by 384% after the farm labor transformation in the study area. The results show that the mean monthly income from non-farm wages was an increase from PKR. 715 to PKR. 3,463. The pattern for this shift was similar among all the village councils in the study area except village council Sudher in district Swabi. The average household’ monthly income of this VC increased only 61% from PKR. 917 to PKR. 1,479. The reason for this non-significant increment may be that a small number of farm laborers adopted the non-farm wages sector in VC Sudher.
Table 10: Change in monthly income from foreign remittances of sample households after farm labor transformation.
|
Village council |
Before (PKR) |
After (PKR) |
% change |
t value |
P value |
No. |
|
Babiani |
961 |
11,308 |
1077 |
3.255*** |
0.003 |
26 |
|
Jahangir-Abad |
1,469 |
12,875 |
776 |
4.482*** |
0.000 |
32 |
|
Jamal Garhi |
1,571 |
7,986 |
408 |
4.424*** |
0.000 |
70 |
|
Bahloola |
3,154 |
15,667 |
397 |
5.052*** |
0.000 |
39 |
|
D.Shabqadar |
3,160 |
7,580 |
140 |
2.890*** |
0.006 |
50 |
|
K. Behram Derhi |
641 |
6,410 |
900 |
2.959*** |
0.005 |
39 |
|
Bamkhel |
517 |
9,913 |
1817 |
4.709*** |
0.000 |
58 |
|
Manki |
1,782 |
14,545 |
716 |
2.128** |
0.038 |
55 |
|
Sudher |
3,958 |
17,167 |
334 |
3.406*** |
0.002 |
24 |
|
All |
1,809 |
10,921 |
504 |
8.531*** |
0.000 |
393 |
Source: Field Survey, 2018; * P ˂ 0.10; ** P ˂ 0.05; ***P ˂ 0.01.
Table 11: Change in monthly income from non-farm wages of sample households after farm labor transformation.
|
Village council |
Before (PKR) |
After (PKR) |
% change |
t value |
P value |
No. |
|
Babiani |
2,000 |
4,423 |
121 |
2.672*** |
0.013 |
26 |
|
Jahangir-Abad |
1,250 |
5,593 |
347 |
3.711*** |
0.001 |
32 |
|
Jamal Garhi |
143 |
2,800 |
1858 |
4.432*** |
0.000 |
70 |
|
Bahloola |
1,718 |
4,000 |
133 |
2.897*** |
0.006 |
39 |
|
D.Shabqadar |
220 |
2,700 |
1127 |
3.127*** |
0.003 |
50 |
|
K. Behram Derhi |
718 |
4,077 |
468 |
3.313*** |
0.002 |
39 |
|
Bamkhel |
466 |
3,121 |
570 |
3.708*** |
0.000 |
58 |
|
Manki |
436 |
3,718 |
753 |
3.943*** |
0.000 |
55 |
|
Sudher |
917 |
1,479 |
61 |
1.550 |
0.135 |
24 |
|
All |
715 |
3,463 |
384 |
9.980*** |
0.000 |
393 |
Source: Field Survey, 2018; * P ˂ 0.10; ** P ˂ 0.05; ***P ˂ 0.01.
Contribution of transformed farm labor sector to the households’ monthly income after farm labor transformation
Non-farm livelihood sources contribute more than farm sources in rural areas of KP Pakistan (Israr, 2010). The majority of rural farmers rely on subsistence farming. Due to the high dependency ratio and small landholdings, farm laborers started moving out of agriculture thus increasing household income by diversifying income sources (Davis et al., 2007). Table 12 reveals descriptive statistics of the contribution of transformed laborers to households’ monthly income who had left farming and adopted non-farm sectors for their livelihood. Data shows that the average monthly contribution to household income was PKR-31061 with a standard deviation of 36887 in the study area. The trend was more or less similar in all village councils except village council Manki. The average monthly contribution of the transformed laborers to the household income was PKR. 49564 with a standard deviation of 91,637 in village council Manki. The data for minimum and maximum values is also depicted in the Table 12. It was PKR. 8,000 minimum and PKR. 60,000 Maximum value in the study area.
Table 12: Contribution of transformed farm laborers to the households’ monthly income after farm labor transformation.
|
Village council |
No |
Minimum |
Maximum |
Mean |
S. deviation |
|
Babiani |
26 |
12,000 |
63,000 |
31,846 |
13,338 |
|
Jahangir-Abad |
32 |
11,000 |
60,000 |
27,344 |
12,638 |
|
Jamal Garhi |
70 |
9,000 |
64,000 |
25,336 |
11,784 |
|
Bahloola |
39 |
14,000 |
62,000 |
29,333 |
12,064 |
|
D.Shabqadar |
50 |
3,000 |
55,000 |
26,960 |
12,109 |
|
K. Behram Derhi |
39 |
8,000 |
66,000 |
27,808 |
14,399 |
|
Bamkhel |
58 |
5,000 |
60,000 |
28,448 |
12,483 |
|
Manki |
55 |
10,000 |
60,000 |
49,564 |
91,637 |
|
Sudher |
24 |
12,000 |
79,000 |
32,417 |
18,749 |
|
All |
393 |
8,000 |
60,000 |
31,061 |
36,887 |
Source: Field Survey, 2018.
Conclusions and Recommendations
This study was conducted in central districts Mardan, Charsadda and Swabi districts of Khyber Pakhtunkhwa (KP). The effect of farm labor transformation on different income sources was analyzed. The study concluded that the economy of KP and its central belt, i.e. districts of Mardan, Swabi, and Charsadda, primarily dependent on agriculture for their livelihood, and the majority of its population was living in rural areas. To diversify and maximize households’ income, farm labor transformation was adopted by small scale farmers in the study area. Subsistence landholdings, high tenancy, high family size, low level of education existed in the study area. Farm labor transformation had a significant effect on the income of the households’ in the study area. Analysis of income from farm sources of households revealed that monthly income from both, farm sources and non-farm sources increased significantly after farm labor transformation
The results of the study revealed a positive trend in farm labor transformation and income diversification. However, many of the farmworkers were still under-employed and their services were not utilized to the possible potential. To enhance farm labor transformation and its after-effects several areas needed special attention.
- The majority of the transformed farmworkers were unskilled and were getting low wages. Therefore, these laborers should be given technical training to get better off-farm jobs.
- Low landholdings and tenancy existed in the study area with low farm output and off-farm income opportunities. The government and/or non-governmental organizations may provide off-farm employment opportunities by launching cottage industries in rural areas to enhance farming and rural development.
- Low and constraint farm productivity and the traditional way of farming existed in the area. The government or non-governmental organizations may provide technical training to farmers for the dissemination of the latest technology and skill enhancement for growing the high yielding hybrid verities of crops and vegetables in the study area.
- To check the un-necessary farm labor transformation, the role of the already established extension service department should be enhanced to achieve better farm production and maximize the income of the household’ in the study area.
- Smallholding and tenancy existed in the area Therefore, the governmental or non-governmental agencies may provide easy access to credit facilities that the farmers may arrange the farm inputs for farming activities in the area.
- Females of the sample respondents were involved in differing farming activities in the study area who were mostly illiterate and unable to do off-farm jobs, therefore, technical training should be arranged for them who could remain on the farm without any skills and education.
Novelty Statement
Novelty of this research is to assess the effect of farm labor transformation on households’ income in central three districts of Khyber-Pakhtunkhwa Province of Pakistan. It was found that households’ income from non-farm sources massively increased after farm labor transformation.
Author’s Contribution
This research is a part of Ph. D. study of Sajid Khan. The idea of this research was generated by S.K and refined by Shahnaz Akhtar. S.K collected and analyzed the data, and overall managed the study. S.A provided technical input at every step.
Conflict of interest
The authors have declared no conflict of interest.
References
Alam, K. and S.A. Mamun. 2016. The relationship between labour force status and educational attainment: Evidence from a system of simultaneous equations model. Econ. Anal. Policy, Elsevier, 52(C): 55-65. https://doi.org/10.1016/j.eap.2016.07.005
Alasia, A., W. Alfons, B. Ray and C. John. 2009. Off-farm labour decision of Canadian farm operators: Urbanization effects and rural labour market linkages. J. Rural Stud., 25: 12-24. https://doi.org/10.1016/j.jrurstud.2008.04.002
Ali, H. 2016. Determinants of off-farm employment opportunities among small farm holders in Peshawar Valley of Khyber-Pakhtunkhwa. Ph.D Thesis. Institute of Development Studies. The University of Agric. Peshawar-Pakistan.
Baraldi, F., A. Castellini, R. Ghelfi, A. Palmieri, C. Pirazzoli and Sergio. 2006. The labour factor in agriculture: Comparison, analysis and actions introduced in some EU countries to boost competitiveness in the primary sector, conference papers 6655, Univ. Minnesota, Center Int. Food and Agric. Pol.
Barkley, A.P. 1990. The determinants of the migration of labor out of agriculture in the United States, 1940–85. Am. J. Agric. Econo., 72(3): 567-573 https://doi.org/10.2307/1243025
Davis, B., P. Witers, G. Carletto, K. Covarrubias, E. Quinones, A. Zezza, K. Stamoulis, G. Bonomi and S.D. Giuseppe. 2010. Rural income generating activities: A cross country comparison. World Develop. 38(1): 48-63. https://openknowledge.worldbank.org/handle/10986/5211
Federal Reserve Bank of St. Louis. 2016. Factors of production. Econ. Low Down Podcast Ser., 1(2): 6-19.
FAO, 2007. Agricultural laborers and their contribution to sustainable agriculture and rural development. FAO-ILO-IUF. ISBN: 978-92-2-118709-7.
Francis, D. and K. Anim. 2011. Factors affecting rural household farm labour supply in farming communities of South Africa. J. Hum. Ecol., 34(1): 23-28. https://doi.org/10.1080/09709274.2011.11906365
GoP, 2018. Economic Survey. 2017-18. Ministry of Finance, Govt. of Pakistan, Islamabad.
GoP, 2019. Economic Survey. 2018-19. Ministry of Finance, Govt. of Pakistan, Islamabad.
GoKP, 2015. Bureau of statistics. Development statistics of Khyber-Pakhtunkhwa.
Israr, M., 2010. Determinants of rural household income for livelihood in Northern, Pakistan. Ph. D. thesis. institute of development studies, The University of Agriculture Peshawar, Pakistan.
John, K.M. and P. Wobst. 2006. Determinants of rural labor market participation in Tanzania. Center for Develop. Res. (ZEF), Univ. Bonn. pp. 1-30.
Khan, D., M. Bashir and A. Jan. 2008. Determining extent of underemployment in agricultural sector-an evidence from district Mardan. Sarhad J. Agric., 24(2): 400-410.
Maharjan, A., S. Bauer and B. Knerr. 2013. Migration for labor and its impact on farm production in Nepal. Working paper IV centre for the study of labor and mobility. ISBN: 978 9937 2 6648 2.
Mawakaje, A.G., 2013. Impacts of climate change and variability on agro-pastoralist’s economy in Tanzania, Envirn. Econ., 4(1): 30-38.
Naz, S., and N.P. Khan. 2018. Financial contribution of livestock at household level in federally administered tribal areas of Pakistan. Sarhad J. Agric., 34(1): 1-9. https://doi.org/10.17582/journal.sja/2018/34.1.1.9
Rogers, E. M. 2003. Diffusion of innovations: Importance of education (5th Ed.). Free Press, New-York.
Srivastava, R. and R. Singh. 2006. Rural wages during the 1990s: A re-estimation. Econ. Pol. Wkly., 41: 23-29.
Quiggin, J., C. Robinson and P. McMahon. 1982. Labor supply and off-farm work by farmers. Theory and Estimation. Austral. J. Agric. Econ., 26(1): 23-38. https://doi.org/10.1111/j.1467-8489.1982.tb00406.x
Tocco, B., A. Bailey and S. Davidova. 2013. Determinants to leave agriculture and change occupational sector: Evidence from an enlarged EU. Factor Markets-working paper No. 46. ISBN 978-94-6138-314-3
FAO, 2017. The future of food and agriculture: Trends and challenges. ISBN 978-92-5-109551-5.
World Bank, 2016. Pakistan development update. Making growth matter. Int. Bank for reconstruction and development.
Zhao, Y., 1999. Leaving the countryside. Rural to urban migration decisions in China. A. Econ. Rev., 89(2): 281-286. https://doi.org/10.1257/aer.89.2.281
Zhao, Y., 1999b. Labor migration and earnings differences: The case of rural China. Econ. Dev. Cult. Change, 47(4): 767-782. https://doi.org/10.1086/452431
To share on other social networks, click on any share button. What are these?


