Differential Response of Elite Chickpea Genotypes under Moisture Stress Conditions


Research Article
Differential Response of Elite Chickpea Genotypes under Moisture Stress Conditions
Muhammad Rafiq1, Muhammad Tariq Mahmood2*, Mushtaq Ahmad2, Imtiaz Ali3, Muhammad Saleem1, Irfan Rasool1 and Zeshan Ali4
1Pulses Research Institute, Ayub Agriculture Research Institute, Faisalabad, Pakistan; 2Gram Breeding Research Station, Kallurkot, Pakistan; 3Regional Agricultural Research Institute, Bahawalpur, Pakistan; 4Plant Physiology Program, Crop Sciences Institute, National Agricultural Research Centre, Park Road, Islamabad PO 45500, Pakistan.
Abstract | Drought is a severe constraint for chickpea productivity across the globe. In Pakistan, it is primarily cultivated in drought-prone regions and marginal lands where moisture stress is a major limiting factor for chickpea production. In order to identify drought resilient chickpea genotypes, a field experiment consisting of 16 elite genotypes was carried out in two environments i.e. under moisture stress and non-stress environment following randomized complete block design at Gram Breeding Research Station, Kallurkot, Punjab, Pakistan during rabi season of 2018-19. Under moisture stress conditions, highly significant positive correlation was exhibited by drought tolerance efficiency (DTE) with final grain yield followed by seed weight (SW) and pods plant-1(NPP), while significant negative correlation was expressed by drought susceptibility index (DSI) to grain yield. Study of drought indices revealed that the highest DTE was presented by Punjab-2008 (84.13) followed by CH12/12, D-16004, CH-09/12, TG-1218 and TG-1221 (83.84, 80.10, 72.27, 69.93 and 69.31 % respectively) coupled with least DSI (0.39, 0.40, 0.49, 0.69, 0.75 and 0.76 respectively). Results indicated that the genotypes Punjab-2008, CH12/12, D-16004, CH-09/12, TG-1218 and TG-1221 possess high drought tolerance and higher yield potential under moisture stress environment. Therefore, these genotypes may be included in chickpea breeding program for development of stress tolerant varieties for drought prone areas of the country.
Received | January 20, 2020; Accepted | March 18, 2020; Published | July 02, 2020
*Correspondence | Muhammad Tariq Mahmood, Gram Breeding Research Station, Kallurkot, Pakistan; Email: taqaisrani@gmail.com
Citation | Rafiq, M., M.T. Mahmood, M. Ahmad, I. Ali, M. Saleem, I. Rasool and Z. Ali. 2020. Differential response of elite chickpea genotypes under moisture stress conditions. Pakistan Journal of Agricultural Research, 33(3): 422-428.
DOI | http://dx.doi.org/10.17582/journal.pjar/2020/33.3.422.428
Keywords | Chickpea, Correlation, Drought tolerance, DSI, Stress environment
Introduction
Chickpea is one of the leading pulse legume crop providing nutritious food to ever expanding global population. It is extensively grown as major winter crop in arid and semi-arid tropical countries around the world (Varshney et al., 2019). In Pakistan, it is leading pulse legume crop with an average production of 444 kg ha-1 which is far below than the average world production of 969 kg ha-1 (Nadeem et al., 2019). This gap in production per unit area is attributed to various biotic and abiotic stresses. Among abiotic stresses, moisture stress is the primary limiting factor for chickpea production in Pakistan because of its cultivation on marginal land and sand dunes of Thal where it faces terminal drought (Mahmood et al., 2018). In Pakistan, Thal shares more than 80 percent area under chickpea crop where the crop is exposed to arid to hyper-arid climatic conditions. Geographically, Thal lies between 30°59´-32°6´ N and 71°14´-72°16´ E (Figure 1). comprising Bhakkar, Khushab, Layyah, Muzafargarh and Mianwali districts of Punjab, Pakistan (Shaheen and Baig, 2011).
Drought is generally unpredictable in its severity, occurrence and duration depending upon the inadequate and uneven rainfalls during the crop period. It is considered as the most adverse environment, limiting the chickpea production and demands immediate attention of the researchers to explore the drought tolerant germplasm (Merga and Haji, 2019; Nadeem et al., 2019; Varshney et al., 2019). Chickpea productivity is severely affected by moisture stress and such yield losses range from 15-60% (Pandey et al., 2017).
Various species of crop plants usually adapt to moisture stress conditions through tolerance mechanisms (Yadev et al., 2005). Chickpea productivity in drought prone regions is greatly dependent on efficient employment of available soil moisture. Therefore, systematic breeding efforts are required to evolve a large number of drought tolerant chickpea varieties (Devasirvatham et al., 2018).
>Exploration of drought indices and the association analysis of various morpho-agronomic traits have been extensively utilized by several researchers to sort out the drought resilient chickpea genotypes. For this purpose, field screening has been found a powerful tool to screen out the drought tolerant germplasm (Hussain et al., 2015; Ghasemi and Farshadfar, 2015). The present study was planned to identify the efficient and superior drought tolerant genotypes of chickpea adaptable to drought prone regions of the country.
Material and Methods
The present investigation was carried out at Gram Breeding Research Station, Kallurkot (71.153oE and 32.923oN), Punjab, Pakistan during rabi 2018-19 in two different environments i.e. moisture stress (I0) and non-stress conditions. The experimental material consisting of 14 elite chickpea genotypes (CH09/12, CH12/12, CH40/12, CH44/12, D-16003, D-16004, D-16007, D-16017, D-16032, D-16011, TG1415, TG1218, TG1221 TGX228) along with two commercial varieties (Bittle-16 and Punjab-2008) developed by different breeding centers (Table 1) was laid down in split plot under randomized complete block design (RCBD) with three replications. Sowing was done by dibbler by maintaining 10 cm plant-plant and 30 cm row-row distance during last week of October, 2018. Only one irrigation was applied to I0 set to create necessary moisture for germination and no supplementary irrigation was done. Whereas, two supplementary irrigations were applied to I1 set. Around 78 mm rainfall was recorded during the crop period. All the recommended agronomic practices were performed throughout the cropping season.
Table 1: List of breeding centers of chickpea genotypes.
| Genotypes | Status | Breeding Center |
| CH09/12 | Elite advance line | NIAB, Faisalabad, Pakistan |
| CH12/12 | Elite advance line | NIAB, Faisalabad, Pakistan |
| CH40/12 | Elite advance line | NIAB, Faisalabad, Pakistan |
| CH44/12 | Elite advance line | NIAB, Faisalabad, Pakistan |
| D-16003 | Elite advance line | PRI, AARI, Faisalabad, Pakistan |
| D-16004 | Elite advance line | PRI, AARI, Faisalabad, Pakistan |
| D-16007 | Elite advance line | PRI, AARI, Faisalabad, Pakistan |
| D-16017 | Elite advance line | PRI, AARI, Faisalabad, Pakistan |
| D-16032 | Elite advance line | PRI, AARI, Faisalabad, Pakistan |
| D-16011 | Elite advance line | PRI, AARI, Faisalabad, Pakistan |
| TG1415 | Elite advance line | AZRI, Bhakkar, Pakistan |
| TG1218 | Elite advance line | AZRI, Bhakkar, Pakistan |
| TG1221 | Elite advance line | AZRI, Bhakkar, Pakistan |
| TGX228 | Elite advance line | AZRI, Bhakkar, Pakistan |
| Punjab-08 | Drought tolerant variety | PRI, AARI, Faisalabad, Pakistan |
| Bittle-2016 | Drought tolerant variety | PRI, AARI, Faisalabad, Pakistan |
Data were recorded for days to flowering (DF), primary branches (PB), secondary branches (SB), pods plant-1 (NPP), days taken to maturity (DM), plant height (PH), 100 seed weight (SW) and yield (YLD kg hectare-1) under moisture stress and non-stress conditions.
Statistical analysis
Data was subjected to analysis of variances following Steel et al., 1997.While correlation coefficient analysis was performed following Singh and Chaudhry (1979).
Drought indices
Yield reduction percentage and drought susceptibility index were calculated by the formula suggested by Fischer and Maurer (1978) and used by Sabaghpour et al., 2006, Hussain et al., 2015.
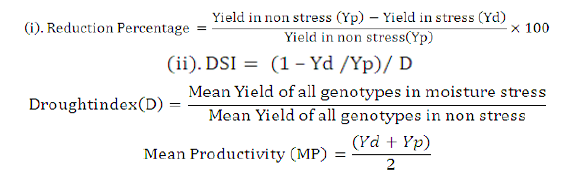
Yd= Yield in stress condition, Yp= Yield in non-stress condition and D= Drought index.
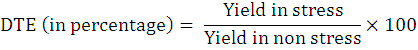
While, Drought tolerance efficiency (DTE) was calculated following the formula suggested by Fischer and Wood (1981).
Results and Discussion
Days to flowering (DF) ranged from 83-102 days under water stress conditions (I0) and 90-105 days under irrigated conditions (I1). Primary branches (PB) were counted between 2-6 under stress and 3-7 in non stress conditions. Secondary branches (SB) 4-10 were recorded under stress while 6-12 under non stress conditions. Similarly, under stress environment 37-58 number of pods plant-1(NPP) were found while 51-72 were recorded in irrigated conditions. Days to maturity ranged between 156-176 under stress and 160-178 under irrigated conditions. Plant height under stress conditions was recorded between 39-59 cm and 50-79 cm in non stress. Under stress environment 100 seed weight (SW) was recorded between 24-31 gram and 25-31 grams under non stress conditions. Under stress environment maximum grain yield (Yld) 774 kg ha-1 was recorded in Punjab-2008 followed by CH12/12 (773), D-16004 (753), TG 1218 (649), D-16017 (604) and TG1221(603) while minimum 378 kg ha-1 was found in D-16032 (Table 4). In non stress conditions D-16004 showed maximum grain yield 940 kg ha-1followed by D-16007 (938), TG1415 (930), TG1218 (928), Punjab-2008 (920) and D-16017 (880) while minimum 646 kg ha-1 was recorded in TGX228 (Table 2). In agreement to this study Deshmukh et al., 2004; Ghasemi and Farshadfar (2015) also reported delayed flowering, more branches, maximum number of pods, more seed weight and higher grain yield under non stress environments.
Data revealed that number of days to flowering have significant and positive association (0.536) with DM and non significant with all other morpho-yield traits and drought indices (Table 3). Yadev et al., 2005 and Hussain et al., 2015 narrated similar findings that the genotypes taking more numbers of days to 50% flowering are late maturing. Primary branches significantly correlated with SB (0.604) followed by DM (0.574) while all other studied traits were non significantly correlated. These results agree with the findings of Hussain et al., 2015. Secondary branches exhibited significant association with DTE (0.514) followed by PH (0.422) and NPP (0.401) while negatively correlated with yield reduction% (-0.514) and DSI (-0.511). Islam et al., 2008 also reported that SB have positive and significant correlation with PH and NPP. Number of pods plant-1 were positively associated with SW (0.778) and DTE (0.770) while showed negative correlation with yield reduction percentage. Days to maturity showed non-significant correlation with most of the studied traits. Seed weight exhibited significant positive correlation with DTE (0.774) but negative correlation was noted in DSI (-0.777) and yield reduction percentage (-0.775). Similar results were reported by Sabaghpour et al., 2006. Correlation studies also revealed that grain yield showed significant and positive association with 100 SW (87%) and NPP (79%). Similarly, drought indices; DTE exhibited highly significant positive correlation (0.948) in determination of grain yield while significantly negative correlation was exhibited by DSI (-0.949) and yield reduction percentage (-0.948). Findings of this study agree with the studies of Parameshwarappa et al., 2012 and Ghasemi and Farshadfar (2015) who reported that yield is positively associated with number of pods, drought tolerance and drought susceptibility index.
Table 2: Mean performance of chickpea genotypes under stress and non-stress conditions.
| Genotypes | DF | PB | SB | NPP | DM | PH | SW | |||||||
|
I0 |
I1 |
I0 |
I1 |
I0 |
I1 |
I0 |
I1 |
I0 |
I1 |
I0 |
I1 |
I0 |
I1 |
|
| Bittle-16 | 86 | 95 | 2 | 3 | 6 | 8 | 39 | 55 | 156 | 160 | 47 | 58 | 25 | 27 |
| CH09/12 | 99 | 103 | 4 | 6 | 11 | 12 | 50 | 68 | 167 | 178 | 53 | 62 | 30 | 31 |
| CH12/12 | 96 | 100 | 3 | 4 | 8 | 10 | 56 | 72 | 161 | 166 | 56 | 68 | 30 | 30 |
| CH40/12 | 98 | 102 | 4 | 4 | 4 | 7 | 46 | 61 | 162 | 169 | 39 | 50 | 26 | 28 |
| CH44/12 | 101 | 106 | 3 | 3 | 4 | 6 | 44 | 58 | 164 | 172 | 45 | 54 | 26 | 26 |
| D-16003 | 94 | 99 | 3 | 4 | 7 | 8 | 47 | 60 | 165 | 168 | 42 | 49 | 29 | 30 |
| D-16004 | 102 | 103 | 4 | 4 | 7 | 7 | 57 | 71 | 173 | 175 | 46 | 59 | 30 | 30 |
| D-16007 | 97 | 99 | 3 | 5 | 6 | 8 | 50 | 64 | 163 | 171 | 51 | 68 | 29 | 29 |
| D-16017 | 84 | 94 | 3 | 7 | 7 | 9 | 43 | 62 | 160 | 168 | 56 | 75 | 28 | 30 |
| D-16032 | 96 | 100 | 3 | 4 | 5 | 6 | 33 | 49 | 167 | 169 | 52 | 64 | 26 | 27 |
| D-16011 | 93 | 99 | 6 | 7 | 10 | 10 | 41 | 59 | 168 | 172 | 57 | 75 | 25 | 27 |
| Punjab-08 | 90 | 98 | 4 | 5 | 10 | 10 | 58 | 66 | 166 | 169 | 52 | 57 | 30 | 30 |
| TG1415 | 92 | 99 | 3 | 4 | 4 | 6 | 27 | 46 | 168 | 143 | 49 | 60 | 27 | 28 |
| TG1218 | 102 | 105 | 4 | 4 | 8 | 10 | 58 | 72 | 158 | 166 | 56 | 70 | 31 | 31 |
| TG1221 | 83 | 90 | 3 | 5 | 7 | 9 | 47 | 63 | 157 | 160 | 59 | 79 | 29 | 30 |
| TGX228 | 102 | 105 | 5 | 6 | 10 | 14 | 37 | 51 | 175 | 166 | 45 | 77 | 24 | 25 |
| CV | 2.27 | 5.02 | 8.17 | 8.44 | 10.09 | 5.82 | 5.16 | 7.25 | 6.50 | 8.70 | 7.20 | 7.35 | 1.17 | 2.81 |
I0: Stress conditions; I1: Non-stress conditions; DF: Days to flowering; PB: number of primary branches; SB: number of Secondary branches; NPP: Number of pods; DM: Maturity days; PH: Plant height; SW: 100 Seeds weight.
Table 3: Correlation coefficients of various traits under moisture stress conditions.
| DF | PB | SB | NPP | DM | PH | SW | DTE | DSI | Red% | Yld | |
| DF | 1.000 | 0.393 | 0.054 | 0.228 | 0. 536* |
-0.397 | 0.053 | -0.025 | 0.021 | 0.025 | -0.071 |
| PB | 1.000 | 0.604* | 0.112 | 0. 574* |
0.085 | -0.165 | 0.013 | -0.011 | -0.014 | -0. 381* |
|
| SB | 1.000 | 0.401* | 0.274 | 0.422* | 0.255 | 0.514* | -0.511* | -0.514* | 0.375 | ||
| NPP | 1.000 | -0.193 | 0.183 | 0. 778** |
0. 770** |
-0. 755** |
-0. 750** |
0. 796** |
|||
| DM | 1.000 | -0.325 | -0.222 | 0.001 | -0.001 | -0.001 | -0.107 | ||||
| PH | 1.000 | 0.367 | 0.291 | -0.288 | -0.291 | 0.309 | |||||
| SW | 1.000 | 0. 774** |
-0. 777** |
-0. 775** |
0. 877** |
||||||
| DTE | 1.000 | -1.000 | -1.000 | 0. 948** |
|||||||
| DSI | 1.000 | 1.000 | -0. 949** |
||||||||
Red % |
1.000 | -0 .948** |
|||||||||
| Yld | 1.000 |
Correlation coefficient analysis is revealed that the genotypes possessing elevated 100 seed weight, maximum pods and secondary branches exhibited higher grain yield, more DTE percentage and less DSI.
Therefore, the genotypes Punjab-2008, CH12/12, D-16004, CH-09/12, TG-1218 and TG-1221 possessing relatively higher seed weight, maximum number of pods and secondary branches proved more stress tolerant and less susceptible to drought coupled with high yield potential under moisture stress environment.
Drought indices of all included genotypes were calculated from grain yield data under stress and non stress conditions as shown in Table 4. Maximum DTE percentage was exhibited by Punjab-2008 (84.13%) followed by CH12/12 (83.84%), D-16004 (80.1%), CH09/12 (72.27%), TG1218 (69.93%) and TG1221 (69.21%). Similarly, least drought susceptibility values were also shown by Punjab-2008, CH12/12, D-16004, CH-09/12, TG-1218 andTG-1221 (0.39, 0.40, 0.49, 0.69, 0.75 and 0.76 respectively). Minimum yield reduction percentage was also calculated in Punjab-2008 (15.9%), CH12/12 (16.2%), D-16004 (19.9%), CH-09/12 (27.7%), TG-1218 (30%) and TG-1221 (30.7%). Fischer and Maurer (1978) suggested that the genotypes with <1 drought index (DSI) values with higher DTE% are more efficient and tolerant to moisture stress environments. Hussain et al., 2015 narrated that the genotypes with higher DTE%, less DSI and yield reduction percentage are more tolerant to stress environments. Genotypes with higher DTE percentage coupled with least DSI and lower yield reduction percentage are more superior and ideal for drought tolerance. Therefore, the genotypes Punjab-2008, CH12/12, D-16004, CH-09/12, TG-1218 and TG-1221 can be rated as drought tolerant.
Table 4: Drought indices of chickpea genotypes.
| Genotypes | Yield (kg/ha) | MP | DTE % | DSI | Yield Red. % | |
|
I0 |
I1 |
|||||
| Bittle-16 | 426 | 857 | 642 | 49.7 | 1.26 | 50.3 |
| CH09/12 | 623 | 862 | 743 | 72.27 | 0.69 | 27.7 |
| CH12/12 | 763 | 910 | 836 | 83.84 | 0.40 | 16.2 |
| CH40/12 | 453 | 916 | 685 | 49.45 | 1.26 | 50.5 |
| CH44/12 | 457 | 825 | 641 | 55.45 | 1.11 | 44.6 |
| D-16003 | 634 | 917 | 776 | 69.13 | 0.77 | 30.9 |
| D-16004 | 753 | 940 | 846 | 80.1 | 0.49 | 19.9 |
| D-16007 | 507 | 938 | 723 | 54.05 | 1.14 | 46 |
| D-16017 | 604 | 880 | 742 | 68.6 | 0.78 | 31.4 |
| D-16032 | 378 | 851 | 615 | 44.41 | 1.39 | 55.6 |
| D-16011 | 444 | 906 | 675 | 49 | 1.28 | 51 |
| Punjab-08 | 774 | 920 | 847 | 84.13 | 0.39 | 15.9 |
| TG1415 | 488 | 930 | 709 | 52.47 | 1.19 | 47.5 |
| TG1218 | 649 | 928 | 789 | 69.93 | 0.75 | 30 |
| TG1221 | 603 | 870 | 737 | 69.31 | 0.76 | 30.7 |
| TGX228 | 393 | 646 | 520 | 60.83 | 0.98 | 39.2 |
I0: Stress conditions; I1: Non-stress conditions; DTE %: Drought tolerance efficiency; DSI: Drought susceptibility index.
Conclusions and Recommendations
From the study it was concluded that six genotypes Punjab-2008, CH12/12, D-16004, CH-09/12, TG-1218 and TG-1221 exhibited higher grain yield, more drought tolerance coupled with less drought susceptibility and minimum yield reduction percentage. Therefore, these genotypes are best drought tolerant and may be incorporated in chickpea breeding program for development of drought tolerant varieties.
Acknowledgements
Authors are thankful to Pulses Research Institute, Ayub Agricultural Research Institute, Faisalabad, Pakistan for their facilitation in conduction of this field experiment.
Author’s Contribution
MR, MTM and MA involved in the conception, design of the study. MTM, IA, ZA and IR conducted research and analysis. All authors were involved in interpretation of data and manuscript writing.
Conflict of interest
The authors have declared no conflict of interest.
References
Bakhsh, A., S.R. Malik, M. Aslam, U. Iqbal and A.M. Haqqani. 2007. Response of Chickpea Genotypes toIrrigated and Rain-fed Conditions. Int. J. Agric. Biol., 9: 590-593.
Merga, B. and J.H.F. Yildiz (Reviewing editor) 2019. Economic importance of chickpea: Production, value, and world trade, Cogent Food and Agric., 5: 1. https://doi.org/10.1080/23311932.2019.1615718
Devasirvatham, V. and D. Tan. 2018. Impact of high temperature and drought stresses on chickpea production. Agron. 8: 145. https://doi.org/10.3390/agronomy8080145
Economic Survey of Pakistan, 2018-19. Ministry of Finance, Government of Pakistan. http://finance.gov.pk/survey/chapters_19/Economic_Survey_2018_19.pdf.
Fisher, R.A. and R. Maurer. 1978. Drought resistance in spring wheat cultivars. I. Grain yield responses in spring wheat. Aust. J. Agric. Sci., 29: 892-912. https://doi.org/10.1071/AR9780897
Fahad, S., A.A. Bajwa, U. Nazir, S.A. Anjum, A. Farooq, A. Zohaib, S. Sadia, W. Nasim, S. Adkins, S. Saud, M.Z. Ihsan, H. Alharby, C. Wu, D. Wang, J. Huang. 2017. Front Plant Sci., 8: 1147. Published online 2017 Jun 29. https://doi.org/10.3389/fpls.2017.01147
Ghasemi, M. and E. Farshadfar. 2015. Screening drought tolerant genotypes in wheat using multivariate and stress tolerance score methods. Int. J. Biosci. (IJB), 6: 326-333.
Golabadi, M., A. Arzani and S.M. Maibody. 2006. Assessment of drought tolerance in segregating populations in durum wheat. Afr. J. Agric. Res., 1: 162-171.
Gupta S.N., B.S. Dahiya, B.P.S. Malik and N.R. Bishnoi. 1995. Response of chickpea to water deficits and drought stress. Haryana Agric. Univ. Res. J., 251: 11-19.
Hussain, N., M. Aslam, A. Ghaffar, M. Irshad and Naeem-ud-Din. 2015. Chickpea Genotypes Evaluation for Morpho-Yield Traits under Water Stress Condition. J. Anim. Plant Sci., 25(1): 206-211.
Islam, M.M., M.R. Ismail, M. Ashrafuzzaman, K.M. Shamsuzzaman and M.M. Islam. 2008. Evaluation of chickpea lines/mutants for growth and yield attributes. Int. J. Agric. Biol. 10: 493-498.
Johnson, D.A., 1980. Improvement of perennial herbaceous plants for drought stressed western rangelands. In: N.C. Turner and P.J. Kramer, (eds.) Adaptation of plants to water and high temperature stress. John Willey and Sons. Inc. pp. 419-433.
Khan, O.Z., A. Naseer, M. Shahbaz, S. Akhtar, M. Faisal and K. Mushtaq. 2017. Accessing the factors affecting the yield of Chick-pea in Thal,Punjab, Pakistan. J. Innov. Bio-Res. 1(1): 46-51.
Kuhad, M.S., B.S. Kundu, R.S. Hooda and Sheoran. 1988. Physiological studies in chickpea under qualified moisture level. J. Plant Physiol., 31(4): 423-427.
Mahmood, M.T., M. Ahmad, I. Ali, M. Hussain, A. Latif and M. Zubrair. 2018. Evaluation of chickpea genotypes for genetic diversity through multivariate analysis. J. Environ. Agric. Sci. 15: 11-17.
Nadeem, M., J. Li, M. Yahya, A. Sher, C. Ma, X. Wang and L. Qiu. 2019. Research progress and perspective on drought stress in legumes: A review. Int. J. Mol. Sci., 20: 2541. https://doi.org/10.3390/ijms20102541
Parameshwarappa, S.G., P.M. Salimath, H.D. Upadhyaya, S.S. Patil, S.T. Kajjidoni, B.C. Patil and Y.D. Narayana. 2012. Variation in root characters of selected drought tolerant accessions of chickpea (Cicer arietinum L.) grown under terminal drought. Karnataka J. Agric. Sci., 25 (3): 389-391.
Pandey, P., V. Irulappan, M.V. Bagavathiannan and M. Senthil-Kumar. 2017. Impact of combined abiotic and biotic stresses on plant growth and avenues for crop improvement by exploiting physio-morphological traits. Front. Plant Sci., 8: 537. https://doi.org/10.3389/fpls.2017.00537
Reddy, A.R., K.V. Chaitanya and M. Vivekanandan. 2004. Drought-induced responses of photosynthesis and antioxidant metabolism in higher plants. J. Plant. Physiol. 161: 1189–1202. https://doi.org/10.1016/j.jplph.2004.01.013
Rosielle, A.A. and J. Hamblin. 1981. Theoretical aspects of selectionfor yield in stress and non-stress environments. Crop Sci. 21: 943-946. https://doi.org/10.2135/cropsci1981.0011183X002100060033x
Sabaghpour, S.H., A.K. Mahmodi, A. Saeed, M. Kamel and R.S. Malhotra. 2006. Study on chickpea drought tolerance lines under dryland condition of Iran. Indian J. Crop Sci., 1 (1-2): 70-73.
Saxena, N.P., L. Krishnamurthy and C. Johansen. 1993. Registration to a drought resistant chickpea germplasm (En.) Crop Sci., 33(6): 14-24. https://doi.org/10.2135/cropsci1993.0011183X003300060088x
Shaheen, A. and M.A. Baig. 2011.Drought severity assessment in arid area of Thal doab using remote sensing and GIS. Int. J. Water Resour. Arid Environ. 1(2): 92-101.
Singh, R.K. and B.D. Chaudhry. 1979. Biometrical methods in quantitative genetic analysis. Kalyani Publ., New Delhi, India.
Steel, R.G.D., J.H. Torrie and D.A. Dickey. 1997. Principles and procedures of statistics: A biometrical approach. 3rd Edi. McGraw Hill Book Co., New York, USA.
Talebi, R., M.H. Ensafi, N. Baghebani, E. Karami and K. Mohammadi. 2013. Physiological responses of chickpea (Cicer arietinum L.) genotypes todrought stress. Environ. Exp. Biol. 11: 9–15.
Varshney, R.K., M. Thudi, M. Roorkiwal, W. He, H.D. Upadhyaya, W. Yang, P. Bajaj, P. Cubry, A. Rathore, J. Jian, D. Doddamani, A.W. Khan, V. Garg, A. Chitikineni, D. Xu, P.M. Gaur, N.P. Singh, S.K. Chaturvedi, G.V.P.R. Nadigatla, L. Krishnamurthy, G.P. Dixit, A. Fikre, P.K. Kimurto, S.M. Sreeman, C. Bharadwaj, S. Tripathi, J. Wang, S.H. Lee, D. Edwards, K.K.B. Polavarapu, R.V. Penmetsa, J. Crossa, H.T. Nguyen, K.H.M. Siddique, T.D. Colmer, T. Sutton, E.V. Wettberg, Y. Vigouroux, X. Xu and X. Liu. 2019. Resequencing of 429 chickpea accessions from 45 countries provides insights into genome diversity, domestication and agronomic traits. Nat. Genet., 51: 857–864
Yadav, S.R., R.M. Yadav and C. Bhushan. 2005. Genotypic differences in physiological parameters and yield of chickpea (Cicer arietinum L.) under soil moisture stress conditions. Legume Res. 28: 306-8.
Yu, L.X. and T.L. Setter. 2003. Comparative transcriptional profiling of placenta and endosperm in developing maize kernels in response to water deficit. Plant Physiol. 131: 568-582. https://doi.org/10.1104/pp.014365
To share on other social networks, click on any share button. What are these?