
Development of an Allometric Model for Biomass Estimation of Pinus roxburghii, Growing in Subtropical Pine Forests of Khyber Pakhtunkhwa, Pakistan


Research Article
Development of an Allometric Model for Biomass Estimation of Pinus roxburghii, Growing in Subtropical Pine Forests of Khyber Pakhtunkhwa, Pakistan
Anwar Ali1*, Muhammad Irfan Ashraf2, Saeed Gulzar2 and Muhammad Akmal2
1Pakistan Forest Institute (PFI), Peshawar, Khyber Pakhtunkhwa, Pakistan; 2Arid Agriculture University, Rawalpindi, Pakistan.
Abstract | This study attempts to develop an allometric model for biomass estimation of Chirpine (Pinus roxberghii) an important species of subtropical pine ecosystems in the Himalayas. Data was collected through destructive sampling of 32 sample trees growing in subtropical pine forests of Hazara Forest Region, Khyber Pakhtunkhwa (KP), Pakistan. Diameter at Breast Height (DBH) of the selected sample trees ranged from (12-93 cm) and height (H) varied between 9.50-40.10 m. Allometric equation was developed through testing different allometric models. The best fit model was obtained through logarithmic transformation of response and explanatory variables. It was found that square of DBH and H (D2H) was the best independent variable for predicting above ground biomass of an individual tree. The equation was also evaluated and compared with the existing generic allometric equations. Results showed that the allometric equation developed in this study gave more reliable estimates of aboveground biomass. A strong relationship (r2 = 0.99) found for tree biomass as response variable and DBH with height as explanatory variables. The significance of the model was demonstrated by F and P values. The model was found a good fit on the basis of values of sum of square (SS) of the residuals and standard error. Homogeneity of variance and normality of residuals were also validated for checking accuracy of the model. The result can be used for estimation of the above ground biomass and carbon stocks in subtropical pine forests of the Khyber Pakhtunkhwa and other areas which represent similar ecological conditions.
Received | April 08, 2019; Accepted | January 30, 2020; Published | February 20, 2020
*Correspondence | Anwar Ali, Pakistan Forest Institute (PFI), Peshawar, Khyber Pakhtunkhwa, Pakistan; Email: anwerforester@gmail.com
Citation | Ali, A., M.I. Ashraf, S. Gulzar and M. Akmal. 2020. Development of an allometric model for biomass estimation of Pinus roxburghii, growing in subtropical pine forests of Khyber Pakhtunkhwa, Pakistan. Sarhad Journal of Agriculture, 36(1): 236-244.
DOI | http://dx.doi.org/10.17582/journal.sja/2020/36.1.236.244
Keywords | Biomass, Carbon, Allometric equation, Pinusroxberghii, Pakistan
Introduction
Forests play an important role in the climate change mitigation. They sequester CO2 from the atmosphere when they grow and store the CO2 in biomass. The world’s forest ecosystems hold more than half of all the terrestrial carbon (Smith et al., 1993). This accounts for 90% of the annual CO2 fluxes between atmosphere and land surface (Streck and Scholz, 2006). According to FAO (2015), the world’s forests store 296 Gt of carbon in biomass alone. Due to emergence of REDD+ (Reducing emissions from deforestation, forest degradation, sustainable forest management and conservation and enhancement of carbon stocks in forests) as a promising mechanism for climate change mitigation in forestry sector in developing countries, it is required to estimate biomass and carbon stocks of standing trees in forests (Agarwall et al., 2011).
Allometric models are empirical equations which are used to predict biomass of standing trees from inventory data of forests (Chave et al., 2014). Allometric models could be used to predict biomass of a tree on the basis of easily measureable variables like stem diameter, tree height and crown diameter (Jara et al., 2015). These models can, thus, be used to estimate biomass of standing trees in a forest ecosystem by measuring its variables such as diameter at breast height (DBH), tree height, crown diameter and wood density. (Goodman et al., 2014). Allometric equations based on different regression models involve dependent variables such as biomass and independent variables such as DBH and height of tree. There are non-linear and linear models, which depends upon objective and involvement of explanatory variables in a model (Moussa and Mahamane, 2018).
Allomteric equations have been developed to estimate biomass of different trees using several variables as predictors or independent variables. Parameters such as DBH, total height, volume, basal area, density and crown diameter are common variables to be used for the estimation of a tree biomass (Mandal et al., 2013; Goodman et al., 2014). However, DBH is the most commonly used independent variable for biomass estimation. It is due to its ease in measurement and strong correlation with tree volume and biomass. It can be used as a single biomass predictor in allometric models or can be combined with other variables such as tree height and density to further improve the estimates. Generic allometric models have been developed for biomass estimation in tropical forests (Chave et al., 2005; Litton, 2008) and African forests (Henry et al., 2011; Mbow et al., 2013; Moussa and Mahamane, 2018). However, few studies have been conducted to develop allometric equations for tree species of temperate mountains. Recently forest biomass estimation has got momentum in Himalayan region with initiation of the REDD+ projects in Pakistan, India, Bhutan and Nepal. Generic models are currently being used in these countries for tree biomass estimation. The use of generic models may not give precise estimation of the forest tree biomass outside the geographical coverage (Cairns et al., 2003; Chave et al., 2005; Litton et al., 2006; Pilli et al., 2006). It is, therefore, essential to develop a species-specific model for accurate estimation of the tree biomass and carbon stocks in forests. In this context, the current study attempts to devise an allometric model for Pinus roxbergii, which is an important tree in subtropical pine forests of Pakistan and other countries of Himalayan Region. Biomass Expansion Factor (BEF) and Basic Wood Density (BWD) were also developed during the current study. Biomass expansion factor is used to convert volume estimates to above ground biomass of a standing tree. It is a factor which expands dry-weight of bole biomass to account for non-merchantable biomass components, such as branches, twigs and foliage (Levy et al., 2004). Basic Wood Density or Specific Gravity is the dry biomass per unit green volume of wood for a given species (IPCC, 2006). Biomass Expansion Factor and BWD were also determined for Pinus roxbergii.
Materials and Methods
Study area and location
The study was conducted in subtropical pine forests of Hazara Forest Region of KP during August-September, 2017. These forests are situated in north west of Pakistan at 330 43’ 30” E to 350 54’ 45” E and 740 11’ 15” N to 720 36’ 45 N” (Bukhari et al., 2012; Ali, 2017). Specific study area included the subtropical pine forests located in the Districts of Haripur, Abbottabad and Mansehra of Hazara Forest Region in KP. These forests are found at an altitude of 925-1675 m above sea level. Moreover, mean annual temperature of the study area ranges between 15oC and 22oC and precipitation varies between 760 mm and 1270 mm mainly falling during July-September (Bukhari and Bajwa, 2012). Pinus roxberghii practically forms almost all of top canopy of the forest (Sheikh, 1993).
Sample size and sampling
A total of 32 trees samples growing in natural stands of Pinus roxberghii in Hazara forest region of KP were randomly selected for the study. The sample trees were felled and measured during 1st August 2017 to 30th September, 2017. Locations of sample trees are shown in Figure 1. The sample is statistically appropriate (n = 32) for development of such type of allometric equations as suggested by a series of similar studies conducted by Ebuy et al. (2011), Mbow et al. (2013) and Moussa and Mahamane (2018). This sample size (n= 32) also minimized the damages caused by felling of sample trees.
Data collection and analysis
For the current study, data were collected on the following variables;
- 1. Diameter at Breast Height (DBH) (cm)
- 2. Tree Height (m)
- 3. Tree biomass (Kg)
- • Trunk biomass (Kg)
- • Branches biomass (Kg )
- • Brushwood biomass (Kg)
- 4. Basic wood density (Kg/m3)
- 5. Biomass Expansion Factor (BEF)
Diameter at breast height
Diameter at Breast Height (DBH) was measured at 1.37m above the ground on uphill side with diameter tape measuring up to one decimal in centimeter. Sample trees were arranged in groups based on their diameter from 10 cm to 100 cm with a diameter class interval of 10 cm. At least two samples trees per DBH class were randomly selected and measured manually using diameter tape. Efforts were made to select trees of normal shape which represent the forest stands of the area. Only trees of good form and shape having no abnormality i.e. broken top, forked stem, excessive or limited branches were selected for measurement.
Tree height
Total height of standing trees from ground to tip of leading shoot was measured in meters (up to two decimals) with Haglof Vertix, which is a laser based hypsometer. The instrument can measure tree height with an accuracy of ±0.5m. The heights were measured from where tree top and base were visible. Tree height was reaffirmed with the help of measuring tape after felling a tree.
Biomass estimation
Total biomass is the sum total of trunk biomass, branches biomass and brushwood biomass. Therefore, each of these components was separately measured and summed up to calculate total tree biomass. For this purpose, the sample tree was cut with the help of a chain saw as close to ground surface as possible in a pre-decided direction to minimize damage to other trees. Bole of the tree was measured in two sections i.e. timber (20 cm and above diameter) and small wood (5 cm to 19 cm diameter). For this purpose, the boles of all sample trees were marked and cut at points with 20 cm and 5 cm diameters to distinguish and measure timber and small wood separately. Furthermore, after felling, the remaining branches and brushwood were also separated for measurement. The process of biomass estimation for trunk, branches and brushwood is given below.
Trunk biomass
After felling of 32 sample trees each trunk was converted into 2 m logs. Note that sometime the last log was smaller than 2m due to natural variation in total tree length. The fresh weight of each log was measured on spot in two ways i.e. direct and indirect weight measurement. For direct weight measurement a digital weighing machine was used which has the capacity to weigh up to 1000 kg. The logs weighing higher than 1000 kg were measured through indirect method i.e. volume and density of each log were measured and multiplied with each other to get weight/biomass of the log. Volume of these un-weighable logs was determined by measuring the over bark mid diameter and length using Huber’s formula Equation 1:

Where;
D is diameter over-bark at midpoint and L is length of log.
Furthermore, three discs were collected from logs of each stem and branches for determination of dry and fresh weights of these components. Fresh weights of discs were determined on the spot and discs were shifted to laboratory for oven drying. The discs and samples of branches including brushwood and bark were dried in oven at 105oC till constant weight (Picard et al., 2012). Moisture content (MC) in a sample was calculated by using the Equation 2:

The dry weight of a component was determined by subtracting its moisture content (%) from fresh weight of the respective component.
Branches biomass
Branches (above 5cm diameter) were separated from brush wood and their fresh weight was recorded on a 1000 kg electronic balance. Representative samples were taken from branches and packed in bags with a proper labeling. The samples were transported to Pakistan Forest Institute (PFI) for drying in oven at 105°C for 24 hours. Moisture contents so obtained were subtracted from fresh weight to determine dry weight (dry biomass) of the branches.
Brushwood biomass
Brushwood comprising small branches with diameter less than 5 cm along with needles were separated and their fresh weight was recorded on electronic balance. Representative samples were taken from brushwood and packed in bags with a proper labeling. The samples were transported to Pakistan Forest Institute (PFI) for drying in oven at 105°C for 24 hours. Moisture contents so obtained were subtracted from fresh weight to determine dry weight (dry biomass) of the brushwood.
Basic wood density
Basic wood density (BWD) refers to dry weight per unit volume of the wood and was determined by using graduated cylinder method (Henry et al., 2010). Three to five discs of 10 cm thickness were measured from base, middle and top of the bole of every sample tree. Discs were also taken from branches. Discs were marked with tree and section numbers (e.g. S1, S2, S3) before taking fresh weights (g) in field. The volumes of discs were measured (cm3) by immersing in water in a graduated cylinder to record the level of water displacement in the cylinder with immersing discs. The difference in the water level gives the volume of the discs. After determining volume, discs were oven dried at 105oC to determine dry weight of the discs. BWD (gram per cubic centime) was determined by using Equation 3.

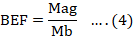
Biomass expansion factor
Biomass Expansion Factor (BEF) was determined by measuring total aboveground biomass of a sample tree and aboveground biomass of the bole till top diameter of 5 cm. The contributions of trunk, branches and brush wood in the total biomass of the sample trees were also determined. BEF (a unit-less ratio) was determined using Equation 4:
Where;
Mag is the total above-ground dry biomass of a tree in Kg and Mb is the dry biomass of the tree bole with top diameter upto 5 cm in Kg.
Development and validation of regression model
The following regression models were tested in the current study to select best model for biomass estimation of Pinusroxberghii.
M = a+bD ….(5)
M = a+bD2 .…(6)
M = a+bD+cD2 …..(7)
M = a+bD2H …..(8)
ln M = a+bD …..(9)
M = aDb ……(10)
Where;
M= Dry Biomass of tree in Kg; D= Diameter at Breast Height in cm; H= Total height of tree in m; ln= Natural Logarithm; a= regression constant; b, c= regression coefficients.
The above regression models were evaluated through different regression parameters such standard error and sum of square of the residuals for their reasonability, efficiency, practicability and statistical validity. A model is considered reasonable if it yields estimates with minimum standard error (SEE), minimum sum of square of the residual error (SSE) throughout the range of data, does not give negative estimates and does not show decrease in biomass with increase in DBH or Height (Ahmad and Husain, 1994). The equation is considered efficient if it yields accurate estimate and controls the bias. The estimates beyond the range of data i.e. extrapolated values should not be unrealistic or exaggerated. The equation is practicable if it is easy to calculate and use meaning that the equation should not depend on a large number of variables. Statistical validity is judged on the basis of the ‘indices of best fit’ including R2 which is the determination coefficient indicating the variance explained by the model. The value of R2 closer to 1 indicates high quality of the fit. On the other hand, SSE and SEE should be minimum whereas F and P values of the models should be significant.
The data underwent logarithmic transformation using SPSS 16 to enable linear regression. Linear regression models used for biomass estimation are based on two assumptions, i.e. normality of the residuals and homogeneity of variance of residuals (Picard et al., 2012; Mascaro et al., 2014). The hypothesis pertaining to normality of the residuals was validated by visually inspecting the quantile–quantile graph which showed the empirical quantiles of the residuals against the theoretical quantiles of the standard normal distribution. As the points are approximately aligned along a straight line, the hypothesis is largely satisfied. The hypothesis of constant variance was verified by plotting the cluster of points for the residuals against predicted values. As this cluster of points did not show any particular trend or structure, it was verified that the variance of the residuals is homogenous (Picard et al., 2012). Linear regression is considered satisfactory for a biomass model if normality and homogeneity of residuals are validated (Makungwa et al., 2013).
All seven regression models were tested and evaluated on the following criteria.
- i. Minimum sum of square of the residual error
- ii. Minimum standard error of the estimate
- iii. Maximum value of R2
The estimates yielded by the finally selected model were compared with already published models (e.g. Chave et al., 2005; West et al., 1999).
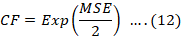
Correction factor (CF)
As logarithmic transformation of data results in underestimation when data is transformed back to arithmetic form, therefore, correction factor was developed to avoid back transformation problem. Thus, the arithmetic model is multiplied by the correction factor close to 1 (Chave et al., 2005; Mascaro et al., 2011). Correction Factor (FC) was calculated using the following formula:
Where;
CF is the correction factor, MSE is the mean squared error of the regression and Exp is the exponential function.
Results and Discussion
Biomass model
Out of seven models tested in this study, the model M = a(D2H)b (Equation 11) gave the best fit (r2=0.99). Strong relationship exhibited between biomass as response variable and square of the diameter and height (D2H) as predictive variable. The pictorial representation of the model is shown in Figure 2. The significance of the model and its parameters were verified by F and P values. Other parameters like standard error of the estimates, sum of squares (SS) and mean squares of residuals also indicated good fit for the model (Table 1). Ahmed and Husain (1994) reported that standard error of estimate, sum of square and mean square of residuals are crucial tests for validating allometric models. Logarithmic transformation of predictive and response variables was applied to develop the allometric model as given below:
M = 0.0224 (D2H)0.9767 or M= exp {-3.7987 + 0.9767Ln(D2H)}
Where;
M= Aboveground Dry Biomass of tree in Kg; D= Diameter at Breast Height in cm; H= Total height of tree in m; Ln= Natural Logarithm.
Variance of the residuals
The residuals plot (Figure 3) shows that residuals are scattered around zero and do not show any trend or structure confirming the hypothesis of homogeneity of variance of the residual error. These results are in line with findings of Moussa and Mahamane (2018) who reported that variance of the residuals can be verified by assessing the spread of the residuals.
Normality of residuals
Normality of the residuals was validated by spread of the residuals as a function of normal quantiles distribution and can be visually inspected from Quantile-Quantile graph of residuals of empirical
Table 1: Statistical variables of the different models tested in the study.
| Regression model | Allometric equation | SEE | F value | P value | SS of Residuals | MSE |
R2 |
| M = a+bD | M = - 1513.821+62.553D | 430.634 | 322.062 | .000 | 5192482.350 | 185445.798 | 0.920 |
|
M = a+bD2 |
M= -230.887+0.613D2 |
228.732 | 1.213E3 | .000 | 1464913.014 | 52318.322 | 0.977 |
|
M = a+bD+cD2 |
M=-76.127- 13.938D+ 0.743D2 |
222.973 | 639.370 | .000 | 1342358.082 | 49716.966 | 0.980 |
| ln M = a+bD | LnM= 40.743+1.062D | 0.475 | 242.855 | .000 | 6.321 | 0.226 | 0.897 |
|
M = aDb |
M= 0.032D2.675 |
0.174 | 1.993E3 | .000 | 0.847 | 0.030 | 0.986 |
|
M = a+bD2H |
M= 22.182+0.017D2H |
203.102 | 1.546E3 | .000 | 1155011.621 | 41250.415 | 0.982 |
|
M = a(D2H)b |
M = 0.022(D2H)0.977 |
0.133 | 3.406E3 | .000 | .499 | .018 | 0.992 |
*Where M is Biomass in Kg, a and b are regression co-efficients, D is diamter in centimeter, H is Height in meter, SEE is standard Error of the Estimate, SS is sum of Square and MSE is Mean Square Error.
qunartiles when plotted against theoretical standard (Packard, 2013). The visual inspection of Quantile-Quantile graph (Figure 4) shows that the empirical quintiles of the residuals are normally distributed against the theoretical of standard normal distribution and these empirical quantiles are aligned along the straight line. This shows that the residuals of the models are normally distributed. The two conditions of homogeneity and normality of the residuals validate the good fit of the model for its applicability. In published literature of Xiao et al. (2011) and Packard (2013) also confirmed the normality of the residuals while applying logarithmic transformation for linear regression.
Correction factor
The methodology used to devise the allometric model of biomass estimation is based on logarithmic conversion of dependent and independent variables to achieve homogeneity of residual errors (Mascaro et al., 2014; Xiao et al., 2011). One of the main problems in logarithmic conversion of data is introduction of error when data are back transformed. To overcome this problem, correction factor was determined. Correction factor closer to one reduces error in biomass estimation (Mascaro et al., 2011; Wauters et al., 2008). In the current study the estimated correction factor was 1.009 which is equivalent to 1 and fulfills the above mentioned standard of correction factor. Moreover, multiplication with correction factor 1 means no change in the predicted biomass at all. Based on the estimated correction factor of the model (1.009) it is safe to conclude that the model is satisfactory in biomass estimation.
Basic wood density
The calculated basic wood density of Pinus roxberghii ranged from 0.308 to 0.652 g cm-3 with an average value of 0.478±0.006 g cm-3. The calculated basic wood density is in consonance with the average BWD calculated and presented by IPCC (2006).
Biomass expansion factor (BEF)
The biomass expansion factor is a unit less ratio of bole biomass and its corresponding tree biomass. The value of BEF is calculated for trees having 20 cm and above diameter at breast height (IPCC, 2006). The calculated BEF value for Pinus roxberghii, in the current study ranged from 1.12 to 1.88 with an average value of 1.33±0.044. These results are within the range of results published by Ali et al. (2016) who found that BEF for Cedrus deodara was 1.37. In another study conducted by Levy et al. (2004) determined the BEF for coniferous species of Great Britain was 1.43.
Furthermore, the contributions of stem, branches and brushwood in the aboveground biomass of Pinus roxberghii were 77.37%, 13.43% and 9.2% respectively. It was further found that bark constitutes 10.8% of the total biomass of stem and branches. These findings can be compared with Rana et al. (1989) who found the contribution of stem, branches and leaves in the aboveground biomass of Pinus roxberghii as 77.71%, 18.34% and 3.95% respectively.
Conclusions and Recommendations
This study found that the product of diameter square and height (D2H) is the best predictor and power model is the best regression model for estimation of aboveground biomass in Pinus roxberghii. Logarithmic transformation of data enabled the homogeneity of variance of residuals. Results indicated strong relationship between biomass as response variable diameter square and height (D2H) as explanatory variables. Biomass (M)= 0.0224 (D2H)0.9767 or M= exp {- 3.7987 + 0.9767Ln (D2H)} was the final allometric equation based on the selected regression model. The R2 of the model was 0.99. The significance of the model was proved by F and P values. Other parameters like Standard Error of Estimate, sum of square (SS) and mean square of the residuals reflected good fit of the model. A correction factor of 1.009 was developed to be multiplied with arithmetic model to overcome the problem of back transformation. The Biomass Expansion Factor (BEF) for Pinus roxberghii ranged from 1.12 to 1.88 with an average of 1.33±0.044 for trees with Diameter at Breast Height (DBH)>20 cm. The proportion of bole, branches and brushwood in the aboveground biomass of Pinus roxberghii was found to be 77.37%, 13.43% and 9.24% respectively. The average basic wood density of Pinus roxberghii was determined as 0.478±0.006 g/cm3. The developed model can be used to estimate aboveground biomass and carbon stocks in the subtropical pine forests.
Acknowledgements
This research study has been carried out as a part of doctoral dissertation of the first author at Arid Agriculture University, Rawalpindi, Pakistan. The financial support provided by the Government of Khyber Pakhtunkhwa for the study is gratefully acknowledged. Thanks are also extended to the staff of Forest Mensuration Branch, Pakistan Forest Institute, Peshawar for their help in data collection in the field.
Novelty Statement
This research paper is based on the first ever study to develop allometric model for biomass estimation of Pinus roxberghii in Pakistan.
Author’s Contribution
Anwar Ali: Conceived the idea, collected and analyzed the data and drafted the manuscript.
M. Irfan Ashraf: Edited the manuscript.
Saeed Gulzar: Guided data collection and process of analysis.
Muhammad Akmal: Assisted in data analysis and manuscript writing.
Conflict of interest
There is no conflict of interest among authors.
References
Agrawal, A., D. Nepstad and A. Chhatre. 2011. Reducing emissions from deforestation and forest degradation. Annu. Rev. Environ. Resour. 36: 373–396. https://doi.org/10.1146/annurev-environ-042009-094508
Ahmed, J. and R.W. Husain. 1994. Biomass production of common farmland trees, Gilgit Region. Aga Khan Rural Support Programme, Gilgit, pp. 55.
Ali, A., I. Muhammad, S. Ali and A. Khan. 2016. Development of allometric equation for biomass estimation of Cedrus deodara in dry temperate forests of Northern Pakistan. J. Biodivers. Environ. Sci. (JBES) 9(2): 43-50.
Ali, A., 2017. Forest cover mapping of Khyber Pakhtunkhwa. Pak. For. Inst., Peshawar.
Brown, S., A.J.R. Gillespie and A.E. Lugo. 1989. Biomass estimation methods for tropical forests with applications to forest inventory data. For. Sci., 35: 881–902.
Brown, S. and L.R. Iverson. 1992. Biomass estimates for tropical forests. World Resour. Rev. 4: 366-384.
Brown, S., 1997. Estimating biomass and biomass change of tropical forests: A primer. UN FAO Forestry Paper 134. Food Agric. Organiz., Rome, Italy. http://www.fao.org/dorcep
Brown, I.F., L.A. Martinelli, W.W. Thomas M.Z. Moreira, R.A. Victoria and C.A.C. Ferreira.1995. Uncertainty in the biomass of Amazonian forests: an example from Rondoˆnia, Brazil. For. Ecol. Manage. 75(1–3):175–189. https://doi.org/10.1016/0378-1127(94)03512-U
Bukhari, S.S.B. and G.A. Bajwa. 2012. Development of national response strategy to combat impacts of climate change on forests of Pakistan. Pak. For. Inst., Peshawar, pp. 155.
Bukhari, S.S.B., A. Haider and M.T. Laeeq. 2012. Landcover Atlas of Pakistan. Pak. For. Inst., Peshawar.
Cairns, M.A., I. Olmsted, J. Granados and J. Argaez. 2003. Composition and aboveground tree biomass of a dry semi-evergreen forest on Mexico’s Yucatan Peninsula. For. Ecol. Manage. 186: 125–132. https://doi.org/10.1016/S0378-1127(03)00229-9
Cannell, M.G.R., 1984. Woody biomass of forest stands. For. Ecol. Manage. 8: 299–312. https://doi.org/10.1016/0378-1127(84)90062-8
Chave, J., C. Ansalo and C. Brown. 2005. Tree allometry and improved estimation of carbon stocks and balance in tropical forests. Oecologia, 145: 87-99. https://doi.org/10.1007/s00442-005-0100-x
Chave, J., M. Rejou-Mechain, A. Burquez, E. Chidumayo, M.S. Colgan and W.B.C. Delitti. 2014. Improved allometric models to estimate the aboveground biomass of tropical trees. Glob. Change Biol. 20: 3177–3190. https://doi.org/10.1111/gcb.12629
Ebuy, J., J.P. Lokombe, Q. Ponette, D. Sonwa and N. Picard. 2011. Allometric equation for predicting aboveground biomass of three tree species. J. Trop. For. Sci., 23: 125–132.
FAO. 2015. Learning tool on Nationally Appropriate Mitigation Actions (NAMAs) in the agriculture, forestry and other land use (AFOLU) sector. Rome: FAO.
Goodman, R.C., O.L. Phillips and T.R. Baker. 2014. The importance of crown dimensions to improve tropical tree biomass estimates. Ecol. Appl., 24(4): 680–698. https://doi.org/10.1890/13-0070.1
Henry, M., A. Besnard, W.A. Asante, J. Eshun, S. Adu-Bredu, R. Valentini, M. Bernoux and L. Saint-André. 2010. Wood density, phytomass variations within and among trees and allometric equations in a tropical rainforest of Africa. For. Ecol. Manag. 260(8): 1375–1388.
Henry, M., N. Picard, C. Trotta, R. Manlay, R. Valentini, M. Bernoux and L. Saint-Andre. 2011. Estimating tree biomass of sub-Saharan African forests: a review of available allometric equations. Silva Fenn. 45: 477–569. https://doi.org/10.14214/sf.38
IPCC. 2006. IPCC guidelines for national greenhouse gas inventories. Volume 4: AFOLU. Available from: http://www.ipcc-nggip.iges.or.jp/public/2006gl/index.html.
IPCC. 2007. Summary for policymakers: Synthesis report. An assessment of the intergovernmental panel on climate change. Available from: http://www.ipcc.ch/pdf/assessment-report/ar4/syr/ar4_syr_spm.pdf.
Jara, M.C., H. Henry, M. Re´jou-Me´chain, C. Wayson, M. Zapata-Cuartas, D. Piotto, F.A. Guier, H.C. Lombis, E.C. Lo´pez, R.C. Lara, K.C. Rojas, J.D.A. Pasquel, A.D. Montoya, J.F. Vega, A.J. Galo, O.R. Lo´pez, L.G. Marklund, J.M.M. Fuentes, F. Milla, J.N. de Chaidez, E.O. Malavassi, J. Pe´rez, C.R. Zea, L.R. Garcı´a, R.R. Pons, L. Saint-Andre´ C. Sanquetta C. Scott and J. Westfall. 2015. Guidelines for documenting and reporting tree allometric equations. Ann. Sci., 72: 763–768. https://doi.org/10.1007/s13595-014-0415-z
Levy, P.E., S.E. Hale and B.C. Nicoll. 2004. Biomass expansion factors and root: Shoot ratios for coniferous tree species in Great Britain. Forestry 77(5): 421-430. https://doi.org/10.1093/forestry/77.5.421
Litton, M.C., 2008. Allometric models for predicting aboveground biomass in two widespread woody plants in Hawaii. Biotropica. 40(3): 313–320. https://doi.org/10.1111/j.1744-7429.2007.00383.x
Litton, C., M.D.R. Sandquist and S. Cordell. 2006. Effects of nonnative grass invasion on aboveground carbon pools and tree population structure in a tropical dry forest of Hawaii. For. Ecol. Manage. 231: 105–113. https://doi.org/10.1016/j.foreco.2006.05.008
Mandal, R.A., B.K.V. Yadav, K.K. Yadav, I.C. Dutta and S.M. Haque. 2013. Development of allometric equation for biomass estimation of Eucalyptus camaldulensis: A study from Sagarnath Forest, Nepal. Int. J. Biodivers. Ecosyst. 1(1): 001-007.
Makungwa, S.D., A. Chittock, D.L. Skole, G.Y. Kanyama-Phiri and I.H. Woodhouse. 2013. Allometry for biomass estimation in jatropha trees planted as boundary hedge in farmers’ fields. Forests. 4: 218–233. https://doi.org/10.3390/f4020218
Mascaro, J., C.M.R. Litton, F. Hughes, A. Uowolo and S.A. Schnitzer. 2011. Minimizing bias in biomass allometry: model selection and logtransformation of data. Biotropica. 43(6): 649–653. https://doi.org/10.1111/j.1744-7429.2011.00798.x
Mascaro, J., C.M. Litton, F. Hughes, A. Uowolo and S.A. Schnitzer. 2014. Is logarithmic transformation necessary in allometry? Ten, onehundred, one-thousand-times yes. Biol. J. Lin. Soc. 111: 230–233. https://doi.org/10.1111/bij.12177
Mbow, C., M.M. Verstraete, B. Sambou, A.T. Diaw and H. Neufeldt. 2013. Allometric models for aboveground biomass in dry savanna trees of the Sudan and Sudan Guinean ecosystems of Southern Senegal. J. For. Res. 19: 340–347. https://doi.org/10.1007/s10310-013-0414-1
Moussa, M. and L. Mahamane. 2018. Allometric models for estimating aboveground biomass and carbon in Faidherbia albida and Prosopis Africana under agroforestry parklands in drylands of Niger. J. For. Res. 29(6): 1703-1717. https://doi.org/10.1007/s11676-018-0603-z
Packard, G.C. 2013. Is logarithmic transformation necessary in allometry? Biol. J. Linnean Soc. 109: 476–486.
Picard, N., L. Saint-André and H. Henry. 2012. Manual for building tree volume and biomass allometric equations: from field measurement to prediction. Food and Agricultural Organization of the United Nations, Rome, and Centre de Coopération Internationale en Recherche Agronomique pour le Développement, Montpellier.
Pilli, R., T. Anfodillo and M. Carrer. 2006. Towards a functional and simplified allometry for estimating forest biomass. For. Ecol. Manage. 237: 583–593. https://doi.org/10.1016/j.foreco.2006.10.004
Rana, B.S., S. Singh and R. Singh. 1989. Biomass and net primary productivity in central Himalayan forests along altitudinal gradient. J. Forest Ecol. Manage. 27: 199-218
Sheikh, M.I., 1993. Trees of Pakistan. Pakistan Forest Institute, Peshawar, pp. 142.
Smith, T., W. Cramer, R. Dixon, R. Leemans, R. Neilson and A. Solomon. 1993. The global terrestrial carbon cycle. Water, Air Soil Pollut., 70: 19-37. https://doi.org/10.1007/978-94-011-1982-5_2
Streck, C. and S. Scholz. 2006. The role of forests in global climate change: whence we come and where we go. Int. Aff., 82(5): 861-879. https://doi.org/10.1111/j.1468-2346.2006.00575.x
Wauters, J.B., S. Coudert, E. Grallien, M. Jonard and Q. Ponette. 2008. Carbon stock in rubber tree plantations in western Ghana andMato Grosso (Brazil). For. Ecol. Manag. 255: 2347–2361. https://doi.org/10.1016/j.foreco.2007.12.038
West, G.B., J.H. Brown and B.J. Enquist. 1999. A general model for the structure and allometry of plant vascular systems. Nature, 400: 664-667
Williamson, G.B. and M.C. Wiemann. 2010. Measuring wood specific gravity correctly. Am. J. Bot. 97(3): 519–524. https://doi.org/10.3732/ajb.0900243
Xiao, X., E.P. White, M.B. Hooten and S.L. Durham. 2011. On the use of log transformation vs. nonlinear regression for analyzing biological power laws. Ecol. 92: 1887–1894. https://doi.org/10.1890/11-0538.1
To share on other social networks, click on any share button. What are these?


