

Comparison of Models for some Testicular Characteristics in Karakaş Male Lambs


Comparison of Models for some Testicular Characteristics in Karakaş Male Lambs
Kadir Karakuş1, Turgut Aygün2, Şenol Çelik3, Mohammad Masood Tariq4*, Muhammad Ali4, Majed Rafeeq4 and Farhat Abbas Bukhari4
1Department of Animal Science, Faculty of Agriculture, Malatya Turgut Özal University, Malatya, Turkey
2Department of Animal Science, Faculty of Agriculture, Van Yüzüncü Yıl University, Van-Turkey
3Biometry Genetics Unit, Department of Animal Science, Faculty of Agriculture, Bingöl University, Bingöl-Turkey
4Center for Advanced Studies in Vaccinology and Biotechnology, University of Balochistan, Quetta, Balochistan, Pakistan
ABSTRACT
This study was aimed to search testis growth of Karakaş male lambs raised in intensive conditions and to build the forecasting model of live weight in lambs using 4 data mining CHAID, Exhaustive CHAID, CART, and multivariate adaptive regression splines (MARS). Effects of genotype and some environment factors such as birth type, dam age, lamb’ age in control and live weight on testis characteristics were also researched. The furthest importance sequence was obtained for testis length (TESLENG) (100%), followed by age, testis diameter (TDIA), age in control (DAGE), birth weight (BW), around scrotum (SCC), scrotum length (SCL) and birth type (BT). TDIA > 8.5 and DAGE will provide 21.06 unit to live weight (LW). BW > 4.2 will provide 18.43 kg to LW. TESLENG > 8.5, SCC < 2.4 and SCL will provide 8.227 to LW. TDIA < 4.5 and TESLENG > 9 will provide 4.095 to LW. Analytic results shown that MARS outperformed CHAID, Exhaustive CHAID, and CART approaches in terms of R2, Adj. R2, RMSE, SD ratio, MAPE and AIC provided effective alternatives for forecasting live weight of lambs. Purpose of MARS algorithm having very high predictive precision in the prediction of LW from body features may put onward a new view point for 39 lambs breeders.
Article Information
Received 12 February 2019
Revised 22 May 2019
Accepted 10 June 2019
Available online 17 August 2020
Authors’ Contribution
KK and TA collected the data. TA planned the study. ŞÇ analyzed data statistically. KK, ŞÇ and MMT wrote the article, MA, MR and FAB reviewed the article.
Key words
Lamb, Testis, Live weight, MARS, Data mining
DOI: https://dx.doi.org/10.17582/journal.pjz/20190212120218
* Corresponding author: tariqkianiraja@hotmail.com
0030-9923/2020/0006-2047 $ 9.00/0
Copyright 2020 Zoological Society of Pakistan
INTRODUCTION
Testis characteristics (testis diameter, testis length, scrotum circumference and scrotum length) were used as indirect selection criteria in breeding studies with increasing fertility (Yılmaz and Aygün, 2002). The testis characteristics were highly correlated with the scrotal environment and spermatological features. It can be measured in the early stages of growth, high heritability, the number of spermatogenesis and the number of eggs obtained from females. It is important in genetic breeding studies to be done (Bilgin et al., 2004; Yanli et al., 2017).
Significant correlations have been reported between testis characteristics (Salhab et al., 2001). Species affecting the development of testis, growing systems, season, age, body weight, hormones, etc. there are factors (Aygun et al., 1999; Gundogan et al., 2002). There are also differences in testicular characteristics and the amount of hormones associated with seasonal changes (Milczewski et al., 2015). Among these factors, age and body weight have been reported to have significant effects on the scrotal circumference (Yılmaz and Aygün, 2002). There are studies conducted in different races in order to determine the relationships with sexual activity, growth and testis characteristics in the early periods (Belibasaki and Kouimtzis, 2000). There are studies comparing growth models to define the development of the scrotal circumference in sheep and cattle (Bilgin et al., 2004; Quirino et al., 1999; Loaiza-Echeverri et al., 2013; Santana et al., 2015). Different statistical analysis methods were used in the studies (Karakuş et al., 2010). In order to determine the relationship between live weight, age and testis characteristics, there are many studies in different breed lambs (Sarı et al., 2013; Celik et al., 2017). However, although there are few reported studies on the use of non-linear models to describe the growth of the scrotal environment in Karakaş male lambs, there are almost no studies with the recently developed models.
The aim of this study is to investigate the effect of birth weight, birth type, age of dam, age in control, testicular diameter, testicular length, scrotum circumference and scrotum length on the live weight in Karakaş lambs by the algorithms of MARS, CHAID, Exhaustive CHAID and CART.
MATERIALS AND METHODS
Material
In this study, it were used Karakaş male lambs (n= 39) as animal material raised in intensive conditions at Research and Practice Farm of Van Yüzüncü Yıl University. Effects of genotype and some environment factors such as birth type, dam age, lamb’ age in control and live weight on testis characteristics were also researched.
Methods
In male lambs, it were determined testis diameter, testis length, scrotum circumference, and scrotum length as testis characteristics. Chi-squared automatic interaction detection (CHAID) algorithm, originally proposed by Kass (1980) and further developed by Magidson (1993), is a well-known and widely used decision tree (DT) algorithm which constructs a tree using a recursive partitioning method.
In CHAID trees, the homogeneity of the groups generated by the tree is evaluated by a Bonferroni corrected p-value obtained from the chi square statistic applied to two-way classification tables with C classes and K splits for each tree node (Maroco et al., 2011):
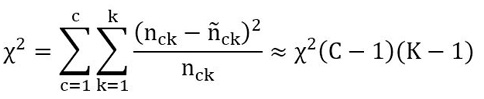
Where nck refers to the actual frequencies of cell ck and ñck k is the expected frequencies under the null hypothesis of two-way homogeneity.
The Exhaustive CHAID (Biggs et al., 1991) has the same splitting and stopping steps as CHAID but the merging step is more exhaustive than CHAID, by continuing to merge categories of the predictor variable until only two super categories are left.
CART (Classification and Regression Tree) is a method of machine learning that was proposed by Breiman et al. (1984). Suppose that x1, x2, …, xn are the input variables and that y is the output variable for a training dataset in the space D with n input variables and m input samples. Let D= {(x11,x12,…..x1n, y1), ={(x21,x22,…..x2n, y2), ={(xm1,xm2,…..xmn, ymn)} CART splits D into a certain number of subspaces using a binary recursive process. Every subspace has an estimated value y ̂determined by fitting using the least squares method; the optimal splitting variable j and splitting point s are finally selected to ensure that the binary division has the minimum residual variance as follows:

Each child node is treated as a potential parent node in the next division process until the homogeneous divisions, or terminal nodes, are obtained (Herold et al., 2003).
Multivariate Adaptive Regression Splines (MARS) is a form of multivariable nonparametric regression analysis introduced by Friedman (1991). The basic opinion is to add up sections of spline’s basis function (BF) to form a flexible MARS prediction model, to determine the value of the function of the basic equations by referring to the cross-validation among the parameters, and to assess its loss of fit by the judging criteria in order to get the best and the most suitable variables set, knots, and the interaction to solve various high-dimensional data problems (Friedman, 1991).
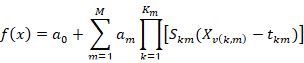
The above formula is a common MARS model, in which BF is the multiple regressed section, which changes mainly based on demand.
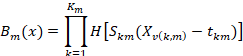
Here, a0 and am are the parameter values. M is BF’s quantity determined by the judgment criteria; Km is the knot quantity; the value of Skm is +1 or-1 and its function is to show the direction; v(k,m) is the variable label; tkm is the cut-off point (Steinberg et al., 1999).
The optimal MARS model is selected in a two-stage process. Firstly, MARS constructs a very large number of basis functions to over-fit the data initially, where variables are allowed to enter as continuous, categorical, or ordinal are defined, and they can interact with each other or be restricted to enter in only as additive components. In the second stage, basis functions are deleted in the order of least contributions using the generalized cross validation (GCV) criterion (Friedman, 1991). GCV is given by (Kornacki and Ćwik, 2005).
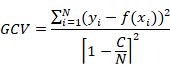
with,
C=1+cd
where N is the number of cases in the data set, d is the effective degrees of freedom, which is equal to the number of independent basis functions. The quantity c is the penalty for adding a basis function. Experiments have shown that the best value for C can be found somewhere in the range 2 < d < 3 (Hastie et al., 2001).
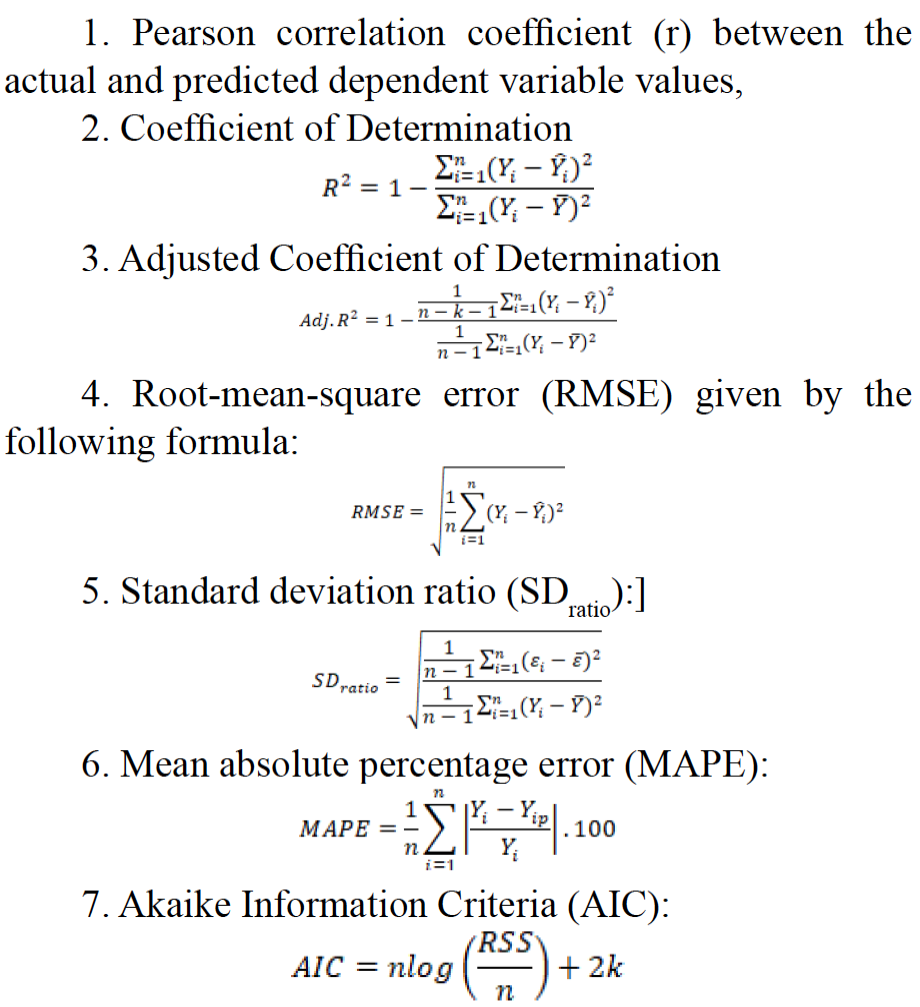
In order to comparatively test the predictive performance of data mining algorithms, the following goodness of fit criteria were calculated (Willmott and Matsuura, 2005; Liddle, 2007):
RESULTS
Descriptive statistics values of the body sizes of Karakaş male lamb are given in Table I.
Table I. Descriptive statistics of body sizes belong to male lamb.
|
n |
Min. |
Max. |
Mean |
SD |
SE |
|
|
BW |
229 |
2.80 |
5.30 |
3.759 |
0.588 |
0.039 |
|
AGE |
229 |
211.00 |
379.00 |
271.952 |
33.547 |
2.217 |
|
DAGE |
229 |
2 |
6 |
3.895 |
1.456 |
0.096 |
|
LW |
229 |
17.00 |
53.00 |
32.528 |
8.224 |
0.543 |
|
TEDIA |
229 |
1.50 |
6.75 |
3.261 |
1.055 |
0.070 |
|
TESLENG |
229 |
3.15 |
12.00 |
6.783 |
1.948 |
0.129 |
|
SCC |
229 |
10.00 |
32.00 |
19.811 |
5.443 |
0.360 |
|
SCLENG |
229 |
6.00 |
16.50 |
10.424 |
2.115 |
0.140 |
SD: Standard Deviation, SE: Standard Error; BW: Birth weight (kg), AGE: Lamb’s age (day), DAGE: Dam age (year), LW: Live weight in control (kg), TEDIA: Testis Diameter (cm), TESLENG: Testis length (cm), SCC: Scrotum circumference (cm), SCLENG: Scrotum length (cm).
The goodness of fit statistics developed to determine the appropriate methods in order to create the live weight prediction model are given in Table II.
When Table II is analyzed, MARS method’s r, R2 and Adj. R2 values are the highest, and SD ratio, RMSE, MAPE and AIC values are the lowest among the other goodness of fit criteria. According to these criteria, the best method is the MARS method. MARS model is obtained for the smallest GCV, 4th order interaction for Karakaş male lambs. The GCV value of this MARS model was 8.6. Model goodness of fit criteria (0.930 R2, 0.919 Adj. R2, 0.265 SD ratio, 2.177 RMSE, 5.796 MAPE and 416 AIC) displayed the highest predictive accuracy of the model structured based on MARS algorithm. Besides, correlation coefficient of 0.964 indicated a perfect agreement between the observed and the fitted LW scores for MARS predictive modeling (t =54.767, df = 227, p-value < 2.2e-16). The best models for estimating live weight of Karakaş male lambs are respectively MARS > CART > CHAID > Exhaustive CHAID. In the modeling of MARS prediction model, the variable selection results and obtained basis functions can be showed in Table III. It is observed that the used 30 forecasting variables do play of great importance roles in deciding the MARS forecasting models. Outside, the acquired basis functions and the MARS prediction function can provide important implications above the prediction variables.
The LW expressions in terms of the 30 basic functions for the MARS model are presented in below. The importance of the independent variables is given for predicting LW in Table IV.
Note: This equality is the MARS model equation. An equation was obtained from the independent variables and interactions used to construct the model.
The relative importance of each variable is ordered from large to small in the model. The variables with the greatest relative significance is TESLENG (Table IV).
The codes of the package “earth” of R software for statistical analysis of MARS algorithm can show in Appendix.
The regression tree diagram of the CHAID, Exhaustive CHAID and CART algorithms are presented in Figures 1, 2 and 3, respectively.
Table II. Goodness of fit criteria.
|
Model |
r |
R2 |
Adj. R2 |
SDratio |
RMSE |
MAPE |
AIC |
|
CHAID |
0.913 |
0.834 |
0.831 |
0.407 |
3.340 |
9.456 |
512 |
|
Exhaustive CHAID |
0.896 |
0.803 |
0.801 |
0.444 |
3.643 |
10.433 |
548 |
|
CART |
0.924 |
0.854 |
0.851 |
0.383 |
3.141 |
9.013 |
486 |
|
MARS |
0.964 |
0.930 |
0.919 |
0.265 |
2.177 |
5.796 |
416 |
DISCUSSION
When similar studies are investigated to determine the live weight estimation in animal husbandry, differences may occur due to independent variables (number of animals, species, race, age, type of birth, age of dam and sex), used algorithms and some restrictions (minimum number of nodes, depth of tree structure) on these algorithms for estimation performance. Eyduran (2016) expressed that if there is a multicollinearity problem in multiple regressions in sheep weight estimation, CART, CHAID, Exhaustive
Table III. Results of the MARS algorithm for live weight of lambs.
|
Basic functions |
Coefficients |
Srd. Errror |
t |
|
Intercept |
44.47*** |
0.888 |
50.093 |
|
max(0, TDIA-4.8) |
-63.97*** |
10.07 |
-6.353 |
|
max(0, AGE-304) |
0.226*** |
0.027 |
8.281 |
|
max(0, 304-AGE) |
-0.156*** |
0.026 |
-6.048 |
|
DAGE*max(0, TDIA-4.8) |
21.06*** |
3.432 |
6.135 |
|
max(0, TESLENG-8.5) |
-5.264*** |
1.19 |
-4.424 |
|
max(0, 8.5-TESLENG) |
-3.469*** |
0.235 |
-14.755 |
|
max(0, BW-4.2) |
18.43*** |
2.9 |
6.355 |
|
max(0, AGE-265)*max(0, 4.8-TDIA) |
-0.091*** |
0.018 |
-4.99 |
|
max(0, 265-AGE)*max(0, 4.8-TDIA) |
0.051*** |
0.014 |
3.694 |
|
max(0, 265-AGE)*max(0, 4.8-TDIA)*max(0, SCC-16) |
-0.086*** |
0.023 |
-3.655 |
|
max(0, 4.8-TDIA)*max(0, SCC-21) |
-0.943*** |
0.238 |
-3.955 |
|
max(0, TESLENG-8.5)*max(0, 24-SCC) |
-116.50*** |
29.28 |
-3.978 |
|
max(0, 8.5-TESLENG)*max(0, SCC-22.5) |
1.64*** |
0.318 |
5.163 |
|
max(0, 265-AGE)*max(0, 4.8-TDIA)*max(0, SCC-16) * max(0, SCL-9) |
-0.020*** |
0.0048 |
-4.108 |
|
max(0, 265-AGE)*max(0, 4.8-TDIA)*max(0, SCC-16) * max(0, 9-SCL) |
0.090*** |
0.021 |
4.231 |
|
max(0, TESLENG-8.5)*max(0, 24-SCC)*SCL |
8.227*** |
2.091 |
3.934 |
|
max(0, BW-4.4) |
-30.20*** |
3.769 |
-8.012 |
|
max(0, 4.8-TDIA)*max(0, TESLENG-8.15) |
5.123*** |
1.352 |
3.790 |
|
max(0, 3-DAGE)*max(0, 304-AGE) |
-0.033** |
0.0103 |
-3.240 |
|
max(0, 4.5-BW)*max(0, TESLENG-9) |
4.095** |
1.377 |
2.975 |
|
max(0, BW-3.7)*max(0, 304-AGE)*max(0, 8-TESLENG) |
-0.2*** |
0.034 |
-5.907 |
|
Twin*DAGE*max(0, AGE-304) |
-0.039*** |
0.0097 |
-3.954 |
|
max(0, 265-AGE)*max(0, 4.8-TDIA)*max(0, SCC-17) |
0.123*** |
0.037 |
3.354 |
|
max(0, 265-AGE)*max(0, 4.8-TDIA)*max(0, SCL-10) |
0.145*** |
0.037 |
3.939 |
|
max(0, 265-AGE)*max(0, 4.8-TDIA)*max(0, 10-SCL) |
-0.016** |
0.005 |
-3.167 |
|
max(0, 265-AGE)*max(0, 4.8-TDIA)*max(0, SCL-9.5) |
-0.065* |
0.025 |
-2.556 |
|
max(0, BW-3.5)*max(0, 304-AGE)*max(0, 8-TESLENG) |
0.148*** |
0.026 |
5.633 |
|
max(0, 3.7-BW)*max(0, 304-AGE)*max(0, TDIA-2.95) * max(0, 8-TESLENG) |
0.167** |
0.057 |
2.933 |
|
max(0, BW-4.2)*max(0, 8.5-TESLENG) |
4.243*** |
0.794 |
5.343 |
Table IV. Relative importance of model significantly independent variables.
|
Variables |
GCV |
Number of subsets |
|
TESLENG |
100 |
27 |
|
AGE |
43 |
28 |
|
TDIA |
27.6 |
26 |
|
DAGE |
23.2 |
25 |
|
BW |
19.7 |
23 |
|
SCC |
15.9 |
18 |
|
SCL |
12.1 |
18 |
|
BT |
5.9 |
8 |
BW: Birth weight (kg), AGE: Lamb’s age (day), DAGE: Dam age (year), LW: Live weight in control (kg), TDIA: Testis Diameter (cm), TESLENG: Testis length (cm), SCC: Scrotum circumference (cm), SCL: Scrotum length (cm), BT: Birth type.
CHAID, MLP and MARS would be an alternative to multiple regression analysis. Aksoy et al. (2018) reported that MARS results produce higher estimation performance than multiple regression results. In another study with live weight estimation (Yakubu, 2012), in the CART algorithm applied in Uda rams, the R2 value was found to be 0.62, which is different from our study. Khan et al. (2014) identified R2 as 0.84 in the CHAID algorithm for Harnai sheep. In another study, Ali et al. (2015) found the R2 in the CART, CHAID and Exhaustive CHAID algorithms for the Harnai lambs as 0.826, 0.838 and 0.842, respectively. These values are consistent with the results of our study. RMSE values for Beetal goats in the CART and CHAID algorithms application are 4.469 and 4.157 respectively and the MAPE values are 8.1 and 7.3. Eyduran et al. (2017), for Mengali rams found that R2 in the MARS algorithm, is 0.88. Balta and Topal (2018), in the study of CART algorithm for Hemşin lambs R2 is 0.862. Olfaz et al. (2018), for the Karayaka lambs in CART and CHAID algorithms R2 was found as 0.88, RMSE as 1.612 and 1.623 respectively. These results also support the findings in our study.
CONCLUSION
In the research on live weight of male lambs, the data mining methods such as CHAID, Exhaustive CHAID, CART and MARS algorithms have been found to be very useful. MARS model displayed the best forecasting capability. The knot values found for BW (4.2 kg), TDIA (4.8) and TESLENG (8.5) body measurements in the MARS be possible ensure anticipation for next studies to be carried out on lambs. Determination of MARS algorithm having very high predictive precision in the prediction of LW from body characteristics may put forward a new view point for lamb breeders.
Statement of conflict of interest
The authors declares there is no conflict of interest.
REFERENCES
Aksoy, A., Ertürk, Y.E., Eyduran, E. and Tariq, M.M., 2018. Comparing predictive performances of mars and chaid algorithms for defining factors affecting final fattening live weight in cultural beef cattle enterprises. Pakistan J. Zool., 50: 2279-2286. https://doi.org/10.17582/journal.pjz/2018.50.6.2279.2286
Ali, M., Eyduran, E., Tariq, M.M., Tirink, C., Abbas, F., Bajwa, M.A., Baloch, M.H., Nizamani, A.H., Waheed, A., Awan, M.A., Shah, S.H., Ahmad, Z. and Jan, S., 2015. Comparison of artificial neural network and decision tree algorithms used for predicting live weight at post weaning period from some biometrical characteristics in Harnai Sheep. Pakistan J. Zool., 47: 1579-1585.
Aygün, T., Karaca, O., Altın, T., Demirel, M. and Bingöl, M., 1999. Testicular development in Karakaş and Karakaş x Hamdani (G1) hybrid rams grown in different growth and feeding conditions. YYU J. Inst. Nat. appl. Sci., 6: 53-60.
Balta, B. and Topal, M., 2018. Regression tree approach for assessing the effects of non-genetic factors on birth weight of Hemşin lamb. Alınteri J. agric. Sci., 33: 65-73.
Belibasaki, S. and Kouimtzis, S., 2000. Sexual activity and body and testis growth in prepubertal ram lambs of Friesland, Chios, Karagouniki and Serres dairy sheep in Greece. Small Rum. Res., 37: 109-113. https://doi.org/10.1016/S0921-4488(99)00131-5
Biggs, D., De Ville, B. and Suen, E., 1991. A method of choosing multiway partitions for classification and decision trees. J. appl. Stat., 18: 49-62. https://doi.org/10.1080/02664769100000005
Bilgin, O.C., Emsen, E. and Davis, M.H., 2004. Comparison of non-linear models for describing the growth of scrotal circumference in Awassi male lambs. Small Rum. Res., 52: 155-160. https://doi.org/10.1016/S0921-4488(03)00251-7
Breiman, L., Friedman, J., Olshen, R. and Stone, C.J., 1984. Classification and regression trees. Chapman and Hall/CRC.
Celik, S., Eyduran, E., Karadas, K. and Tariq, M.M., 2017. Comparison of predictive performance of data mining algorithms in predicting body weight in Mengali rams of Pakistan. R. Bras. Zootec., 46: 863-872. https://doi.org/10.1590/s1806-92902017001100005
Eyduran, E., 2016. The possibility of using data mining algorithms in prediction of live body weights of small ruminants. Advan. Cal. Anal., 1: 18-21.
Eyduran, E., Akkus, O., Kara, M.K., Tırınk, C. and Tariq, M.M., 2017. Use of multivariate adaptive regression splines (Mars) in predicting body weight from body measurements in Mengali rams. ICAFOF, Cappadocia Turkey, pp. 415.
Friedman, J.H., 1991. Multivariate adaptive regression splines. Annls Stat., 19: 1-141. https://doi.org/10.1214/aos/1176347973
Gündoğan, M., Uçar, M. and Tekerli, M., 2002. Investigations on morphometric measurements and spermatological properties of testes in rats grown in Afyon City conditions. Vet. Sci., 18: 63-67.
Hastie, T., Tibshirani, R. and Friedman, J.H., 2001. The elements of statistical learning: Data mining, inference and prediction. Springer Series in Statistics. Springer-Verlag, New York. https://doi.org/10.1007/978-0-387-21606-5
Herold, N.D., Koeln, G. and Cunnigham, D., 2003. Mapping impervious surfaces and forest canopy using classification and regression tree (CART) analysis. In the American Society for Photogrammetry and Remote Sensing. Anchorage. Alaska.
Karakus, K., Eyduran, E., Aygun, T. and Javed, K., 2010. Appropriate growth model describing some testicular characteristics in Norduz male lambs. J. Anim. Pl. Sci., 20: 1-4.
Khan, M.A., Tariq, M.M., Eyduran, E., Tatlıyer, A., Rafeeq, M., Abbas, F., Rashid, N., Awan, M.A. and Javed, K., 2014. Estimating body weight from several body measurements in Harnai sheep without multicolinearity problem. J. Anim. Pl. Sci., 24: 120-126.
Kornacki, J. and Ćwik, J., 2005. Statistical learning systems. Wydawnictwa Naukowo-Techniczne, Poland. pp. 90-95.
Kass, G.V., 1980. An exploratory technique for investigating large quantities of categorical data. Appl. Stat., 29: 119–127. https://doi.org/10.2307/2986296
Liddle, A.R., 2007. Information criteria for astrophysical model selection. Monthly Notices of the Royal Astronomical Society, Letters, 377: L74-L78. https://doi.org/10.1111/j.1745-3933.2007.00306.x
Loaiza-Echeverri, A.M., Bergman, J.A.G., Toral, F.L.B., Osorio, J.P., Carmo, A.S., Mendonça, L.F., Moustacas, V.S. and Henry, M., 2013. Use of nonlinear models for describing scrotal circumference growth in Guzerat bulls raised under grazing conditions. Theriogenology, 79: 751–759. https://doi.org/10.1016/j.theriogenology.2012.11.031
Magidson, J., 1993. The use of the new ordinal algorithm in CHAID to target profitable segments. J. Database Mark., 1: 29–48.
Milczewski, V., Ehlers, S.C., Spercoski, K.M., Morais, R.N. and Soccol, V.T., 2015. Quantifying the effect of seasonality on testicular function ofSuffolk ram in lower latitude. Small Rum. Res., 124: 68–75. https://doi.org/10.1016/j.smallrumres.2014.12.012
Maroco, J., Silva, D., Rodrigues, A., Guerreiro, M., Santana, I. and de Mendon, A., 2011. Data mining methods in the prediction of dementia, a real-data comparison of the accuracy, sensitivity and specificity of linear discriminant analysis, logistic regression, neural networks, support vector machines, classification trees and random forests. BMC Res. Notes, 4: 1–14. https://doi.org/10.1186/1756-0500-4-299
Olfaz, M., Tirink, C. and Önder, H., 2018. Use of CART and CHAID algorithms in Karayaka sheep breeding. Kafkas Univ. Vet. Fak. Derg., 25: 105-110.
Quirino, C.R., Bergmann, J.A.G., Vale Filho, V.R., Andrade, V.J. and Pereira, J.C.C., 1999. Evaluation of four mathematical functions to describe scrotal circumference maturation in Nellora bulls. Theriogenology, 52: 25-34. https://doi.org/10.1016/S0093-691X(99)00107-7
Salhab, S.A., Zarkawi, M., Wardeh, M.F., Al-Masri, M.R. and Kassem, R., 2001. Development of testicular dimensions and size, and their relationship to age, body weight and parental size in growing Awassi Ram Lambs. Small Rum. Res., 40: 187-191. https://doi.org/10.1016/S0921-4488(00)00224-8
Santana, M.L., Eler, J.P., Bignardi, A.B. and Ferraz, J.B.S, 2015. Two-trait random regression model to estimate the genetic association of scrotal circumference with female reproductive performance in Nelore cattle. Theriogenology, 83: 1534–1540. https://doi.org/10.1016/j.theriogenology.2015.02.003
Sarı, M., Onk, K. and Aksoy, A.R., 2013. Testicular measurements and their relation with live weight and age in Tuj lambs. MAKU J. Inst. Hlth. Sci., 1: 64-74.
Steinberg, D., Bernard, B., Phillip, C. and Kerry, M., 1999. MARS User Guide, Salford Systems, San Diego, CA.
Willmott, C. and Matsuura, K., 2005. Advantages of the mean absolute error (MAE) over the root mean square error (RMSE) in assessing average model performance. Climate Res., 30: 79–82. https://doi.org/10.3354/cr030079
Yakubu, A., 2012. Application of regression tree methodology in predicting the body weight of Uda sheep. Scientific papers. Anim. Sci. Biotechnol., 45: 484-490.
Yanli, Z., Hua, Y., Le, H., Fengzhe, L., Tingting, Z., Jing, P., Xu, F., Caifang, R., Shengyong, M. and Feng, W., 2017. Long noncoding RNA expression profile changes Assoc. Dietary Energy in The Sheep Testis During Sexual Maturation. Scient. Reports, 7: 5180. https://doi.org/10.1038/s41598-017-05443-5
Yılmaz, A. and Aygün, T., 2002. Some testicular properties of Norduz male lambs. YYU J. Agric. Sci., 12: 21-26.
To share on other social networks, click on any share button. What are these?


