
Assessment of Genetic Variability in F4 Populations of Upland Cotton (Gossypium hirsutum L.)


Research Article
Assessment of Genetic Variability in F4 Populations of Upland Cotton (Gossypium hirsutum L.)
Tanweer Fatah Abro1, Asif Ali Kaloi1, Jay Kumar Sootaher1*, Piar Ali Shar1, Tarique Ahmed Baloch2, Tanveer Ali Soomro1, Muhammad Saleem Chang3, Kirshan Kumar Menghwar1 and Waqar Hussain Shah4
1Department of Plant Breeding and Genetics, Sindh Agriculture University, Tandojam, Sindh, Pakistan; 2Directorate of Agriculture Research (Dates), Kech, Turbat, Balochistan, Pakistan; 3Department of Agronomy, Subcampus Umerkot, Sindh Agriculture University, Tandojam, Sindh, Pakistan; 4Department of Soil Science, Sindh Agriculture University, Tandojam, Sindh, Pakistan.
Abstract | The current investigations were carried out during 2016-2017 to determine genetic variability, heritability, and genetic gain in nine F4 segregating populations for morphological, yield and fiber quality related traits in upland cotton. Significant differences were observed among genotypes, parents, F4 populations and parents x F4 populations for all the studied attributes which articulated greater genetic variation in the breeding material. Heritability estimates were moderate to high for all the traits. The F4 population CRIS-134 x FH-113 displayed the highest heritability estimates for plant height (95.24%). The maximum heritability for sympodial branches plant-1 (85.30%) and seed index (82.02%) were exhibited by the F4 population CRIS-342 x IR-3701. The F4 population CRIS-342 x Neelum-121 manifested the highest heritability values for bolls plant-1 (90.81%) and boll weight (96.85%). For seed cotton yield plant-1 and ginning outturn, the highest heritability values (90.08 and 90.20%) were confirmed by the F4 population CRIS-342 x MNH-886. For staple length, the promising heritability was discovered in the F4 population CRIS-134 x Neelum-121 (85.45%). Genetic gain values were low to high for all traits. Results suggested that above F4 populations indicated their potential for various yield and fiber traits through heritability coupled with genetic gain to be used in future breeding programs for improving seed cotton yield and fiber quality traits in upland cotton.
Received | August 22, 2020; Accepted | March 29, 2021; Published | June 18, 2021
*Correspondence | Jay Kumar Sootaher, Department of Plant Breeding and Genetics, Sindh Agriculture University, Tandojam, Sindh, Pakistan; Email: jaykumar3030@gmail.com
Citation | Abro, T.F., A.A. Kaloi, J.K. Sootaher, P.A. Shar, T.A. Baloch, T.A. Soomro, M.S. Chang, K.K. Menghwar and W.H. Shah. 2021. Assessment of genetic variability in F4 populations of upland cotton (Gossypium hirsutum L.). Sarhad Journal of Agriculture, 37(3): 722-734.
DOI | https://dx.doi.org/10.17582/journal.sja/2021.37.3.722.734
Keywords | Genetic variability, Heritability, Genetic advance, F4 Populations, Upland cotton.
Introduction
Pakistan is the 4th largest cotton producing and 3rd cotton consuming country, however, the yield is low as compared other cotton producing countries (Nazir et al., 2020). The main reason of low yielding potential of existing germplasm is influence of biotic and abiotic factors and cotton production can be manage by introduction of new cotton varieties. Pakistan is leading in exporting cotton yarn and third in the export of raw material of the cotton crop worldwide (Nizamani et al., 2017). The nation of Pakistan largely depends on cotton industries with relation to textile sector. This fiber crop is on the top in the list of cash fiber crops in Pakistan, because of sustaining millions of human beings in a wide range of sectors of cotton by-products (Khan et al., 2015). The crop is considered as is the corner stone in textile industry and known as white gold in whole globe (Hampannavar et al., 2020). Approximately, 30 to 40% of the cotton is used in our homeland for domestic consumption and the rest if exported in the form of raw material, yarn, and cloth. The cotton contributes 1% in GDP and 5.2% in agriculture in our homeland. The crop is also cultivated throughout the planet. This crop is especially subjected to cultivation for its most important economic constituent, fiber, because it is the one and only component of cotton which is completely able to uplift the economy of a country through its dynamic role (Shah et al., 2017). In the production of global fiber, upland cotton takes the first position by 90% (Chen et al., 2007). The crop, upland cotton which is also termed as white gold due to its significant contribution to the national economy by providing raw materials to the local textile industries and as an export item. The crop is very valuable for world cloth owing to its durability, easy wash and cheapness. Edible oil and protein content are also found a lot in the crop seed. Chemical industries also are dependent on its raw materials (Sahito et al., 2015).
To know hereditary fluctuation in a group of plants of the same species is of incredible importance to clarify the most fitting breeding strategies for the improvement of various parameters (Chandnani et al., 2017; Hinze et al., 2017; Sun et al., 2017). The expanding pattern in the production has been contained with constant endeavors of plant reproducer, even more endeavors are needed for expanded and maintainable cotton production. In breeding population, the presence of enough magnitude of genetic variability is more effective criterion for selection. Therefore, it is necessary to understand the presence of variability in a population to adopt the most appropriate breeding technique for the improvement of various attributes in cotton. Gene action plays a very important in heritability role for the regulation of a desirable character (Tiwari et al., 2019). Before initiating any cotton improvement program for the enhancement of yield, heritability, hereditary patten and degrees of association between character must be understood better and much more for polygenic character (Ahmad et al., 2008; Makhdoom et al., 2010; Tabasum et al., 2012). There is a direct relationship between heritability and response to selection, which is said to be genetic progress and the expected response to the selection is known as genetic advance (Sootaher et al., 2020). Resultant effect of selection is not only provided by heritability alone, but also by genetic advance as a supporter (Ramanjinappa et al., 2011; Mishra et al., 2015).
The investigation of hereditary variety in breeding material is of significant premium to plant breeders and supportive in accomplishing better yield per unit area in any crop plant (Sootaher et al., 2020). To create new genetic complexes, it is very necessary that genetic variability should be available in cultivated and wild germplasm to achieve more yield, fibre, improved fiber quality and tolerance against abiotic and biotic stresses in the surroundings (Sanghera et al., 2014). Besides, it is additionally extremely difficult to isolate the heritable and non-heritable differences making trouble in choice for breeders. Consequently, it is fundamental for the plant breeders to group hereditary bit from the natural one to anticipate a proper breeding project (Amanu et al., 2020). Thus, yield increase has been very much essential to maintain global food security. Therefore, this investigation of cotton genotypes was undertaken to find out good yield contributing traits for genetic variability and heritability so that superior cross combinations can be selected for the development of new cultivars with desirable attributes in the upcoming breeding programmes.
Materials and Methods
This research was carried out on Botanical Garden, Department of PBG, SAU, Tandojam in 2016-2017 for the estimation of heritability in cotton for seed yield and fiber quality attributes. For this purpose, seven parental lines such as CRIS-134, CRIS-342, Neelum-121, CIM-598, MNH-886, FH-113 and IR-3701 along with their nine F4 populations i.e., CRIS-134 x Neelum-121, CRIS-134 x CIM-598, CRIS-134 x IR-3701, CRIS-134 x MNH-886, CRIS-134 x FH-113, CRIS-342 x Neelum-121, CRIS-342 x IR-3701, CRIS-342 x MNH-886 and CRIS-342 x FH-113 were studied for different yield and its linked attributes based on three times repetition of treatments for replications in RCBD.
Crop husbandry
The field was made ready with the application of two plows before surface levelling. Weedicides and cultural tasks were used to free the crop from adverse factors. Seeds were planted through drilling sowing method in April, 2016. Urea and DAP were sprinkled to fulfil the needs of N and P at different stages of crop development during five irrigations. The crop was reaped during the months of September and October for the first and second picking in 2017.
Statistical analysis
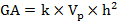
ANOVA was found out as suggested by Gomez and Gomez (1984). Least significant difference (LSD) was calculated for the comparison of mean performance to test level of significance between performances of genotypes developed by Steel and Torrie (1980). Heritability estimates were determined according to Falconer (1989) and genetic advance was applied by Johnson et al. (1955).
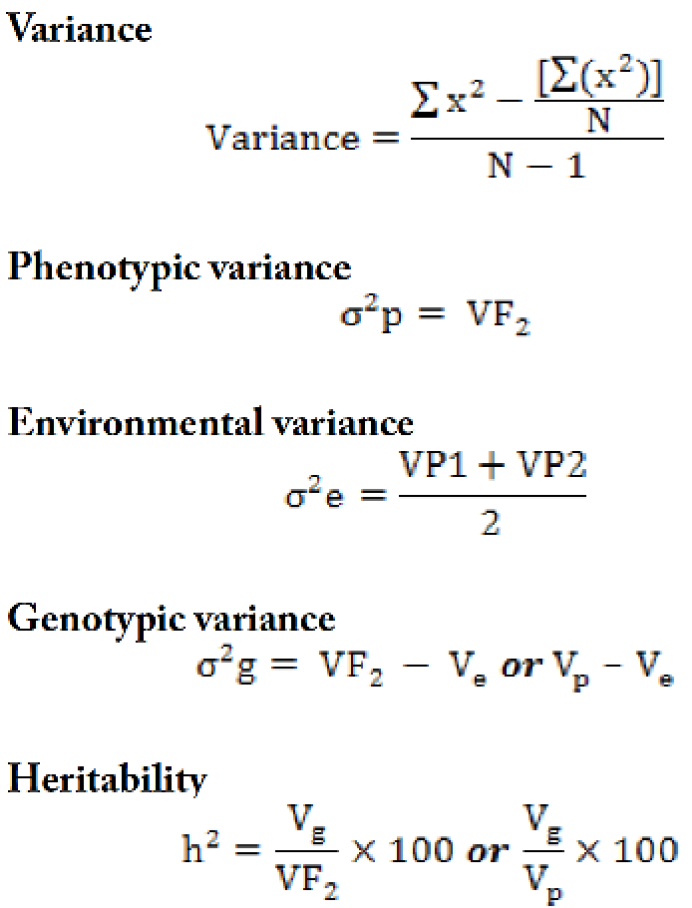
Genetic advance
Results and Discussion
Analysis of variance
The analysis of variance was carried out for eight morphological, yield and fiber quality traits recorded from seven parental lines and their nine F4 populations of upland cotton (Table 1). Results indicated that all the cotton genotypes including parents, crosses and their interaction were highly significant for all the traits. Thus, indicating that sufficient amount of genetic variability is present in parents and their F4 population. Our results are in agreement with various previous researchers such as Nawaz et al. (2019) also indicated significant variation present among the accessions of the upland cotton for all the traits except ginning outturn and staple length suggesting that genes played an important role in the expression of significant results. Highly significant results expressing greater amount of genetic variability for all the characters were also expressed by Kaleri et al. (2016) and Khan et al. (2017). Similarly, significant genetic variability among cotton germplasm for all the traits was also presented by Shah et al. (2018) and Gnanasekaran et al. (2018) in upland cotton indicating greater diversity among the genotypes.
Mean performance
Morphological, yield and fiber quality traits are imperative measures which make a decision for the sustainability of the variety or hybrid for the goal of a marketable cultivation (Anjani et al., 2020). Plant stature is a significant trademark which empowers the yield plant to contend explicitly with weeds and for the most part with different nuisances for light in capture attempt and photosynthetic exercises.
Table 1: Mean squares for different morphological traits of upland cotton genotypes.
|
SOV |
d.f. |
Plant height (cm) |
Sympodial branches plant-1 |
Bolls plant-1 |
Boll weight (g) |
Seed cotton yield plant-1 (g) |
Seed index (g) |
Ginning outturn (%) |
Staple length (mm) |
|
Replications |
2 |
4.662 |
0.180 |
15.810 |
0.012 |
229.330 |
0.254 |
19.453 |
0.055 |
|
Genotypes |
15 |
46.972** |
12.065** |
38.747** |
0.778** |
35.177** |
1.279** |
18.036** |
6.097** |
|
Parents |
6 |
3.963** |
0.967** |
1.434** |
0.060* |
19.409** |
0.052* |
1.505** |
1.189** |
|
F4 populations |
8 |
0.456** |
1.764** |
7.750** |
0.044* |
54.469** |
0.075* |
10.213** |
0.583* |
|
P x F4 P |
1 |
679.427** |
174.203** |
510.601** |
11.303** |
83.453** |
18.778** |
179.813** |
79.658** |
|
Error |
30 |
0.315 |
0.219 |
0.734 |
0.033 |
9.120 |
0.047 |
0.838 |
0.430 |
|
Total |
62 |
- |
- |
- |
- |
- |
- |
- |
- |
**, highly significant at P<0.01; *, significant at P<0.05.
Table 2: Mean performance of upland cotton parents and F4 populations for various traits.
|
Genotypes |
Plant height (cm) |
Sympodial branches plant-1 |
Bolls plant-1 |
Boll weight (g) |
Seed cotton yield plant-1 (g) |
Seed index (g) |
GOT (%) |
Staple length (mm) |
|
Parents |
||||||||
|
CRIS-134 |
105.62 |
19.14 |
40.88 |
3.46 |
115.49 |
6.66 |
35.85 |
27.57 |
|
CRIS-342 |
117.09 |
16.07 |
36.40 |
3.65 |
131.03 |
6.93 |
32.10 |
28.65 |
|
Neelum-121 |
105.65 |
18.75 |
38.99 |
3.22 |
136.99 |
6.18 |
41.84 |
26.95 |
|
CIM-598 |
109.32 |
18.94 |
33.11 |
4.28 |
112.52 |
7.06 |
36.25 |
28.25 |
|
MNH-886 |
118.22 |
17.40 |
38.88 |
3.24 |
136.84 |
6.29 |
35.40 |
27.48 |
|
FH-113 |
111.32 |
16.92 |
36.44 |
3.93 |
111.51 |
6.72 |
39.47 |
28.33 |
|
IR-3701 |
109.00 |
18.39 |
38.62 |
3.37 |
130.70 |
6.95 |
38.32 |
27.59 |
|
Mean |
110.88 |
17.74 |
37.61 |
3.59 |
125.01 |
6.68 |
37.03 |
27.83 |
|
F4 populations |
||||||||
|
CRIS-134 x Neelum-121 |
120.66 |
20.58 |
40.73 |
3.77 |
145.96 |
7.33 |
37.29 |
29.30 |
|
CRIS-134 x CIM-598 |
113.91 |
19.03 |
35.51 |
3.56 |
138.20 |
6.29 |
38.87 |
27.85 |
|
CRIS-134 x IR-3701 |
128.28 |
20.25 |
40.25 |
3.92 |
135.46 |
7.21 |
40.61 |
27.12 |
|
CRIS-134 x MNH-886 |
113.50 |
22.21 |
34.80 |
4.14 |
127.39 |
6.22 |
38.32 |
29.51 |
|
CRIS-134 x FH-113 |
121.60 |
18.92 |
39.45 |
3.94 |
129.67 |
7.18 |
36.60 |
28.86 |
|
CRIS-342 x Neelum-121 |
115.38 |
21.81 |
33.76 |
3.50 |
123.15 |
6.99 |
35.87 |
27.47 |
|
CRIS-342 x IR-3701 |
124.41 |
19.84 |
36.45 |
3.66 |
124.77 |
7.30 |
37.58 |
29.13 |
|
CRIS-342 x MNH-886 |
113.18 |
22.99 |
34.62 |
3.77 |
129.21 |
6.52 |
40.72 |
26.16 |
|
CRIS-342 x FH-113 |
123.15 |
19.58 |
33.76 |
3.29 |
115.16 |
6.39 |
34.78 |
28.28 |
|
Mean |
119.34 |
20.57 |
36.59 |
3.72 |
129.88 |
6.82 |
37.84 |
28.18 |
|
LSD at 0.05 |
18.28 |
3.47 |
8.86 |
1.12 |
31.24 |
1.26 |
10.13 |
3.17 |
The parental line MNH-886 showed maximum plant height (118.22cm). In case of F4 populations, the maximum plant height was produced by the cross CRIS-134 x IR-3701 (128.28cm) (Table 2). On the basis of average, the parents had the average values of (110.88cm) for plant height, whereas the crosses had the values of (119.34 cm) for the plant height. Sympodial branches are recognized as ripening branches on which bolls are set in cotton plant, henceforth these branches assume an essential part in intensifying seed cotton yield. The averages of both parents and progenies for sympodial branches were (17.74) and (20.57) showing the better performance of crosses than those of parents for sympodia plant-1 (Table 2).
Sympodial branches plant-1 in parents ranged from (16.17) branches in CRIS-342 to (19.14) branches in CRIS-134. Similarly, the F4 progenies CRIS-342 x MNH-886 and CRIS-134 x MNH-886 expressed the maximum branches in a single plant with the values of (22.99) and (22.21), respectively. In case of bolls plant-1, the most bolls plant-1 was presented by the parents like CRIS-134 (40.84) and Neelum-121 (38.91). On the other hand, the F4 populations CRIS-134 x Neelum-121 established the highest number of bolls plant-1 (41.73) followed by CRIS-134 x IR-3701 (40.25). But parents (37.61) averagely performed better than the progenies (36.59) for bolls plant-1 (Table 2).
Boll weight is also one of the premier traits of cotton which causes various sizes, such as large, medium and small for affecting the seed cotton yield of plants. For boll weight, F4 populations (3.72g) showed greater values of average than parents (3.59g). The maximum boll weight with bigger size was assessed in the parents CIM-598 (4.28g) and FH-113 (3.93g), while CRIS-134 x MNH-886 measured the highest boll weight of (4.14g). The seed cotton yield depends on numbers of bolls plant-1, number of seeds boll-1 and boll weight. In respect to seed cotton yield plant-1, the highest seed cotton was verified by the parental line Neelum-121 (136.96g) and F4 progenies such as CRIS-134 x Neelum-121 (145.96g) touched the maximum seed cotton yield plant-1. On an average, the values of parents (125.01g) were lesser than those of progenies (129.88g) (Table 2).
Seed index also have an effect on the cotton yield and its development. In case of seed index, both parents and their progenies gave good results with the averages of (6.68g) and (6.82g). The highest seed index (7.06 g) in parents was calculated by CIM-598, at the same time as among F4 populations, the maximum seed index was detected in F4 population CRIS-342 x Neelum-121 (7.33g). The average means of parents and F4 populations were (37.03) and (37.84) for the character ginning outturn percentage. The highest ginning outturn among the parental lines was exposed by Neelum-121 (41.84%) as compared to other parents. On the contrary among F4 populations, the cross CRIS-342 x MNH-886 was on the top as compared to the other F4 populations, which produced ginning outturn of (41.72%).
Fiber length is very useful for textile mills. With respect to staple length (mm) out of seven parents, the longest fiber length (28.65mm) was reserved by the parent CRIS-342. While from nine F4 populations, the cross CRIS-134 x MNH-886 got the maximum staple length of (29.78mm). But for the average values, F4 populations showed greater value (28.18mm) and the parents (27.83mm) for the staple length (Table 2). These results of mean performance were in agreement with Khokhar et al. (2017) for plant height. In the study of Saleem et al. (2020), fiber was of prime importance in selection procedure. Similar outcomes were also observed by Aarthi et al. (2018) and Eswari et al. (2017) for number of sympodial branches plant-1 and boll weight. Selection for high seed index and ginning outturn percentage often results in an increase in the production plant-1 and per unit area (Ahsan et al., 2015; Abbas et al., 2013). According to the results of Lokeshkumar et al. (2018) and Kumbhar et al. (2020), these results indicated that parents and progenies in the form of segregants from above mentioned can be used as useful segregating materials for selection in subsequent generations to improve all traits in upland cotton for the hybrid and varietal development program.
Heritability estimates and genetic advance in F4 populations of upland cotton
The results of heritability and genetic advance along with genetic variance, phenotypic variance, environmental variance for eight important quantitative traits showed that F4 populations demonstrated moderate to high heritability estimates (Table 3). Besides, majority of the characters were associated with more genetic advances representing the presence of an appreciable magnitude of genetic variability specially owing to additive genes in the crosses.
Plant height (cm)
Sootaher et al. (2020) suggested in his research that heritability with the values of genetic advance supports plant breeders for predicting genetic gain under selection. The results regarding plant height for heritability estimates and genetic advance showed that all F4 populations displayed greater genotypic variances than environmental variances resulting in high heritability estimates in all crosses which ranged from 72.62% to 95.24%, but the magnitude of genetic advances was observed from moderate to high in the range of 16.41 to 119.24 (Table 3). Among the nine F4 populations, CRIS-134 x FH-113 followed by CRIS-342 x IR-3701 exhibited higher heritability estimates of 95.24% and 88.05% with the highest genetic advances of 119.24 to 99.11, respectively. On the other hand, the results about genotypic variances indicated that the same cross such as CRIS-342 x IR-3701 also expressed the highest genotypic variance (57.92) informing about more genetic participation of itself. In this way, high heritability can attribute to high genetic variance and the credit of low heritability goes to more non-heritable variance for plant height. NIAB-414 x CIM-632 was found as the best combination for plant height in experiment of Abdul et al. (2020). Baloch et al. (2015) and Khokhar et al. (2017) reported high broad sense heritability and genetic advance for plant height and all yield contributing traits with high response to selection.
Sympodial branches plant-1
Heritability is of an enormous significance as it helps plant breeders in predicting the presentation of the next generation and settling on appealing decisions (Kachi et al., 2020). The result of sympodial branches per plant suggested that sufficient genetic variability was present in crosses The results of sympodial branches plant-1 for heritability estimates along with genetic advances indicated that greater genotypic variances for all F4 populations were seen than environmental variances resulting in moderate to high heritability estimates which ranged from 49.37% to 85.30%, whereas genetic advances were from low to moderate in the range of 1.51 to 13.77 (Table 3). Among the F4 progenies, CRIS-342 x IR-3701 followed by CRIS-342 x MNH-886 expressed higher heritability estimates of 85.30% and 76.16%. In case of genetic advance, the highest genetic advance was expressed by the F4 populations such as CRIS-342 x IR-3701 with the values of 13.77. On the other hand, CRIS-342 x IR-3701 exposed the most genotypic variance (6.69) telling about the most contribution genes for expressing heritability and genetic advance. This trait put itself in high heritability value because of the existence of less non-heritable variance against heritable variance. Researchers and plant breeders suggested that sympodial branches serve as a good criterion for selecting high yielding cotton varieties. Recovery of desirable lines for high heritability through selection was also suggested by Khan (2003), Kumar et al. (2017) and Kumbhar et al. (2020). Such suitable results were also found out by Anjani et al. (2020) showing the use of basic choice for the flawlessness of this character for the future breeding programs.
Table 3: Heritability estimates and genetic advance in F4 segregating populations for various traits.
|
F4 populations |
σ2e |
σ2g |
σ2p |
h2 % (b.s) |
G.A. |
|
Plant height (cm) |
|||||
|
CRIS-134 x Neelum-121 |
7.98 |
10.35 |
2.37 |
77.09 |
16.41 |
|
CRIS-134 x CIM-598 |
13.22 |
18.21 |
4.99 |
72.62 |
27.23 |
|
CRIS-134 x IR-3701 |
18.55 |
22.40 |
3.85 |
82.82 |
38.20 |
|
CRIS-134 x MNH-886 |
24.06 |
27.95 |
3.89 |
86.08 |
49.51 |
|
CRIS-134 x FH-113 |
48.14 |
50.54 |
2.40 |
95.24 |
99.11 |
|
CRIS-342 x Neelum-121 |
34.28 |
40.67 |
6.39 |
84.30 |
70.62 |
|
CRIS-342 x IR-3701 |
57.92 |
65.78 |
7.86 |
88.05 |
119.24 |
|
CRIS-342 x MNH-886 |
31.19 |
39.10 |
7.90 |
79.78 |
64.19 |
|
CRIS-342 x FH-113 |
36.18 |
42.60 |
6.42 |
84.93 |
74.50 |
|
Sympodial branches plant-1 |
|||||
|
CRIS-134 x Neelum-121 |
2.03 |
2.95 |
0.92 |
68.87 |
4.18 |
|
CRIS-134 x CIM-598 |
0.73 |
1.41 |
0.68 |
52.03 |
1.51 |
|
CRIS-134 x IR-3701 |
0.75 |
1.52 |
0.77 |
49.37 |
1.54 |
|
CRIS-134 x MNH-886 |
1.78 |
2.64 |
0.86 |
67.33 |
3.66 |
|
CRIS-134 x FH-113 |
3.45 |
4.86 |
1.40 |
71.08 |
7.10 |
|
CRIS-342 x Neelum-121 |
3.02 |
4.07 |
1.05 |
74.24 |
6.22 |
|
CRIS-342 x IR-3701 |
6.69 |
7.84 |
1.15 |
85.30 |
13.77 |
|
CRIS-342 x MNH-886 |
3.12 |
4.10 |
0.98 |
76.16 |
6.42 |
|
CRIS-342 x FH-113 |
2.88 |
4.17 |
1.29 |
69.06 |
5.92 |
|
Bolls plant-1 |
|||||
|
CRIS-134 x Neelum-121 |
16.20 |
20.41 |
4.21 |
79.35 |
33.34 |
|
CRIS-134 x CIM-598 |
6.70 |
10.89 |
4.19 |
61.50 |
13.79 |
|
CRIS-134 x IR-3701 |
4.34 |
6.31 |
1.98 |
68.70 |
8.93 |
|
CRIS-134 x MNH-886 |
2.57 |
3.64 |
1.07 |
70.55 |
5.28 |
|
CRIS-134 x FH-113 |
20.32 |
27.83 |
7.50 |
73.03 |
41.85 |
|
CRIS-342 x Neelum-121 |
11.48 |
12.64 |
1.16 |
90.81 |
23.64 |
|
CRIS-342 x IR-3701 |
4.17 |
5.41 |
1.24 |
77.11 |
8.59 |
|
CRIS-342 x MNH-886 |
5.85 |
6.92 |
1.07 |
84.53 |
12.04 |
|
CRIS-342 x FH-113 |
1.85 |
2.92 |
1.08 |
63.19 |
3.79 |
|
Boll weight (g) |
|||||
|
CRIS-134 x Neelum-121 |
1.60 |
1.97 |
0.37 |
81.08 |
3.28 |
|
CRIS-134 x CIM-598 |
0.38 |
0.84 |
0.46 |
45.13 |
0.78 |
|
CRIS-134 x IR-3701 |
0.15 |
0.24 |
0.09 |
60.88 |
0.30 |
|
CRIS-134 x MNH-886 |
0.35 |
0.69 |
0.34 |
51.07 |
0.72 |
|
CRIS-134 x FH-113 |
0.15 |
0.25 |
0.11 |
57.41 |
0.29 |
|
CRIS-342 x Neelum-121 |
3.04 |
3.14 |
0.10 |
96.85 |
6.26 |
|
CRIS-342 x IR-3701 |
0.37 |
0.43 |
0.06 |
85.29 |
0.75 |
|
CRIS-342 x MNH-886 |
0.34 |
0.41 |
0.06 |
84.36 |
0.24 |
|
CRIS-342 x FH-113 |
0.25 |
0.41 |
0.17 |
59.17 |
0.49 |
|
F4 populations |
σ2e |
σ2g |
σ2p |
h2 % (b.s) |
G.A. |
|
Seed cotton yield plant-1 (g) |
|||||
|
CRIS-134 x Neelum-121 |
29.66 |
44.73 |
15.07 |
66.30 |
61.09 |
|
CRIS-134 x CIM-598 |
198.33 |
222.00 |
23.68 |
89.34 |
408.38 |
|
CRIS-134 x IR-3701 |
57.35 |
72.60 |
15.25 |
79.00 |
118.14 |
|
CRIS-134 x MNH-886 |
75.03 |
97.55 |
22.53 |
76.91 |
154.53 |
|
CRIS-134 x FH-113 |
75.88 |
94.53 |
18.65 |
80.77 |
157.14 |
|
CRIS-342 x Neelum-121 |
20.76 |
23.50 |
2.73 |
88.37 |
42.74 |
|
CRIS-342 x IR-3701 |
149.24 |
180.01 |
30.77 |
82.91 |
307.41 |
|
CRIS-342 x MNH-886 |
22.48 |
24.96 |
2.48 |
90.08 |
46.27 |
|
CRIS-342 x FH-113 |
20.27 |
27.48 |
7.20 |
73.78 |
41.72 |
|
Seed index (g) |
|||||
|
CRIS-134 x Neelum-121 |
0.17 |
0.33 |
0.16 |
51.76 |
0.35 |
|
CRIS-134 x CIM-598 |
0.26 |
0.42 |
0.15 |
63.24 |
0.54 |
|
CRIS-134 x IR-3701 |
0.58 |
0.76 |
0.18 |
76.77 |
1.20 |
|
CRIS-134 x MNH-886 |
0.43 |
0.54 |
0.12 |
78.24 |
0.86 |
|
CRIS-134 x FH-113 |
0.56 |
0.70 |
0.14 |
80.59 |
1.16 |
|
CRIS-342 x Neelum-121 |
0.58 |
0.75 |
0.17 |
77.03 |
1.18 |
|
CRIS-342 x IR-3701 |
0.77 |
0.93 |
0.17 |
82.02 |
1.57 |
|
CRIS-342 x MNH-886 |
0.49 |
0.66 |
0.17 |
74.21 |
1.00 |
|
CRIS-342 x FH-113 |
0.30 |
0.46 |
0.16 |
65.74 |
0.62 |
|
Ginning outturn (%) |
|||||
|
CRIS-134 x Neelum-121 |
36.58 |
43.39 |
6.81 |
84.30 |
75.35 |
|
CRIS-134 x CIM-598 |
46.38 |
52.96 |
6.58 |
87.57 |
95.46 |
|
CRIS-134 x IR-3701 |
32.83 |
38.61 |
5.77 |
85.04 |
67.60 |
|
CRIS-134 x MNH-886 |
35.83 |
40.60 |
4.76 |
88.27 |
73.76 |
|
CRIS-134 x FH-113 |
38.83 |
43.98 |
5.15 |
88.29 |
79.90 |
|
CRIS-342 x Neelum-121 |
8.31 |
11.95 |
3.64 |
69.58 |
17.10 |
|
CRIS-342 x IR-3701 |
16.39 |
18.99 |
2.60 |
86.33 |
33.76 |
|
CRIS-342 x MNH-886 |
38.71 |
42.91 |
4.21 |
90.20 |
79.73 |
|
CRIS-342 x FH-113 |
12.38 |
15.69 |
3.31 |
78.90 |
25.50 |
|
Staple length (mm) |
|||||
|
CRIS-134 x Neelum-121 |
9.99 |
11.69 |
1.70 |
85.45 |
20.56 |
|
CRIS-134 x CIM-598 |
1.54 |
3.03 |
1.49 |
50.94 |
3.17 |
|
CRIS-134 x IR-3701 |
3.53 |
5.27 |
1.74 |
67.00 |
7.27 |
|
CRIS-134 x MNH-886 |
3.05 |
4.38 |
1.33 |
69.57 |
6.27 |
|
CRIS-134 x FH-113 |
3.38 |
4.70 |
1.32 |
71.91 |
6.96 |
|
CRIS-342 x Neelum-121 |
3.58 |
5.27 |
1.69 |
67.99 |
7.37 |
|
CRIS-342 x IR-3701 |
3.50 |
5.24 |
1.73 |
66.91 |
7.22 |
|
CRIS-342 x MNH-886 |
6.08 |
8.12 |
2.05 |
74.79 |
12.49 |
|
CRIS-342 x FH-113 |
1.25 |
2.55 |
1.30 |
48.88 |
2.56 |
Bolls plant-1
High heritability effects in relationship with high hereditary development can expand the odds of progress from the choice in cultivar development (Kachi et al., 2020). The results for bolls plant-1 for heritability estimates along with genetic advances indicated that genotypic variances for all F4 populations were greater than environmental variances which resulted in high heritability estimates with the range of 61.50% to 90.81%, whereas genetic advances were from moderate to high in the range of 13.79 to 41.85. In F4 populations, CRIS-342 x Neelum-121 followed by CRIS-342 x MNH-886 articulated higher heritability estimates of 90.81% and 84.53% (Table 3). In case of genetic advance, the highest genetic advance was demonstrated by the progenies such as CRIS-134 x FH-113 with the values of 41.85. On the other hand, CRIS-134 x FH-113 gained the most genotypic variance (20.32) telling about the most performance of genes for expressing heritability and genetic advance. This achievement was possible because of lower environmental variance than genetic variance. As it was observing that genetic effects were greater on bolls per plant than environmental effects. Number of bolls palnt-1 is measured as fundamental commercially character in cotton crop. Khan et al. (2017) also got higher genetic variance than environmental variance for all the traits including bolls plant-1. Jarwar et al. (2018) also got the same results for this trait in heritability and genetic advance. Bhatti et al. (2020) demonstrated not only high heritability estimates, but also high genetic gain for bolls plant-1 describing the reason of effective selection on phenotypic basis.
Boll weight (g)
The results for bolls weight for heritability estimates along with genetic advances indicated that genotypic variances for all F4 progenies were greater than environmental variances which resulted in moderate to high heritability estimates with the range of 45.13% to 96.85%, whereas genetic advances were only low in the segregation of 0.24 to 6.26 (Table 3). But in one progeny, the environmental variance was greater than genotypic variance and that was CRIS-134 x IR-3701. In F4 populations, CRIS-342 x Neelum-121 followed by CRIS-342 x IR-3701 disclosed higher heritability estimates of 96.85% and 85.29%. For genetic advance, the highest genetic advance was manifested by the F4 populations like CRIS-342 x Neelum-121 (6.26). The results about genotypic variances indicated that CRIS-342 x Neelum-121 achieved the highest genotypic variance (3.04) notifying about more role of genes for expressing heritability and genetic advance for the character boll weight. More values of genetic variance than non-heritable variance could only be the reason for presenting high heritability for bolls per plant which resulting in ample amount of genetic variability in the crosses of upland cotton genotypes. Boll weight plays an essential role in increasing seed cotton yield plant-1 because as the boll weight increases, the yield may also increase. These results were in conformity with Muhammad et al. (2017) and Farooq et al. (2018). Saleem et al. (2020) conducted an experiment in cotton genotypes for the estimation of the genetics and inheritance of quantitative attributes using multiple segregating population in which he suggested that segregating populations gave more genetic insight into quantitative characteristics such as bolls plant-1, boll size and boll weight.
Seed cotton yield plant-1 (g)
Due to more drastic need of more cotton production, it has been fundamental to create cotton genotypes having high return potential and fiber characteristics (Nazir et al., 2020). The results for seed cotton yield plant-1 for heritability estimates along with genetic advances indicated that genotypic variances for all F4 populations were greater than environmental variances which caused high heritability estimates in the variation of 66.30% to 90.08%, whereas genetic advances were also high in the segregation of 42.74 to 408.38 (Table 3). Out of nine F4 populations, CRIS-342 x MNH-886 followed by CRIS-134 x CIM-598 disclosed higher heritability estimates of 90.08% and 89.34%. The most genetic advance was manifested by the progenies like CRIS-134 x CIM-598 with the estimates of 408.38 and the same cross CRIS-134 x CIM-598 also sustained the highest genotypic variance (198.33) notifying about more input of genes for expressing heritability and genetic advance. High estimates signified that environmental effects on seed cotton yield were in small quantity than genetic variance. Yield is the most vital discontinuously varying attribute factors (Wang et al., 2012; Zeng et al., 2017; Zhang et al., 2017; Laghari et al., 2020). Such investigations for yield of cotton were also made in the experiment of Naveed et al. (2004). Kaleri et al. (2016) revealed that the differences noticed were for seed cotton yield principally under hereditary control and was less influenced by natural components, alluding to the impact of equally contributing genes for seed cotton yield plant-1. The explanation of high heritability and genetic advance in seed cotton yield was a direct result of the presence of additive genes as tested by Hampannavar et al. (2020).
Seed index
Incorporation of more different parents in hybridization programs upgrades the opportunity of getting an incredible deviation to give an expansive range of inconstancy in isolating progenies (Menghwar et al., 2019). The results about seed index for heritability estimates along with genetic advances indicated that genotypic variances for all F4 populations were greater than environmental variances which brought about moderate to high heritability estimates with assortment of 51.76% to 82.02%, whereas genetic advances were very low in the segregation of 0.35 to 1.57 (Table 3). From nine F4 progenies, CRIS-342 x IR-3701 followed by CRIS-134 x FH-113 recorded the highest heritability with the estimates of 82.02% and 80.59%. The highest genetic advance was observed in the F4 population named CRIS-134 x Neelum-121 with the estimates of 1.57 and the results about genotypic variances indicated that CRIS-342 x IR-3701 acquired the highest genotypic variance (0.77) notifying about more influence of genes for showing heritability and genetic advance in favour of seed index. Seed index is another important yield parameter in cotton crop. Raza et al. (2016) also found the same results in favour of seed index. Nawaz et al. (2019) found the maximum heritability in seed index. Low to high heritabilities for all the traits were also confirmed by Yar et al. (2020).
Ginning outturn (%)
Cotton is celebrated for fiber extraction and is under cultivation in tropical and subtropical zones of the Earth inferable from having scorching climate (Abdul et al., 2020). The results according to ginning outturn for heritability estimates along with genetic advances indicated that genotypic variances for all the nine F4 populations were greater than environmental variances bringing about high heritability estimates with fluctuation of 69.58% to 90.20%, whereas genetic advances were moderated to high in the assortment of 16.10 to 95.46 (Table 3). From nine F4 populations, CRIS-342 x MNH-886 followed by CRIS-134 x FH-113 maintained the highest heritability (90.20% and 88.29%). At the same time as, the highest genetic advance and genotypic variance was detected in the similar progeny so-called CRIS-134 x CIM-598 with the estimates of 95.46 and 46.38 reporting about more contribution of genes for screening heritability and genetic advance. Ginning outturn is a complex trait which is controlled by polygenes. Lint weight has a direct influence on the ginning outturn. Mishra et al. (2015) and Komala et al. (2018) revealed that an extensive selection for betterment of segregating populations for such attributes could be guided by moderate as well as high heritabilities to make some good change in the hybridization programmes. Lingling et al. (2020) who additionally noticed the best outcomes in cotton for this characteristic saying that hereditary improvement in fiber quality is one of the principle challenges for cotton creators.
Staple length (mm)
Heritability is constantly given from guardians to successors and assumes a significant part in plant breeding because of the way that it educates how much a phenotypic quality is contributed by genetic factors in a population (Kumbhar et al., 2020). The results concerning staple length or heritability estimates and genetic advances showed that genotypic variances for eight F4 populations were greater than environmental variances and for one cross environmental variance was greater than genotypic variance which brought about moderate to high heritability estimates with assortment of 48.88% to 85.45%, whereas genetic advances were low to high in the separation of 2.56 to 20.56 (Table 3). From nine F4 populations, CRIS-134 x Neelum-121 followed by CRIS-342 x MNH-886 verified the highest heritability with the estimates of 85.45% and 74.79%. The maximum genetic advance and genotypic variance were observed in the same progeny called CRIS-134 x Neelum-121 with the estimates of 20.56 and 9.99 advising about more involvement of genes for presenting heritability and genetic advance in favour of staple length. It had been recommended by Nazir et al. (2020) that fiber quality of developed countries is higher than Pakistan. So, the improvement of fiber quality is an economic goal of a plant breeder. Tabasum et al. (2012) and Pandiyan et al. (2019) performed an investigation with fifty-three genotypes of upland cotton to get information on heritability and genetic advance for fibre attributes. High heritability with moderate genetic advance for staple length were observed in his experiment due to non-additive gene action.
Conclusions and Recommendations
It has been concluded that the genotypes including parents and F4 populations differed highly significantly for all attributes. Heritabilities values were noticed moderate to high for all the traits, whereas genetic variances were observed low, moderate and high which indicated the regulation of all the traits under non-additive gene action. Such values of heritability for these tested characters showed that the genetic variability was mostly in charge of genes and hardly under surroundings being caused by presence of additive genes. In this way, the application of direct phenotypic selection can be utilized to improve these characteristics. Thus, these populations are effective for exploring in further segregating generations to improve yield and fibre quality characteristics of cotton genotypes.
Acknowledgments
This study was financially supported by Botanical Garden, Department of Plant Breeding and Genetics, Sindh Agriculture University, Tandojam. We are extremely grateful to them.
Novelty Statement
Cotton in Pakistan is one of the most important cash crops and ranks first in fiber crops. Its yield and fiber contributing characteristics can never neglected in the scientific research. This research work has been very helpful in search of superior genotypes having a large amount of ge-netic variability in yield and fiber attributes which can be utilized in future breeding programs for improving seed cotton yield and fiber quality traits in upland cotton.
Author’s Contribution
TFA and AAK conducted the experiment and collected the data with TAS, KKM, MSC and WHS. TFA designed and supervised the research. JKS, PAS and TAB analyzed the data. TFA and JKS wrote the manuscript.
Conflict of interest
The authors declare no conflict of interest.
References
Aarthi, V., P. Amalabalu and N. Premelatha. 2018. Genetic variability studies in germplasm of upland cotton (G. hirsutum L.). Elect. J. Plant Breed., 9: 1600-1605. https://doi.org/10.5958/0975-928X.2018.00200.4
Abbas, H.G., A. Mahmood and Q. Ali. 2013. Genetic variability, genetic advance and correlation studies in cotton (G. hirsutum L.). Int. J. Mol. Biol., 4: 156-161.
Abdul, R., M. Nida, D. Xiongming, and A.M. Tehseen. 2020. Heritability and correlation analysis of morphological and yield traits in genetically modified cotton. J. Cotton Res., 3: 23. https://doi.org/10.1186/s42397-020-00067-z
Ahmad, W., N.U. Khan, M.R. Khalil, A. Parveen, U. Aiman, M. Saeed, Samiullah and S.A. Shah. 2008. Genetic variability and correlation analysis in upland cotton. Sarhad J. Agric., 24: 195-201.
Ahsan, M.Z., M.S. Majidano, H. Bhutto, A.W. Soomro, F.H. Panhwar, A.R. Channa and K.B. Sial. 2015. Genetic variability, coefficient of variance, heritability and genetic advance of some cotton (G. hirsutum L.) accessions. J. Agric. Sci., 7: 147-156. https://doi.org/10.5539/jas.v7n2p147
Amanu, A.W., H. Mohammed and B. Amsalu. 2020. Genetic variability and heritability studies of seed cotton yield and fiber quality in F5 segregating generation of upland cotton (G. hirsutum L.) in Ethiopia. African J. Plant Breed., 7: 1-11.
Anjani, A., V. Padma, J.V. Ramana and Y. Satish. 2020. Evaluation of genetic parameters of agro-morpho-quality traits in American cotton (G. hirsutum L.). Elect. J. Plant Breed., 11: 279-282. https://doi.org/10.37992/2020.1101.048
Baloch, A., M.W. Baloch, M.K. Baloch, I.A. Mallano, A.M. Baloch, N.J. Baloch and S. Abro. 2015. Association and heritability analysis for yield and fiber traits in promising genotypes of cotton (G. hirsutum L.). Sindh Univ. Res. J., 47: 303-306.
Bhatti, M.H., M.I. Yousaf, A. Ghani, M. Arshad, A. Shehzad, A. Mumtaz, M.U. Khalid, M.Z. Khalid, M.Z. Mushtaq and S.A.S. Shah. 2020. Assessment of genetic variability and traits association in upland cotton (G. hirsutum L.). Int. J. Bot. Stud., 5: 148-151.
Chandnani, R., Z. Zhang, J.D. Patel, J. Adhikari, S. Khanal, D. He, N. Brown, P.W. Chee and A.H. Paterson. 2017. Comparative genetic variation of fiber quality traits in reciprocal advanced backcross populations. Euphytica, 21: 241-245. https://doi.org/10.1007/s10681-017-2029-7
Chen, Z.J., B.E. Scheffler, E. Dennis, B.A. Triplett, T. Zhang, W. Guo, X. Chen, D.M. Stelly, P.D. Rabinowicz, C.D. Town, T. Arioli, C. Brubaker, R.G. Cantrell, J.M. Lacape, M. Ulloa, P. Chee, A.R. Gingle, C.H. Haigler, R. Percy, S. Saha, T. Wilkinns, R.J. Wright, D.A. Van, Y. Zhu, J.Z. Yu, R.J. Kohel, J.F. Wendel and A.H. Paterson. 2007. Towards sequencing cotton (Gossypium) genomes. Plant Physiol., 145: 1303-1310. https://doi.org/10.1104/pp.107.107672
Eswari, K.B., S. Kumar, S. Gopinath and M.V.B. Rao. 2017. Genetic variability, heritability and genetic advance studies in cotton. Int. J. Dev. Res., 7: 10902-10904.
Falconer, D.S. 1989. Introduction to quantitative genetics, 3rd edition. Longman Scientific and Technical, New York, USA, pp. 187-192.
Farooq, J., M. Rizwan, S. Saleem, I. Sharif, S.M. Chohan, M. Riaz, F. Ilhai and R.A. Kainth. 2018. Determination of genetic variation for earliness, yield and fiber traits in advance lines of cotton (G. hirsutum L.). Adv. Agric. Sci., 6: 59-74.
Gnanasekaran, M., K. Thiyagu and M. Gunasekaran. 2018. Genetic variability heritability and genetic advance studies in cotton (G. hirsutum L.). Elect. J. Plant Breed., 9: 377-382. https://doi.org/10.5958/0975-928X.2018.00043.1
Gomez, K.A. and A.A. Gomez. 1984. Statistical procedures for agricultural research, 2nd ed. John Wiley & Sons Inc., New York, U.S.A., pp. 680.
Hampannavar, M.R., B.R. Patil, I.S. Katageri, B.N.A Kumar and B.S. Janagoudar. 2020. Genetic variability and correlation analysis for agronomic and fibre quality traits in intra-specific cotton (G. hirsutum × G. hirsutum) recombinant inbred lines (RILs). Int. J. Curr. Microbiol. Appl. Sci., 9: 493-503. https://doi.org/10.20546/ijcmas.2020.901.054
Hinze, L.L., A.M. Hulse-Kemp, I.W. Wilson, Q.H. Zhu, D.J. Llewellyn, J.M. Taylor, A. Spriggs, D.D. Fang, M. Ulloa, J.J. Burke, M. Giband, J.M. Lacape, A.V. Deynze, J.A. Udall, J.A. Scheffler, S. Hague, J.F. Wendel, A.E. Pepper, J. Frelichowski, C.T. Lawley, D.C. Jones, R.G. Percy and D.M. Stelly. 2017. Diversity analysis of cotton (G. hirsutum L.) germplasm using the Cotton. BMC Plant Biol., 17: 37-44. https://doi.org/10.1186/s12870-017-0981-y
Jarwar, A.H., X. Wang, L. Wang, Q. Ma and S. Fan. 2018. Genetic advancement, variability and heritability in upland cotton (G. hirsutum L.). J. Environ. Agric. Sci., 16: 24-31.
Johnson, H.W., H.F. Robinson. and R.E. Comstock. 1955. Estimates of genetic and environmental variability in soybeans. Agron. J., 47: 314-308. https://doi.org/10.2134/agronj1955.00021962004700070009x
Kachi, M., T.F. Abro, J.K. Sootaher, T.A. Baloch, M.A. Mastoi, T.A. Soomro, K.K. Menghwar, G.M. Jadgal, M.S. Chang and W.H. Shah. 2020. Estimation of heritability and genetic advance in F2 populations of bread wheat (T. aestivum L.) genotypes. Int. J. Biosci., 16: 286-295.
Kaleri, A.A., A.W. Baloch, M. Baloch, N.A. Wahocho, T.F. Abro, Q. Jogi, A.A. Soomro, A. Marri and L.A. Bhutto. 2016. Heritability and correlation analysis in Bt and non-Bt cotton (G. hirsutum. L.) genotypes. Pure Appl. Biol., 5: 906-912. https://doi.org/10.19045/bspab.2016.50114
Khan, N.U. 2003. Genetic analysis, combining ability and heterotic studies for yield, its components, fibre and oil quality traits in upland cotton (G. hirsutum L.). Sindh Univ. Res. J., 4: 123-133.
Khan, N.U., G. Hassan, K.B. Marwat and S. Batool. 2017. Genetic variability and heritability in upland cotton. J. Plant Sci., 55: 121-131.
Khan, S.A., N.U. Khan, R. Gul, Z. Bibi, I.U. Khan, S. Gul, S. Ali and M. Baloch. 2015. Combining ability studies for yield and fiber traits in upland cotton. J. Anim. Plant Sci., 25: 698-707.
Khokhar, E.S., A. Shakeel, M.A. Maqbool, M.W. Anwar, Z. Tanveer and M.F. Irfan. 2017. Genetic study of cotton (G. hirsutum L.) genotypes for different agronomic, yield and quality traits. Pak. J. Agric. Res., 30: 363-372. https://doi.org/10.17582/journal.pjar/2017/30.4.363.372
Komala, M., N.M. Ganesan and M. Kumar. 2018. Genetic variability, heritability and correlation analysis in F2 populations of ratoon upland cotton hybrids. Int. J. Agric. Environ. Biotechnol., 11: 815-827. https://doi.org/10.30954/0974-1712.12.2018.2
Kumar, M. and I.S. Katageri. 2017. Genetic variability and heritability study in F2 population of cotton for yield and its components. Int. J. Curr. Microbiol. Appl. Sci., 6: 975-983. https://doi.org/10.20546/ijcmas.2017.606.114
Kumbhar, Z.M., W.A. Jatoi, J.K. Sootaher, M.I. Baloch, A.A. Gadahi, K.K. Menghwar, M.S. Chang and M. Kachi. 2020. Studies on correlation and heritability estimates in upland cotton genotypes under agro-climatic conditions of Tandojam, Sindh, Pakistan (G. hirsutum L.). Pure Appl. Biol., 9: 2272-2278. https://doi.org/10.19045/bspab.2020.90241
Laghari, K., M. Baloch, J.K. Sootaher, K.K. Menghwar, M. Kachi, Z.M. Kumbhar, W.H. Shah, M.K. Soothar and I. Daudpotto. 2020. Correlation and heritability analysis in rapeseed (Brassica napus L.) genotypes. Pure Appl. Biol., 9: 507-516. https://doi.org/10.19045/bspab.2020.90056
Lingling, M., S. Ying, N. Hushuai, C. Yupeng, C. Cheng, I. Babar and H. Jinping. 2020. QTL and genetic analysis controlling fiber quality traits using paternal backcross population in upland cotton. J. Cotton Res., 3: 22. https://doi.org/10.1186/s42397-020-00060-6
Lokeshkumar, B.M. and B.R. Patil. 2018. Estimation of genetic variability parameters in F2 population of G. hirsutum L. for yield, yield attributes and fiber quality traits. Int. J. Curr. Microbiol. Appl. Sci., 7: 360-367. https://doi.org/10.20546/ijcmas.2018.709.044
Makhdoom, K., N.U. Khan, S. Batool, Z. Bibi, Farhatullah, S. Khan, F. Mohammad, D. Hussain, Raziuddin, M. Sajjad and N. Khan. 2010. Genetic aptitude and correlation studies in upland cotton (G. hirsutum L.). Pak. J. Bot., 42: 2011-2017.
Menghwar, K.K. J.K. Soothar, T.F. Abro, T.A. Baloch, F.G. Nizamani, M.K. Soothar, W.D. Sipio and M.A. Khaskheli. 2019. Assessment of genetic diversity in different genotypes of mustard (B. juncea L.). Int. J. Biosci., 15: 297-304.
Mishra, P.K., R.B. Ram and N. Kumar. 2015. Genetic variability, heritability and genetic advance in strawberry. Turk. J. Agric., 39: 451-458. https://doi.org/10.3906/tar-1408-99
Muhammad, Z.A., S.M. Muhammad, H. Bhutto and A.W. Soomro. 2017. Genetic variability, coefficient of variance, heritability and genetic advance of some G. hirsutum accessions. J. Plant Sci., 55: 598-606.
Naveed, M., M. Azhar and A. Ali. 2004. Estimates of heritabilities and correlations among seed cotton yield and its components in G. hirsutum L. Int. J. Agric. Biol., 6: 712-714.
Nawaz, B., M. Naeem, T.A. Malik, G. Muhae-Ud-Din, Q. Ahmad and S. Sattar. 2019. Estimation of gene action, heritability and pattern of association among different yield related traits in upland cotton. Int. J. Innov. Approch. Agric. Res., 3: 25-52. https://doi.org/10.29329/ijiaar.2019.188.4
Nawaz, B., S. Sattar and T.A. Malik. 2019. Genetic analysis of yield components and fiber quality parameters in upland cotton. Int. Multidiscip. Res. J., 9: 13-19.
Nazir, I., H.Z. Mahmood and T.M khan. 2020. Genetic variations in upland cotton (G. hirsutum L.) for yield and fiber quality traits. Hort. Int. J., 4: 83-89. https://doi.org/10.15406/hij.2020.04.00163
Nizamani, F., M.J. Baloch, A.W. Baloch, M. Buriro, G.S. Nizamani, M.R. Nizamani and I.A. Baloch. 2017. Genetic distance, heritability and correlation analysis for yield and fibre quality traits in upland cotton genotypes. Pak. J. Biotechnol., 14: 29-36.
Pandiyan, J., A. Ramalingam, M.A. Pillai and S. Saravanan. 2019. Genetic parameters of economic and fibre characters in upland cotton (G. hirsutum L.). Int. J. Curr. Microbiol. Appl. Sci., 8: 2084-2090. https://doi.org/10.20546/ijcmas.2019.806.248
Ramanjinappa, V., K.H. Arunkumar, A. Hugar and M.S. Shashibhaskar. 2011. Genetic variability in okra (Abelmoschus esculentus L.). Plant Arch., 11: 435-437.
Raza, H. N. U. Khan, S.A. Khan, S. Gul, A. Latif, I. Hussain, J. Khan, S. Raza and M. Baloch. 2016. Genetic variability and correlation studies in F4 populations of upland cotton. J. Anim. Plant Sci., 26: 1048-1055.
Sahito, A., Z.A. Baloch, A. Mahar, S.A. Otho, S.A. Kalhoro, A. Ali and F. Ali. 2015. Effect of water stress on the growth and yield of cotton crop (G. hirsutum L.). J. Plant Sci., 6: 1027-1032. https://doi.org/10.4236/ajps.2015.67108
Saleem, M.A., A. Zaheer, M. Kashif, S. Ul-Allah, M. Ismael, M.W. Amjid, H. Afzal and M.F. Ateeq. 2020. Genetics and inheritance of quantitative traits using multiple segregating populations in cotton (G. hirsutum L.). Int. J. Agric. Biol., 24: 755-761.
Sanghera, G.S., S.C. Kashyap, V. Rana and G.A. Parray. 2014. Agro-morphological and genetic diversity among elite wheat genotypes grown under Kashmir conditions. Int. J. Curr. Res., 6: 7735-7740.
Shah, S.A.I., S.J. Khan, K. Ullahand and O.U. Sayal. 2018. Genetic diversity in cotton germplasm using multivariate analysis. Sarhad J. Agric., 34: 130-135. https://doi.org/10.17582/journal.sja/2018/34.1.130.135
Shah, T., Kalsoom, K. Eifediye and H.A. Khan. 2017. Yield and quality characters of cotton varieties response to different plant spacing. J. Agric. Res., 6: 113-118.
Sootaher, J.K., T.F. Abro, Z.A. Soomro, M.K. Soothar, T.A. Baloch, K.K. Menghwar, M. Kachi, M.A. Mastoi and T.A. Soomro. 2020. Assessment of genetic variability and heritability for grain yield and its associated traits in F2 populations of bread wheat (T. aestivum L.). Pure Appl. Biol., 9: 36-45. https://doi.org/10.19045/bspab.2020.90005
Steel, R.G.D. and J.H. Torrie. 1980. Principles and procedures of statistics: A biometrical approach. McGraw-Hill Book Company, New York, pp. 633.
Sun, Z., X. Wang, Z. Liu, Q. Gu, Y. Zhang, Z. Li, H. Ke, J. Yang, J. Wu, L. Wu, G. Zhang, C. Zhang and Z. Ma. 2017. Genome-wide association study discovered genetic variation and candidate genes of fibre quality traits in G. hirsutum L. Plant Biotechnol. J., 15: 982-996. https://doi.org/10.1111/pbi.12693
Tabasum, A., I. Aziz, M.J. Asghar and M.Z. Iqbal. 2012. Inheritance of seed cotton yield and related traits in cotton (G. hirsutum L.). Pak. J. Bot., 44: 2027-2031.
Tiwari, D.N., S.R. Tripathi, M.P. Tripathi, N. Khatri and B.R. Bastola. 2019. Genetic variability and correlation coefficients of major traits in early maturing rice under rainfed lowland environments of Nepal. Adv. Agric., 2019: 5975901. https://doi.org/10.1101/520338
Wang, S., K. Wu, Q. Yuan, X. Liu, Z. Liu, X. Lin, R. Zeng, H. Zhu, G. Dong, Q. Qian, and G. Zhang. 2012. Control of grain size, shape and quality by OsSPL16 in rice. Nat. Genet., 44: 950-954. https://doi.org/10.1038/ng.2327
Yar, M.M., I.M. Iqbal, A. Mehmood and M. Naeem. 2020. Estimation of heritability and genetic advance to develop drought tolerance in cotton (G. hirsutum L.). Appl. Ecol. Environ. Res., 18: 4309-4323. https://doi.org/10.15666/aeer/1803_43094323
Zeng, D., Z. Tian, Y. Rao, G. Dong, Y. Yang, L. Huang, Y. Leng, J. Xu, C. Sun, G. Zhng and J. Hu. 2017. Rational design of high-yield and superior-quality rice. Nat. Plants, 3: 17031. https://doi.org/10.1038/nplants.2017.31
Zhang, L., H. Yu, B. Ma, G. Liu, J. Wang, J. Wang, R. Gao, J. Li, J. Liu, J. Xu and Y. Zhang. 2017. A natural tandem array alleviates epigenetic repression of IPA1 and leads to superior yielding rice. Nat. Commun., 8: 14789. https://doi.org/10.1038/ncomms14789
To share on other social networks, click on any share button. What are these?


