Analysis of Genetic Variability, Heritability and Correlation among Bangladeshi Local Rice Cultivars (Oryza sativa L.)


Research Article
Analysis of Genetic Variability, Heritability and Correlation among Bangladeshi Local Rice Cultivars (Oryza sativa L.)
Md. Sabbir Ahamed1, Md. Rayhan Chowdhury1, Md. Atik Mas-ud1, Sujat Ahmed2, Md. Shahadat Hossain1 and Mohammad Nurul Matin1*
1Department of Genetic Engineering and Biotechnology, University of Rajshahi, Rajshahi-6205, Bangladesh; 2Department of Agronomy, Sher-e- Bangla Agriculture University, Dhaka 1207, Bangladesh.
Abstract | Here genetic variability, correlation coefficient and character association of yield and yield contributing traits of 13 local rice cultivars grown in Bangladesh were estimated. Results indicated that most traits including, plant height (PH), panicle length (PaL), leaf length (LL), leaf breath (LB), 100-grain weight (100-GW) as well as filled and unfilled grain per panicle (FGPa, UFGPa), and primary branch (PB) obtained significant variation in case of treatment. The genotypic variance (σ2g) obtained maximum for grain per panicle (2918.83) and the lowest value of σ2g was for primary branch (0.241). The highest magnitude of σ2p was 2991.18 for grain per panicle (GPa) and the lowest magnitude of σ2p was 0.2419 for leaf breadth. High heritability was observed in leaf breadth (96.959) followed by PH and 100-GW (96.867 and 95.767, respectively), and the lowest value was founded in the primary branch (80.689) and panicle length (81.709) which imply that it would be ineffective selection of those traits. PH (92.17%), flowering (90.16%), 100-GW (83.1%), maturity time (82.4%), PaL (79.2%) and spikelet no. (60.2%) was highly heritable variation. The highest value of genotypic covariance (GCV) and phenotypic covariance (PCV) were found in FGPa (2312.334 and 2377.728) followed by UFGPa (18.472 and 74.639) and PH (437.76 and 438.34) suggesting that selection of this corresponding trait would be more effective. Identified low value of GCV than the PCV, suggesting environment may play influencial role on their phenotypic expression. Correlation coefficient values of yield attributing traits reveals that the association among total grain per panicle (0.96**) and FGPa (0.95**) were positive and significant with yield.
Received | June 24, 2020; Accepted | March 07, 2021; Published | May 04, 2021
*Correspondence | Mohammad Nurul Matin, Department of Genetic Engineering and Biotechnology, University of Rajshahi, Rajshahi-6205, Bangladesh; Email: nmatin2@yahoo.com
Citation | Ahamed, M.S., M.R. Chowdhury, M.A. Mas-ud, S. Ahmed, M.S. Hossain and M.N. Matin. 2021. Analysis of genetic variability, heritability and correlation among Bangladeshi local rice cultivars (Oryza sativa L.). Pakistan Journal of Agricultural Research, 34(2): 356-361.
DOI | https://dx.doi.org/10.17582/journal.pjar/2021/34.2.356.361
Keywords | Genetic variability, Heritability, Correlation co-efficient, Polygenic character, Quantitative genetics
Introduction
Rice is the most consumable grain crop in Bangladesh. Due to variable soil and climatic conditions as well as consumer preference of Bangladesh, rice can be grown mainly in three different seasons namely Boro (December to April), Aus (April to July) and Aman (July to December) (Deshapriya et al., 2014). In case of rice production and consumption about 90% is dominated by Asia including Bangladesh. Most of the land of Bangladesh is used to produce rice. The increasing of the world’s population demands an additional land as well as needing additional food. To meet the increasing demand for rice, it’s important to grow a high yielding variety containing good quantitative characteristics for different ecosystem. However, grain yield is largely regulated by genetic and environmental factors as it is a polygenic character as well as defined through the extent and nature of the genetic parameters recorded by (Singh et al., 2000). For breeding program and selecting expected characters, genetic variation among agronomic characters is very significant. Heritability is a key parameter in quantitative genetics because it determines the response to select the low heritability of different agronomic traits related with yield of grains (Atlin, 2003). Therefore, understanding the relationship of diverse yield components with yield of grain is significant and the significant and non-significant association between yield contributing traits and yield has been studied thoroughly. The association of grain production with total amount of effective tillers, effective grains per productive panicle and maturity was significant and positive which was studied by Sadeghi, 2011. Ullah et al. (2011) found the positive association of panicle length with grain yield. Similar finding also noted in case of effective GPa, total GPa and grain fertility (Hairmansis et al., 2010). Correlation coefficients test measures the magnitude of reciprocal relationship between different agronomic traits and measures the interrelationship among yield and its components which are helpful for efficient selection strategy. All of the studied variable showed considerable difference obtained in the genetic components in advance rice lines developed in the background of Basmati-385 (Shah et al., 2020).
Materials and Methods
Materials and study area
Research was done at the field given by the University of Rajshahi, 6205, Bangladesh using 13 rice genotypes and randomized complete block design (RCBD) with three replications during the period from July 2018 to December 2019. Rice germplasms were collected from the germplasm bank of the Molecular Genetics Laboratory of the University of Rajshahi of Bangladesh. The soil of the field was a medium high land, clay loam in texture and having pH 5.47-5.63. Seeds were germinated in an incubator at 37oC for 3 days to begin germination and then transferred to seedling bed. Mature seedlings (25 D old) were transplanted to the research plot. As rice cultivation is greatly influenced by soil moisture status and row spacing (Ishfaq et al., 2018), we followed proper cultivation system. Fertilizers namely Urea 300 kg per hectare, Triple superphosphate (TSP) 112 kg per hectare, Gypsum 150 kg per hectare, MoP 90 kg per hectare were used as recommended. Total TSP, MoP and Gypsum were applied at final land preparation. Urea was applied in three installments, at 15, 30 and 50 days after transplanting (DAT). Data of plant height (cm), length and breadth of leaf (cm), panicle length (cm), weight of 100 grains (gm), number of filled and unfilled GPa, primary panicle branch (no.) as well as grain weight per panicle were measured with standard formula.
Statistical analysis of data
Basic biostatistical software FSTAT (version 2.9.4, 2002) was used for statistical analysis using described procedure for the estimation of Correlation co-efficient, variance, heritability, genetic advance, as well as phenotypic and genotypic coefficient of variation (PCV and GCV).
Estimation of variances
Genotypic variance (σ²g) and phenotypic variances (σ²p) were measured as Johnson et al. (1955).
σ²g = (GMS–EMS)/r, (GMS; genotypic mean square, EMS; error mean square, r; number of replication).
σ²p = σ²g + EMS.
Estimation of coefficient of variation (GCV and PCV)
GVC and PVC were estimated as Singh and Chaudhury (1985) and Burton (1952).
PCV = (σ²p ÷͞x) × 100
GCV = (σ²g ÷ ͞x) × 100
Where; ͞x= Grand mean, σ²p = Phenotypic variance, σ²g = Genotypic variance, σ²e = Error variance.
Estimation of heritability
Heritability (large) has been measured by splitting the genotypical variation into the phenotypic one, then by increasing it by 100, as Warner (1952) proposed.
h2b = (σ²g/ σ²p) × 100
Estimation of genetic advance (GA) and percentage of the mean (GA%)
GA = K (σp) (σ²g ÷ σ²p)
GA% of mean = (GA ÷ ͞x) × 100
Where, K=selection differential (2.06 at a 5% level, Lush, 1949); σp= Square root of the Phenotypic variance and ͞x=Grand mean for a particular character.
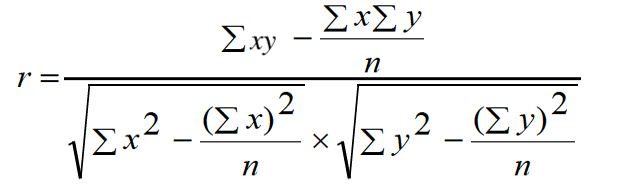
Correlation coefficients
Correlation between yield grain per panicle and other contributing characters was estimated as:
Results and Discussion
Results of variance of all of the characters of cultivars revealed existence of a considerable quantity of genetic variance among the experimental materials (Table 1). A maximum number of genetic changes owing to various agronomic characters were noticed by (Umadevi et al., 2009; Khan et al., 2009; Ullah et al., 2011; Akinwale et al., 2011). Effective genetic variance for any studied parameters is greatly necessary to develop a superior variety with direct selection based breeding approaches. The calculated value of the genetic parameters including σ2g, σ2p, GCV, PCV, GA was mentioned in Table 2.
Table 1: Analysis of variance for rice traits.
|
Serial No. |
Traits |
Replication |
Treatment |
|
1 |
PH |
0.13ns |
2271.46** |
|
2 |
LL |
9.50** |
104.31** |
|
3 |
LB |
14238.24** |
7113.73** |
|
4 |
PaL |
2.47ns |
14.40** |
|
5 |
100 GW |
4.25ns |
1286.83** |
|
6 |
GPa |
1.30ns |
122.03** |
|
7 |
FGPa |
2.44ns |
107.07** |
|
8 |
UFGP |
5.21* |
28.69** |
|
9 |
YGP |
0.32ns |
57.65** |
* Significant at 5 percent level of probability; ** Significant at 1 percent level of probability; ns: non significant; PH: Plant height (cm); LL: Leaf Length (cm); LB: Leaf breadth (cm); PaL: Panicle length (cm); 100-GW:100-Grain Weight (gm); GPa: Grains per panicle (No.); FGPa: Filled grains per panicle (No.); UFGP: Unfilled grain per panicle (No.); YGP: Grain yield (gm panicle-1).
Value of the σ2g was found for total grain per productive year (2918.83) and the minimum magnitude of σ2g was found in length of leaf breadth (0.2418). The highest value of σ2p was estimated for total grain number per productive panicle (2991.1839) and the lowest value of σ2p was estimated in length of leaf breadth (0.2419). The estimation of a large proportion of overall variance for these studied characters is caused by the presence of high genetic variation among the traits of the germplasms. Therefore, it is predicted that the selection of such studied traits would be highly successful.
The present experiment resulted the heritability as 96.867 for plant height, 92.178 for leaf length, 96.959 for leaf breadth, 81.709 for panicle length, 95.767 for 100-grain weight, 93.581 for no. of GPa, 95.249 for no. of filled GPa, 94.72 for grain weight per panicle, 90.225 for unfilled grain per panicle, and 80.689 for primary branch per panicle. The high value of heritability was found in leaf breadth (96.959) followed by plant height (96.867), and 100-grain weight (95.767). The estimates of high heritability reveal high heritable portion of component of variance which may be helpful for breeding programs selecting superior cultivars based on phenotypic results. Some studies reported the high heritability in rice for various agronomic traits (Khan et al., 2009; Kole et al., 2008; Akinwale et al., 2011; Sadeghi, 2011; Zahid et al., 2006). Another study found high heritability and genetic advance in rice which indicates selection of genes would be more reliable on the basis of these parameters (Johnson et al., 1955). In this study, higher value of both heritability and genetic advance were recorded for leaf breadth, filled and unfilled grain per panicle as well as yield of the plant.
As opposed, minimum value of heritability was coined for the primary branch (80.689) followed by panicle length (81.709). Mustafa and Elsheikh (2007) and Akinwale et al. (2011) found the same. Low heritability reveals a significant influence on environmental factor for the expression of the corresponding trait, thus the direct selection would be ineffective for primary branch per panicle and panicle length.
High value of GCV as well as PCV were found in filled grain per panicle (2312.334 and 2377.728) followed by unfilled GPa (18.472 and 74.639) and PH (437.76 and 438.34). The high GCV and PCV suggested that the selection of this corresponding trait would be more effective. In all studied traits PCV were slightly higher as compare to GCV indicating the role of environment on gene expression. Similar study was also reported by Akanda et al. (1997).
The coefficient of correlation among grain total yield
Table 2: Genetic parameter calculation in ten characters of different rice genotypes.
|
Character |
Grand mean |
σ2g |
σ2p |
σ2e |
h2b% |
GCV% |
PCV% |
GA |
GA% |
|
PH |
126.68 |
554.52 |
555.25 |
0.732 |
95.87 |
437.76 |
438.34 |
48.47 |
38.27 |
|
LL |
65.57 |
76.342 |
78.559 |
2.2169 |
92.17 |
116.375 |
119.754 |
17.74 |
27.04 |
|
LB |
0.9226 |
0.241 |
0.2419 |
0.0001 |
96.96 |
26.311 |
26.322 |
1.01 |
110.1 |
|
PaL |
22.869 |
7.041 |
8.6174 |
1.5762 |
81.71 |
30.793 |
37.686 |
4.94 |
21.60 |
|
100 GW |
18.33 |
18.901 |
18.945 |
0.0441 |
96.77 |
103.118 |
103.358 |
8.94 |
48.80 |
|
GPa |
132.86 |
2918.83 |
2991.2 |
72.348 |
93.59 |
219.921 |
2551.38 |
109.9 |
82.74 |
|
FGPa |
108.21 |
2495.93 |
2566.5 |
70.593 |
95.25 |
2312.33 |
2377.73 |
101.4 |
94.02 |
|
UFGPa |
24.92 |
129.182 |
143.18 |
13.994 |
90.23 |
18.472 |
74.639 |
22.23 |
89.25 |
|
PBPPa |
8.85 |
1.484 |
1.839 |
0.3553 |
80.68 |
16.550 |
20.511 |
2.25 |
25.13 |
|
YGPa |
12.802 |
20.653 |
21.802 |
1.093 |
94.72 |
161.32 |
169.817 |
9.126 |
71.29 |
PH: Plant height (cm); LL: Leaf Length (cm); LB: Leaf Breadth (cm); PaL: Panicle length (cm); 100GW: 100 Grain weight; GPa: Grains per Panicle (No.); FGPa: Filled grains per panicle (No.); UFGP: Unfilled Grain per Panicle (No.); YGP: Grain yield (gm panicle-1); PBPPa: Primary branch per panicle.
Table 3: Correlation coefficient of yield and yield contributing characters.
|
Characters |
PH |
LL |
LB |
PaL |
100 GW |
GPPa |
FGPPa |
UGPPa |
PB |
YGPa |
|
PH |
|
0.71 |
-0.93 |
0.64 |
-0.70 |
-0.27 |
-0.08 |
-0.91 |
-0.52 |
-0.12 |
|
LL |
|
-0.58 |
0.73 |
-0.50 |
0.19 |
0.38 |
-0.76 |
-0.69 |
0.17 |
|
|
LB |
|
-0.35 |
0.48 |
0.58 |
0.40 |
0.96** |
0.60 |
0.46 |
||
|
PaL |
|
-0.914** |
0.5551 |
0.7044** |
-0.4688 |
-0.0558 |
0.65 |
|||
|
100GW |
|
-0.3270 |
-0.4641 |
0.4935 |
-0.1389 |
-0.49 |
||||
|
GPPa |
|
0.9771** |
0.4176 |
0.3960 |
0.96 |
|||||
|
FGPPa |
|
0.7121** |
0.2648 |
0.95 |
||||||
|
UFGPa |
|
0.69 |
-0.35 |
|||||||
|
PB |
|
0.44 |
||||||||
|
YGPa |
|
|
|
|
|
|
|
|
|
|
PH: Plant height (cm); LL: Leaf length (cm); LB: Leaf breadth (cm); PaL: Panicle length (cm); 100GW:100 Grain weight; GPa: Grains per panicle (No.); FGPa: Filled grains per panicle (No.); UFGP: Unfilled grain per panicle (No.); YGP: Grain yield (gm panicle-1); PB: Primary brach.
as well as yield attributing quantitative traits revealed that the association between grain yield vs total GPa (0.96**) and FGPa (0.95**) was positively significant (Table 3). Another study reported same for GPa (Hairmansis et al., 2010), fertility percentage and spikelet per panicle (Ullah et al., 2011), as well as panicle length. Alternatively, non-significant (NS) positive correlation was resulted among yield per plant vs LL, leaf breadth, PaL, and primary branches. Interestingly, NS and negative association was calculated for grain yield with PH, 100-GW and UFGPa. The result was same with data published by Chaudhary and Das (1998); Shanthi and Singh (2001). NeWall and Eberhart (1961) described that incase of negative correlation between two traits it is difficult to select these traits in the development of new genotypes. Significant differences were observed for PH, stem diameter, flag leaf length, 100-GW and yield per hectare in advance rice lines developed in the background of Basmati-385 (Shah et al., 2020).
Conclusions and Recommendations
In this experiment, the studied 13 rice genotypes were evaluated for yield and yield attributing traits, and the findings of the present investigation on variability, heritability, and genetic advance revealed adequate variability present in the components and scope of improvement for grain yield through selection. Further, studies on character association revealed the importance of panicle bearing tillers per hill and number of filled grains per panicle might be a potential selection criteria for effective yield improvement. The heritability, GCV, PCV indicated that leaf breadth, PH, PaL, FGPa, grain per panicle are the yield contributing characters. The grain yield association with GPa (0.96**) and FGPa (0.95**) was positive and significant. Beside the NS positive correlation NS negative association also was calculated for grain yield with PH, 100-GW and UFGPa that indicated the need for balanced selection in crop yield improvement programs. So, the study on the correlation coefficient revealed the magnitude of GPa and filled GPa is the selection tools in effective breeding program for the improvement of yield. The results might be helpful in identification of the materials for the breeding program which can be studied further.
Acknowledgments
This research was supported by Bangladesh Academy of Science funded by United States Department of Agriculture (BAS-USDA) for the BAS-USDAPALSRU-CR41 project.
Novelty Statement
Genetic variation and correlation study by the morphological characters of rice varie-ties is a good source for breeding program in desirable variety development. Infor-mation regarding the genetic diversity and heritability of the ancient used germplasms has been presented in the paper which were not previously studied.
Author’s Contribution
MSA, MSH and MNM presented the concept of the study. MSA, MAM and MNM planned methodology.MNM, MSH did investigation. MSA wrote the manuscript. MSA, MAM and MRC analysed the data. MNM, MSH, MRC and SA reviewed and editted the manuscript. MSA, MAM, MNM, MRC, MSH and SA revised the manuscript. MSH and MNM supervised the study. MNM and MSH managed funding acquisition.
Conflict of interest
The authors have declared no conflict of interest.
References
Akanda, M.A.L., M.S. Alam and M.M. Uddin. 1997. Genetic variability, correlation, and path analysis in maize (Zea mays L) inbreds. Bangladesh J. Plant Breed Genet. 10: 57-61.
Akinwale, M.G., G. Gregorio, F. Nwilene, B.O. Akinyele, S.A. Ogunbayo and A.C. Odiyi. 2011. Heritability and correlation coefficient analysis for yield and its components in rice (Oryza sativa L.). Afr. J. Plant Sci., 5: 207-212. https://doi.org/10.3923/ijpbg.2011.224.234
Atlin, G., 2003. Improving drought tolerance by selecting for yield. In: Breeding Rice for Drought-prone Environments, Fischer, K.S., R. Lafitte, S. Fukai, G. Atlin, and B. Hardy (Eds.). Los Banos, The Philippines, pp. 14-22.
Burton, G.W., 1952. Quantitative inheritance in grasses. Proc. Int. Grassland Congr., 1: 277-283.
Chaudhary, P.K.D. and P.K. Das. 1998. Genetic variability, correlation, and path analysis in deepwater rice. Ann. Agric. Res., 19(2): 120-124.
Deshapriya, N.L., M.G. Mahboob, A.K. Hasan, M. Hazarika and L. Samarakoon. 2014. Rice production forecasting from Modis Ndvi data in the Sylhet region of Bangladesh.
Hairmansis, A.B., Kustianto, Supartopo and Suwarno, 2010. Correlation analysis of agronomic characters and grain yield of rice for tidal swamp areas. Indonesian J. Agric. Sci., 11: 11-15. https://doi.org/10.21082/ijas.v11n1.2010.11-15
Ishfaq, M., N. Akbar, I. Khan, S.A. Anjum, U. Zulfiqar, M. Ahmad, M. Ahmad and M.U. Chattha. 2018. Optimizing row spacing for direct seeded aerobic Rice under Dry and Moist Fields. Pak. J. Agric. Res., 31(4): 291-299. https://doi.org/10.17582/journal.pjar/2018/31.4.291.299
Johnson, H.W., H.F. Robinson and R.E. Comstock. 1955. Estimation of genetic and environmental variability in soybeans. Agron. J. 47: 314-318. Rice in Bangladesh. Int. J. Plant Breed Genet., 5: 246-254. https://doi.org/10.2134/agronj1955.00021962004700070009x
Khan, A.S., M. Imran, and M. Ashfaq. 2009. Estimation of genetic variability and correlation for grain yield components in rice (Oryza sativa L.). Am. Eurasian J. Agric. Environ. Sci., 6: 585-590.
Kole, P.C., N.R. Chakraborty and J.S. Bhat. 2008. Analysis of variability, correlation, and path coefficients in induced mutants of aromatic non-basmati rice. Trop. Agric. Res. Exten., 113: 60-64. https://doi.org/10.4038/tare.v11i0.1791
Lush, J.L., 1949. Heritability of quantitative characters in farm animals. Hereditas. Supplementary Volume 356-375. [EWC] https://doi.org/10.1111/j.1601-5223.1949.tb03347.x
Mustafa, M.A. and M.A.Y. Elsheikh. 2007. Variability, correlation, and path coefficient analysis for yield and its components in rice. Afr. Crop Sci. J., 15: 183-189.
NeWall, L.C. and S.A. Eberhart. 1961. Clone and progeny evaluation in the improvement of switch grass (Panicumvirgatum L.). Crop. Sci., 1: 117-121. https://doi.org/10.2135/cropsci1961.0011183X000100020010x
Sadeghi, S.M., 2011. Heritability, phenotypic correlation, and path coefficient studies for some agronomic characters in landrace rice varieties. World Appl. Sci. J., 13: 1229-1233.
Shanthi, P. and J. Singh. 2001. Genetic divergence for yield and its components in induced mutants of Mahsuri rice (Oryza sativa L.). Res. Crop., 2: 390-392.
Shah, B.H., F.S. Hamid, S.U. Islam, N. Ahmed, F. Ahmad, N. Khan and Q.U. Zaman. 2020. Evaluation of elite rice (Oryza sativa L.) lines for yield and yield Components. Pak. J. Agric. Res., 33:(1): 135-139. https://doi.org/10.17582/journal.pjar/2020/33.1.135.139
Singh, R.K. and B.D. Chaudhary. 1985. Biometrical methods of quantitative genetic analysis. Haryana J. Hortic. Sci., 12: 151-156.
Singh, R.K., P.L. Gautam, S. Saxena and S. Singh. 2000. Scented rice germplasm: Conservation, evaluation, and utilization. In: Aromatic Rice, Singh, R.K., U.S. Singh, and G.S. Khush (Eds.). Oxford and IBH Publishing, New Delhi, pp. 107-133.
Ullah, M.Z., M.K. Bashar, M.S.R. Bhuiyan, M. Khalequzzaman and M.J. Hasan. 2011. The interrelationship and cause-effect analysis among morpho-physiological traits in biroin rice of Bangladesh. Int. J. Plant Breed Genet. 5:246-254. https://doi.org/10.3923/ijpbg.2011.246.254
Umadevi, M.P. Veerabadhiran and S. Manonmani. 2009. Genetic variability, heritability, genetic advance, and correlation for morphological traits in rice genotypes. Madras Agric. J., 96: 316-318.
Warner, J.N., 1952. A method for estimating heritability. Agron. J., 44(8): 427-430. https://doi.org/10.2134/agronj1952.00021962004400080007x
Zahid, M.A., M. Akhter, M. Sabar, Z. Manzoor and T. Awan. 2006. Correlation and path analysis studies of yield and economic traits in basmati rice (Oryza sativa L.). Asian J. Plant Sci., 5: 643-645. https://doi.org/10.3923/ajps.2006.643.645
To share on other social networks, click on any share button. What are these?