
An Estimation of Expenditure, Own and Cross Price Elasticities of Meat in Pakistan


Research Article
An Estimation of Expenditure, Own and Cross Price Elasticities of Meat in Pakistan
Kubra Siddique*, Ghaffar Ali, Irfan Ullah, Atta Ullah Shah and Muhammad Fayaz
Department of Agricultural and Applied Economics, The University of Agriculture Peshawar, Khyber Pakhtunkhwa, Pakistan.
Abstract | This paper aims to estimate the expenditure, own and cross price elasticities of meat in Pakistan. Working-lesser model is used to estimate elasticities using cross-sectional data from Household Integrated Economic Survey of Pakistan for the year 2013-14. Economic factors such as food commodities prices, households’ income and their socioeconomic characteristics are included in the model. The results reveal that on the average, households in rural region spend more on the food items while, urban households spend more on non-food items. Expenditures on beef is noted highest for both urban and rural region followed by chicken, fish and other meat type (Eggs, Shrimps, Prawns). Empirical results show that for all the selected meat type expenditure elasticities are positive suggesting them as normal goods. The expenditure elasticities for mutton and beef are greater than one and are expenditure elastic while chicken, fish and other meat type are expenditure-inelastic. Own-price elasticities for the beef, chicken, fish and mutton are less than unity suggesting them as price-inelastic except other meat type which is highly price-elastic. Cross price elasticities show that most of the meat types are complementary. Others meat category, chicken and fish in both the rural and urban regions are price inelastic confirms that they are having important role in the balanced diet and sustenance of Pakistani household therefore this study recommends promoting of chicken and fish production in both the rural and urban regions of Pakistan.
Received | January 04, 2019; Accepted | April 26, 2019; Published | May 20, 2019
*Correspondence | Kubra Siddique, Department of Agricultural and Applied Economics, The University of Agriculture Peshawar, Khyber Pakhtunkhwa, Pakistan; Email: Kubrakhan90@yahoo.com
Citation | Siddique, K., G. Ali, I. Ullah, A.U. Shah and M. Fayaz. 2019. An estimation of expenditure, own and cross price elasticities of meat in Pakistan. Sarhad Journal of Agriculture, 35(2): 623-629.
DOI | http://dx.doi.org/10.17582/journal.sja/2019/35.2.623.629
Keywords | Meat, Own and cross price elasticities, Expenditures elasticities, Urban and rural region, Pakistan
Introduction
Food is the fundamental requirement, it contains energy, vitamins, protein and all the nutrients that are obligatory for the existence of life. Food consumption is a vital process and is mostly affected by household size, regional characteristics, allocation of assets and income, prices and number of employed persons etc. in extended family. Intake of food is essential process for human beings to survive (Siddique, 1982). Every individual inevitably requires food in minimum quantity for its survival. Across the various income groups and regions, the characteristics, amount and heterogeneity of consumed food shows varied changes (Begum et al., 2010).
With the passage of time Pakistan has made a revalutionarytory advancement and raised the overall accessibility of major food items, such as eggs, sugar, milk, meat, and cereals which resulted an increase of 2450 calories in 2012-13 in overall intake of 2078 calories in 2014). From 2008, access to food has been adversely affected by the continuous increase in the price of important food items and declining wages. World food price indicator has increased around 42 percent since 2006 (Haq et al., 2008). During this period an increase in meat, oil, dairy produce, sugar and cereal by 31, 47, 59, 3.6 and 60 percent has been observed (FAO, IFAD and WFP, 2013).
Meat as a fundamental food item of consumption play an important role to sustain population health conditions, well-being and macro-economic outlooks for the agricultural business. Meat is the foremost and utmost commodity that we consume in our routine diet (Kalambet Tetiana, 2015). Meat can be a separate balanced diet that adds valuable nutrients, especially adventitious to the health. Meat and meat containing products comprises of important vitamins, minerals, micronutrients and protein that are all important for the growth and development of material and mental fitness (Jalil et al., 2013). According to Food and Agriculture Organisation estimates more than 2 billion human beings are meat deficient in their daily consumption as compared to developed countries where the per capita meat consumption is relatively very high. In developing countries where the per capita meat consumption is below 10 kg are regarded as important nutrient deficient (such as vitamin A, iron, zinc and iodine) and undernourished (FAO, 2014).
Pakistan’s livestock sector plays a significant role in GDP because of its considerable meat production. In the rural economy, role of livestock is revolutionary because 30-35 million people receive 40 % of their earnings through livestock raising (Jalil et al., 2013). Contribution of livestock to agriculture value added stand at 56.3 percent while its contribution to the national GDP was 11.8 percent throughout 2013-14 compared to previous year that was 55.6 percent and 11.8 percent respectively (GoP, 2014). An increase of 2.7 % from Rs. 778.3 billion (2012-13) to Rs. 801.3 billion (2013-14) in the livestock’s gross value added has been observed compared to last year (GoP, 2014).
Rural and urban region people make the expenditures on various commodities to satisfy their wants. These expenditures which they made on the various food commodities are essential to determine the household behavior. Hence, to analyze the consumer behavior, food consumption is expressed as the expenditures on various food commodities impelled by the household which they purchase to fulfill their everyday food need. Consumption expenditures indicate the household’s living standard. Therefore, consumption and consumption pattern analysis provide an understanding of human resource of the country. Keeping in view the importance of meat in life and economy this study will provide an understanding to compare the difference in the food consumption pattern across both the rural and urban regions of Pakistan by calculating the expenditure elasticities and to make out how various factors influence the demand for the meat in the study area.
The remainder of this paper is organized into four sections. Theoretical modelling and data used to estimate own, cross-price and expenditures elasticities is discussed in section 2. Section 3 comprise the empirical results and the last section presents the conclusion and policy recommendations.
Materials and Methods
Household Integrated Economic Survey (HIES) for the year 2013-14 is used in this study collected from a sample of a 1307 PSUs which covered 17989 households . HIES part of the PSLM survey consists income and consumption data being collected by both male and female enumerators using team approach. To record data, the respondents were asked to recall the consumption on goods and services over the last 14 days, 30 days and one year respectively using the improved version household consumption and income part of the PSLM questionnaire. To, estimate the income and expenditure of household, total number of household were converted to household’s size and monthly household’s expenditures were used as the proxy of income. To estimate the total expenditure of all four types of meat in Pakistan for their individual prices and share of selected meat types was analyzed.
Model specification and estimation
The model applied in this research is Working-Leser and its original form was declared by Working (1943) and Leser (1963). Intriligator et al. (1996) and Deaton and Muellbauer (1980a) give a more particular discussion of this operational form. In the Working-Leser model, each and every share of the food detail is simply a direct function of the log of prices and total expenditure on all food items that are to be examined. The Working-Leser food demand function can be expressed as:
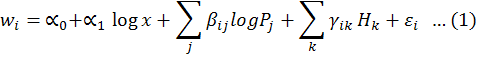
Where;
i,j represent four types of meat; wi = Budget share of all meat types included in our study; Pj = Price of meat j; x = Total expenditure on meat; Hk= Dummy variable such as rural or urban, and adult equivalent ; AdEq = Log of Adult Equivalent; ei = Random disturbances i.e with zero mean and constant variance.
The socioeconomic variables include household size measured as the number of household members; a binary variable for regional dummies representing the urban and rural region. Binary variables are equal to 1 when the phenomenon exists and 0 otherwise. In this study, socioeconomic, demographic, and regional characteristics included in Equation 1. Consumption of food and non-food items of household vary due to the difference in their size and composition. Adults nutritional requirements are different form children. So, there is a need of adjusting the household size by taking into account the age and sex (Jan et al., 2008). Therefore, we assign adults equivalence factor on the basis of individual age, gender and calorie intake.
Expenditure elasticity estimation of four types of meat.

Where;
ei=Expenditure elasticity; αi= Log of total expenditure of each meat type; wi = Mean share of each meat type.
Own and Cross Price Elasticities.
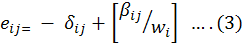
Where;
i,j = 1…..n ; δij = Kronecker delta , in own price it will be equal to one while in cross price it will be equal to zero; wi = Mean share of each meat type; βij = Coefficient of each meat type.
Total household’s expenditures are infrequently used as the proxy of the income as they are the mirror for household’s perpetual income. As the fact that expenditures usually show the household’s permanent income and income data usually allow measurement errors. Therefore, household’s monthly expenditures were given as the household’s income proxy abide by (Fayaz et al., 2014) and acquired by aggregating food and non-food consumption expenditure. During this survey period not all the household’s purchased all the selected commodities. In the data where no quantity or expenditures occurred, these missing values were replaced by average mean prices for the household’s consumption (Chern et al., 2002).
Results and Discussion
Monthly expenditures of household on food and non-food items
Table 1 shows in Pakistan total food and non-food expenditures were Rs 27407.11 of which rural region expenditures on the food and non-food items were 60.76% and 39.24% respectively while urban region expenditures on both the food and non-food expenditures were 47.02% and 52.98% respectively. Rural region people spend more on the food items compared to non-food items while urban region people spend more on non-food items than food items.
Table 1: Estimated total monthly household’s expenditures on food and non-food items.
| Area | Monthly Food Expenditures | Monthly Non-food Expenditures | Total Monthly Expenditures |
| Overall |
14985.54 (54.68%) |
12421.57 (45.32%) |
27407.11 (100%) |
| Rural |
14205.51 (60.76%) |
9174.943 (39.24%) |
23380.45 (100%) |
| Urban |
16456.4 (47.02%) |
18543.49 (52.98%) |
34999.89 (100%) |
Source: HIES data 2013-2014.
Allocation of total monthly expenditures on selected meat types
Table 2 shows that household overall monthly expenditures and their share on selected meat types in both the rural and urban regions of Pakistan. For overall Pakistan total expenditures on selected meat types were Rs. 4368 of which 41.88% were allocated to the mutton, 22.19% to beef, 16.10% to chicken, 14.198% to fish and only 5.62% were on others meat types. Total expenditures in rural region were Rs. 4359.46 from which expenditures on mutton were 43.46%, beef was 23.00%, chicken was 15.31%, fish was 12.78% and other meat type was 5.45%. In urban region overall monthly expenditures were Rs. 4410.066 of which 39.23% were allocated to mutton, 20.83% to beef, 17.30% to chicken, 17.09% to fish and 5.57% to others meat types. Average expenditures on mutton take over the largest share with in the structure of selected meat type in both the rural and urban regions of Pakistan followed by the beef, chicken and fish
Table 2: Estimated total monthly expenditures on selected meat type.
| Area | Beef | Chicken | Fish | Mutton | Others | Total Expenditures |
| Overall |
969.4145 (22.19%) |
703.6493 (16.10%) |
620.2435 (14.198) |
1829.434 (41.88%) |
245.6637 (5.62%) |
4368.405 (100%) |
| Rural |
1002.769 (23.00%) |
667.4969 (15.31%) |
557.0897 (12.78%) |
1894.601 (43.46%) |
237.5049 (5.45%) |
4359.4615 (100%) |
| Urban |
918.423 (20.83%) |
763.0191 (17.30%) |
753.8381 (17.09%) |
1729.123 (39.23%) |
245.6637 (5.57%) |
4410.0669 (100%) |
Source: HIES data 2013-2014.
whereas smallest expenditure share was associated with the other meat types. This shows that they spent more on mutton and beef compared to other selected meat types.
Elasticity estimation
Expenditure elasticities show change in the consumption of a particular commodity given allocated budget share for that group (Khanal et al., 2017). Table 3 show expenditure elasticities of beef in both the rural (1.02) and urban (1.09) regions were expenditure elastic means that a 1 percent increase in the total expenditures increases the expenditures on beef would tend to increase by 1.02% and 1.09% in both the regions respectively and these results are in line with the beef expenditure elasticity result of Yousaf (2012) in demand estimation. Expenditure elasticities for the chicken in rural (0.84) and urban (0.83) were expenditure inelastic which shows that rise in the total expenditures by 1% would tend to cause an increase in chicken expenditures by 0.84% and 0.083% in both the regions respectively and this result is consistent with the Kenyan study results of (An. M et al., 2016) who classified the chicken as the necessity due to its rearing and readily availability for consumption while results or contrary to (Bett et al., 2012) who reported beef with 0.84 expenditure elasticity classified as necessity. Fish having expenditure elasticity (0.92) in rural region showed its near unitary elastic demand clearly indicates that the increase in expenditures are less than that of the households’ income. These results are in accordance with the findings of (Talijaard et al., 2004) observed the same trend for the pork. While expenditure elasticity for the fish in the urban region was (0.59) which indicates that fish demand growth in the urban region is smaller than rural region and can be considered as a necessity good in the diet of urban people in line with the Saudian study by (Selevanathan et al., 2015) but against the findings of (Talijaard et al., 2004) the same trend for the chicken in South Africa. This might be due to its readily availability for the consumption. Expenditure elasticities of the mutton in both rural (2.725) and urban (1.15) region are greater than 1 and are expenditure elastic for demand means they are luxury good. Mutton expenditures are most elastic up to 2.725 which means when the household’s expenditures will increase by 1% mutton consumption will increases by 2.72% in (rural) and 1.15% in (urban) region against the findings of Japanese by (Chern et al., 2003) who reported the beef expenditure elasticity most elastic and stated this may be due to the increase beef import. But this is in line with the African study of (Talijaard et al., 2004) who observed the mutton and beef expenditure elasticities greater than one and can be considered as luxury good in the diet of African household. Expenditure elasticities of other meat type were positive for both the rural (0.051) and urban (0.10) regions and categorized others meat type as most expenditure inelastic good. This implies that demand growth for the others meat type would be less in the rural areas than urban area and leads to the less consumption and demand for the others meat type. This may be due to the reason that others consist of meats (e.g. prawns and crabs) in data which according to (Font-i-Furnols and Guerrero, 2014) consumer not prefer some meat and meat products due to their physiological and sensory and marketing issues. Expenditure elasticities of mutton and beef being most elastic indicate less consumption of mutton and beef in both the regions of Pakistan compared to the other selected meat types. Others meat types in both the regions being the most inelastic can be rendered as most consumed commodity indicating that poor people depend utmost on others meat types (eggs, prawn’s ducks etc) for their protein consumption followed by the chicken and fish.
Expenditure elasticities of all the selected meat types are positive indicating that demand for these meat types can be expected to increase as an increase in the income which is comparable to the Indonesian study that reports the coverage of similar commodities (Hatasuhut et al., 2001). Expenditure elasticities in the rural region are found to be high compared to the urban region which according to (Chikobola et al., 2016) indicates the difference in the consumption pattern of rural household than urban region due to low income level and income distribution, smaller demand meat growth (Hatasuhut, 2001) and less access of rural household to meat and are nutrient deficient (Ahmed et al., 2015).
Table 3: Estimated expenditure elasticities.
| Meat types | Region 1 (Rural) | Region 2 (Urban) |
| Beef | 1.02 | 1.09 |
| Chicken | 0.84 | 0.83 |
| Fish | 0.92 | 0.59 |
| Mutton | 2.725 | 1.15 |
| Others | 0.051 | 0.10 |
Source: Author’s Own Estimation.
Own and cross price elasticities
All the own price elasticities of beef, chicken, fish, mutton and other meat type are negative in both the regions which shows that for each meat type when the price rises demand of the household will go down, this is in accord with the law of demand. All the own price elasticities are less than 1 except others indicating that demand for beef, chicken, fish and mutton is price inelastic means quantity demanded is not very sensitive to the price as shown in Table 4. These results are in accordance with the findings of Tunisia study by (Dhraief et al., 2013) indicating that an increase in the price of beef, chicken, fish and mutton would drop the quantity demanded. As number of substitute decreases elasticity or price sensitivity decreases. While the own price elasticity of others meat in both the region is very elastic. Others meat type own price elasticity in both the regions is highly elastic. Other meat type has highest own price elasticity and lowest expenditure elasticity indicating that others meat type demand in both the regions is more driven by the price change than the income/ expenditure change. The results are similar with the results of (Wang, 2014) who reported the same case in “DCM” region and stated this may be due to the difference in the household’s income or prices in both the regions that causes the consumption behaviour difference. This beef result is against the Indian study by (Dastagiri, 2014) who reported positive beef own price elasticity in rural region. These can be termed as the necessities in the diet of rural and urban households or we can say that in everyday all meat types except others are an easy option that can be traded.
Table 4: Estimated own and cross price elasticities.
| Meat | Rural | Urban | |
| Beef | Own price | -0.93 | -0.811 |
| Cross price | Chicken | -0.228 | -0.276 |
| Fish | -0.128 | -0.112 | |
| Mutton | -0.187 | -0.160 | |
| Others | -0.093 | -0.126 | |
| Chicken | Own price | -0.589 | -0.683 |
| Cross price | Beef | -0.207 | -0.216 |
| Fish | -0.149 | -0.109 | |
| Mutton | -0.156 | -0.170 | |
| Others | -0.101 | -0.107 | |
| Fish | Own price | -0.387 | -0.352 |
| Cross price | Beef | -0.162 | -0.119 |
| Chicken | -0.367 | -0.254 | |
| Mutton | -0.128 | -0.118 | |
| Others | -0.084 | -0.128 | |
| Mutton | Own price | -0.856 | -0.405 |
| Cross price | Beef | -0.183 | -0.157 |
| Chicken | -0.136 | -0.149 | |
| Fish | -0.108 | -0.1108 | |
| Others | -0.063 | -0.054 | |
| Others | Own price | -3.350 | -1.34 |
| Cross price | Beef | -0.138 | -0.158 |
| Chicken | -0.279 | -0.318 | |
| Fish | -0.060 | 0.003 | |
Source: Author’s Own Estimation.
Cross price elasticities between the two commodities measures the possibilities for substitution. It is shown that chicken, fish, mutton and others are complement of beef while beef, fish, mutton and others are complement of chicken. Negative cross price elasticities of beef, chicken, mutton and others for the fish indicates that they are gross complements of fish while negative chicken, fish, beef and others cross price elasticities for the mutton shows that these are gross complements of mutton.
Cross price elasticities for other meat shows that beef and chicken are the complements of the others while fish in rural region is a gross compliment of other meat while in urban region fish is a gross substitute. In case of others meat positive sign with mutton in both the rural and urban region shows that it’s a gross substitute of others meat.
Conclusion and Recommendations
This research uses the working-lesser model to estimate own-cross price elasticities of meat products in the Pakistan by using HIES data. In all over the Pakistan total food and non-food expenditures are Rs 27407.11 of which rural region expenditures on the food and non-food items are 60.76% and 39.24% respectively while urban region expenditures on both the food and non-food expenditures are 47.02% and 52.98% respectively. Rural region people spend more on the food items compared to non-food items while urban region people spend more on non-food items than food items. Positive expenditure elasticities for all the selected meat types shows that they are normal goods in both the regions. Expenditure elasticities of mutton and beef are expenditure elastic (>1) in both the regions of Pakistan which shows that when an increasing propensity is ascertained in the household’s expenditures, they tend to allocate proportionately more on the mutton and beef than others. Others meat types, Fish and chicken in both the regions are expenditure inelastic (<1). Consumers are less sensitive to the fish price and income when they determine their consumption pattern. Others meat category being most inelastic depicts that people of rural and urban region of Pakistan depend in extreme of others meat types for their consumption of protein. Own price elasticities of all the selected meat types in both the region are negative, which depicts that for each selected meat type when price rises household’s demand goes down, and this is in accordant with the law of demand. Own price elasticities of beef, chicken, fish and mutton are price inelastic means demand doesn’t respond more than the percentage change in price. While others meat type elasticity in both the regions is very elastic. High own price elasticity and low expenditure elasticity depicts that others meat type demand is more driven by price change than expenditures. Cross price elasticities show the dominance of complementary relationship except for the substitution relationship exhibited between the others meat type and mutton in both the regions and other meat category and fish in urban region. Others meat category, Chicken and fish in both the rural and urban regions are proved to be price inelastic means they perform an important role in the diet and sustenance of Pakistani household therefore it is recommended to promote the chicken and fish production in both the rural and urban regions of Pakistan. In Pakistan to increase the meat consumption, prices of meat should be reduced to boost their purchasing power.
Author’s Contribution
Kubra Siddique: Conducted the study, reviewed literature, wrote introduction and methodology.
Ghaffar Ali: Developed main theme of the research, wrote abstract, conclusions and recommendations, provided technical input at every step.
Irfan Ullah: Provided guidance in model development.
Syed Atta Ullah Shah: Helped in analyzing data.
Muhammad Fayaz: Performed proof reading of the draft and corrected references.
References
Ahmad, N., M.R. Sheikh and K. Saeed. 2015. Rural urban food consumption analysis in Pakistan: Expenditure elasticities approach. Pak. J. Commerce Soc. Sci. 9(1): 159-170.
Begum, S., M. Farooq, M. Khan, N. Begum and A. Khan. 2010. Influence of socio economic factors on food consumption pattern in district Nowshera. Sarhad J. Agric. 26(3): 405-408.
Bett, H.K., M.P. Musyoka, K.J. Peters and W. Bokelmann. 2012. Demand for meat in the rural and urban areas of Kenya: A focus on the indigenous chicken. Econ. Res. Int. 2012: 10. https://doi.org/10.1155/2012/401472
Chern, W.S., K. Ishibashi, K. Taniguchi and Y. Tokoyama. 2003. Analysis of the food consumption of Japanese households. Econ. Soc. Dev. Pap. pp. 1-81.
Chikobola, M.M. and A.K. Edriss. 2016. Estimation of rural-urban expenditure and elasticities of food items in Zambia: Evidence from living conditions monitoring survey. Mod. Econ. 7(05): 567-574. https://doi.org/10.4236/me.2016.75062
Deaton, A.S. and J. Mullbauer. 1980. An almost ideal demand system. Am. Econ. Rev. 70(3): 312-326.
Dhraief, M.Z., M. Oueslati and B. Dhehibi. 2013. Income, education and age effects on meat and fish demand in Tunisia. Int. J. Food Agric. Econ. 1(2): 1-12.
FAO, IFAD and WFP. 2013. The state of food insecurity in the world 2013. The multiple dimensions of food security. Rome, FAO.
FAO. 2014. The state of food security in the world 2014: Economic crises—Impacts and lessons learned. Rome.
Fayaz, M., A.U. Jan and D. Jan. 2014. Quality elasticity of vegetable consumption in Pakistan: a comparison of urban and rural households. Sarhad J. Agric. 30(4): 451-458.
Font-i-Furnols, M. and L. Guerrero. 2014. Consumer preference, behaviour and perception about meat and meat products: An overview. Meat Sci. 98(3): 361-371. https://doi.org/10.1016/j.meatsci.2014.06.025
Hutasuhut, M., H.S. Chang, G. Griffith, C.O. Donnell and H. Doran. 2001. The demand for beef in Indonesia: Implications for Australian Agribusiness Vol. 4. Univ. N. Eng. Grad. Sch. Agric. Res. Econ.
Intriligator, M., R. Bodkin and C. Hsiao. 1996. Application to households; demand analysis. In Econometric models, techniques, and applications. New Jersey, USA, Prentice-Hall.
Jalil, H., S.S. Hussain and A.F. Siddiqi. 2013. An empirical study of meat supply chain and prices pattern in Lahore (Pakistan): A case study. J. Supply Chain Manag. Sys. 2(4).
Jan, A., A.F. Chishti, D. Jan and M. Khan. 2008. Estimating consumers’ response to food quality: A case of Pakistan Fruits. Sarhad J. Agric. 24 (1): 151-154.
Kalambet and Tetiana. 2015. Consumers’ preferences: Structural changes in Demand for meat and Poultry in Ukraine. Master Thesis https://www.google.com.pk/57j0.18516j0j7andsourceid=chromeandie=UTF-8
Leser, C.E.V. 1963. Forms of Engel functions. Econ. 31(4): 694-703. https://doi.org/10.2307/1909167
Moni, A.N., J.N. Nzuma and K. Munei. 2016. An assessment of the demand for meat in central Kenya. Afr. J. Agric. Econ. Rural Dev. 4 (10): 480-488.
Wang. G. 2014. An analysis of structure change of food demand in China. Master Thesis. https://www.google.com.pk/search?ei=gqL_14+meatandoq=guanqing+wang+2014+meatandgs_l=psy-ab.3..33i160%20.21439.
Haq, U.Z., H. Nazli, K. Meilke. 2008. Implications of high food prices for poverty in Pakistan. Agric. Econ. 39: 477–484. https://doi.org/10.1111/j.1574-0862.2008.00353.x
Selvanathan, S., E.A. Selvanathan, S. Albalawi and M. Hossain. 2016. Meat and fish consumption patterns in Saudi Arabia. Appl. Econ. 48(5): 446-460. https://doi.org/10.1080/00036846.2015.1083081
Siddiqui, R. 1982. An analysis of consumption patterns in Pakistan. Pak. Dev. Rev. 21(4): 275-296. https://doi.org/10.30541/v21i4pp.275-296
Taljaard, P.R., Z.G. Alemu and H.D. van Schalkwyk. 2004. The demand for meat in South Africa: An almost ideal estimation. Agrekon. 43(4): 430-443. https://doi.org/10.1080/03031853.2004.9523659
Wang. G. 2014. An analysis of structure change of food demand in China. Master Thsis. https:// www.google.com.pk/search?ei=gqL_14+meatandoq=guanqing+wang+2014+meatandgs_l=psy-ab.3..33i160%20.21439
Working, H. 1943. Statistical laws of family expenditures. J. Am. Stat. Assoc. 38(221): 43-56. https://doi.org/10.1080/01621459.1943.10501775


