
An ideal genotype must possess yield constancy under erratic environments to become a popular cultivar. The genotypes contributing least towards genotype by environment interaction (GEI) are considered stable ones. The present experiment was carried out at five locations viz., Multan, Faisalabad, Khanpur, Vehari and Sahiwal in the Punjab province in Pakistan for two years 2020-21 and 2021-22. Ten promising upland cotton genotypes recently bred by different research stations were sown by following a randomized complete block design (RCBD) with three replications. The main objective was to pinpoint cotton genotypes with stable yield performance across the studied environments. Additive main effects and multiplicative interaction (AMMI) analysis results depicted that maximum variability was due to environments (63.9%) followed by GEI (24.1%). The first two interaction principal components (IPCs) were squeezed with 75% of variability due to GEI. The genotype GN01 (SLH-Chandi) produced the maximum seed cotton yield (2181 kg ha-1) and was the winner in this trial. The site EN03 (Faisalabad during 2020-21) produced the highest seed cotton yield (2541 kg ha-1) with a (-6.82) IPC1 score. Genotype selection index (GSI: A non-parametric approach to determine yield stability) discriminated the genotype UAM-20 (GN08) as yielder cum stable one with the least GSI value of (6) followed by VH-418 (GN03), BH-225 (GN07) and Weal-Ag-11 (GN10) with same GSI value of (8). Approval of these genotypes for general cultivation from an authorized forum may be obtained to boost cotton production in the province.
Research Article · Volume 38, Issue 5, 28 November 2022 · Open Access
Yield Performance of Cotton Genotypes Across Diverse Environments in Punjab, Pakistan
· · · · · · · ·
Affiliations & Notes ⌄
- 1Cotton Research Station Vehari, Pakistan
- 2Center of Agricultural Biochemistry and Biotechnology, University of Agriculture Faisalabad, Pakistan
- 3Maize and Millets Research Institute Yusaf wala Sahiwal, Pakistan
- 4Central Cotton Research Institute old Shujabad Road Multan, Pakistan
- 5Cotton Research Institute old Shujabad Road Multan, Pakistan
- 6Soil and water testing laboratory Vehari, Pakistan
- 7Entomological Research Sub Station Multan, Pakistan
- 8Rice Research Institute Kala Shah Kaku, Pakistan. *Correspondence | Muhammad Jamil, Cotton Research Station Vehari, Pakistan
- 9Email: jamil1091abr@gmail.com
Article Info ⌄
- Journal:
- Sarhad Journal of Agriculture
- Published:
- 28 November 2022
From the article
- The AMMI analysis depicted that significant (p≤0.01) differences were present among genotypes, environments and GEI for seed cotton yield (Table 2).
- A greater sum of squares (SS) value for GEI than genotype effects showed that studied genotypes responded to test environments in an erratic pattern.
- The first ME consists of 5 test environments and is won by the genotype SLH-Chandi (GN01) with a seed cotton yield of 2181 kg ha-1 (Table 3).
- The cotton genotypes UAM-20, Weal-AG-11, BH-225 and VH-418 were found stable in yield performance in this study.
Selected from the article's own text.
Abstract
Introduction
Upland cotton (Gossypium hirsutum L.) is a real cash crop in Pakistan and is called white gold in the true sense. It provides lint to the textile sector, the main national export source. Approximately two per cent of our grand domestic product (GDP) is dependent on cotton . Its economic impact is approximately six hundred billion U.S dollars worldwide . Cotton seed is also a valuable source of edible oil for the rapidly growing population. The cotton-growing belt consisting of central and south Punjab remained a major production hub in the past, but production is declining each year drastically. The main reason behind this decline is changing climate and uneven performance of cotton cultivars across agro-environments.
Evaluation of elite genotypes under diversified agro-environmental conditions is a prerequisite for assessing yield stability . Generally, GEI impact is greater on yield, as it is a quantitative character with a low heritability value. Thus, seed cotton yield is dependent on genotypes, environments and GEI. Yield plus stability must be explored together in experiments to exploit the positive effects of GEI for the refined selection of genotypes . If the GEI is significant, then the selection of genotypes merely on a yield basis is ineffective and misleading .
Different biometrical tools are used by researchers to explore GEI. Additive main effects and multiplicative interaction (AMMI) are prominent among them. The genotype selection index (GSI) was found to be efficient in selection as it combines both mean yield and AMMI stability value (ASV) to single non-parametric criteria, which generates sufficient information for the selection of stable plant material . It was assumed that stable yielder cotton genotypes can boost production in the province.
The main purpose of this experiment was to quantify the GEI segment of variation. Further, to choose the best environment, and to identify the high-yielding and stable cotton genotypes.
Materials and Methods
The present experiment was sown at five locations viz., Multan, Faisalabad, Khanpur, Vehari and Sahiwal in the Punjab province in Pakistan for two years 2020-21 and 2021-22. Ten promising upland cotton genotypes recently bred by different research stations were studied (Table 1). Sowing was completed in the first week of May by adopting the protocol of randomized complete block design (RCBD) with three replications. Each plot was comprised of 7.8 m long 4 rows 0.75m apart. Manual thinning maintained a distance of 0.3 m between plants in the rows. The first irrigation was applied within a day after sowing. The remaining irrigations were applied at the interval of 7-21 days till the crop maturity depending upon weather conditions. Fertilizer was applied according to the soil analysis for optimum nutrient supply. Insect pest populations were kept below the economic threshold level (ETL) by spraying recommended agrochemicals.
Table 1: Detail of ten cotton genotypes and environments under study.
| Code | Genotype | Breeding station | Code | Genotype | Breeding Station |
| GN01 | SLH-Chandni | Cotton Research Station Sahiwal | GN06 | SLH-55 | Cotton Research Station Sahiwal |
| GN02 | FH-494 | Cotton Research Station Faisalabad | GN07 | BH-225 | Cotton Research Station Bahawalpur |
| GN03 | VH-418 | Cotton Research Station Vehari | GN08 | UAM-20 | MNS University Multan |
| GN04 | FH-414 | Cotton Research Station Faisalabad | GN09 | FH-498 | Cotton Research Station Faisalabad |
| GN05 | RH-King-20 | Cotton Research Station Khanpur | GN10 | Weal-AG-11 | Weal-Ag Seed Corporation Multan |
| Code | Location year latitude longitude altitude climate soil type average (m) Rainfall (mm) | ||||
| EN01 EN02 | Cotton Research Institute Multan. 2020-21 30° 11′ 52″ N 71° 28′ 11″ E 125 Arid Loamy 127 2021-22 | ||||
| EN03 EN04 | Cotton Research Station Faisalabad. 2020-21 31° 21′ 52″ N 72° 59′ 40″ E 184 Semi-Arid - 300 2021-22 | ||||
| EN05 EN06 | Cotton Research Station Khanpur. 2020-21 28° 25′ 12″ N 70° 18′ 0″ E 200 Arid Loamy 104 2021-22 | ||||
| EN07 EN08 | Cotton Research Station Vehari. 2020-21 29° 23′ 44″ N 71° 41′ 1″ E 135 Semi-Arid Loamy 135 2021-22 | ||||
| EN09 EN10 | Cotton Research Station Sahiwal. 2020-21 30° 39′ 52″ N 73° 06′ 30″ E 172 Semi-Arid - 285 2021-22 | ||||
Other recommended crop husbandry operations were carried out throughout the cropping season in a uniform way to minimize the experimental error. At the end of October, when maximum bolls were opened, picking was done by employing female labour. After cleaning trash seed cotton picked from each plot was weighed with electronic balance and plot yield was converted to kg ha-1 for comparison and analysis.
Data analysis
Yield data from each plot were put for the Analysis of Variance (ANOVA) technique . This technique can capture main effects due to genotypes and environment but do nothing with multiplicative effects if present. These effects can further be analyzed by using the principal component analysis (PCA) method. In the present study, data were analyzed by additive main effects and multiplicative interaction (AMMI) method as proposed by Gauch (2013). This technique is a novel combination of ANOVA and PCA, developed to handle bottlenecks of both of these as above mentioned. Captured amount of GEI was split into various interaction principal components (IPC) as per the protocol of PCA. A very minute portion of GEI was leftover and treated as residual. AMMISOFT version 1.0 available at (https://scs.cals.cornell.edu/people/hugh-gauch) was used for the analysis of data.
AMMI stability value (ASV) was calculated according to the method given by Purchase (1997). Similarly, the genotype selection index (GSI) values were obtained according to Farshadfar (2008). This approach combines both mean yield and ASV to select genotypes in multi-site varietal trials.
Results and Discussion
The AMMI analysis depicted that significant (p≤0.01) differences were present among genotypes, environments and GEI for seed cotton yield (Table 2). This indicated the presence of generous variation among cotton genotypes and test sites. The studied genotypes also illustrated uneven performance concerning seed cotton yield across test sites. Earlier researchers ; also reported similar results in field crops. The genotypes, environment and GEI accounted for 6.9, 63.9, and 24.1% of the total variation present in this trial respectively. This shows the largest portion of variation due to the environments, hence the importance of multi-environmental trials (MET) before variety approval was proved. These findings align with earlier cotton crop research by Riaz et al. (2013). A greater sum of squares (SS) value for GEI than genotype effects showed that studied genotypes responded to test environments in an erratic pattern. Zare (2012) also reported GEI > genotypes effects in a barley crop. Overall, higher treatment effects (94.9%) compared with error effects (5.1%) proved the accuracy and reliability of the MET experiments.
Table 2: AMMI analysis for seed cotton yield in ten cotton genotypes across five locations during 2020-21 and 2021-22.
| Source | DF | SS | MS | The proportion of the SS % | ||
| TV | A & IV | GEI | ||||
| Treatments | 99 | 124393847 | 1256504a | 94.9 | ||
| Genotypes | 9 | 9082819 | 1009202a | 6.9 | ||
| Environments | 9 | 83785024 | 9309447a | 63.9 | ||
| G x E | 81 | 31526004 | 389210a | 24.1 | 100 | |
| IPC-1 | 17 | 14822599 | 871918a | 47.0 | ||
| IPC-2 | 15 | 8816645 | 587776a | 28.0 | ||
| IPC-3 | 13 | 3003365 | 231028a | 9.6 | ||
| IPC-4 | 11 | 2148214 | 195292a | 6.8 | ||
| IPC-5 | 9 | 1542377 | 171375a | 4.9 | ||
| IPC-6 | 7 | 794849 | 113550 ns | 2.5 | ||
| IPC-7 | 5 | 266397 | 53279ns | 0.8 | ||
| Residual | 4 | 131559 | 32890ns | 0.4 | ||
| Error | 200 | 6644129 | 33221 | 5.1 | ||
| Blocks/ Env. | 20 | 1015756 | 50788ns | 0.8 | ||
| Pure error | 180 | 5628372 | 31269 | 4.3 | ||
| Total | 299 | 31037975 | 438254 | 100 | 100 | |
aSignificant at (p≤0.01) bSignificant at (p≤0.05) ns Non-significant. Note: F-test use error as blocks/environments is non-significant. DF= Degree of freedom; SS= Sum of squares; MS=Means sum of squares; TV= Total variance; A and IV=Additive and Interaction variance; GEI= Genotype by environment interaction.
AMMI analysis split GEI variation into 7 IPCs significant at (p≤0.01) and a minute value of GEI (0.4%) was left as residual. The first two IPCs captured 75% of GEI cumulatively. The SS for the GEI is more than three times greater than the genotype’s main effects, hence narrow adaptations are important for this dataset. AMMI model diagnosis is crucial for each data sets for considering biometrical and practical implications. For simplicity AMMI1 model was applied in the current study. Agahi et al. (2020) also used AMMI1 as the default model in the study on spring rape. This (AMMI1) model delineated ten test environments into 3 mega environments (ME) as illustrated (Figure 1). The first ME consists of 5 test environments and is won by the genotype SLH-Chandi (GN01) with a seed cotton yield of 2181 kg ha-1 (Table 3). This genotype also proved the overall winner of this trial. The second ME was won by genotype VH-418 (GN03) with (2038 kg ha-1) yield and consisted of 4 environments. The third ME consisted of only one environment EN07 and was won by the genotype GN06 (Figure 1).
An ideal environment is defined by Zubair et al. (2021) in which the performance of studied genotypes is recorded as optimum. The above biplot (Figure 2) revealed that EN08 (Vehari during 2021-22) is the nearest ideal site for cotton MET experiments, while ENT4 and ENT6 are located at the periphery of the biplot due to higher contents of GEI hence not suitable for such trials. Similarly, genotypes located at the centre of the biplot are stable yielders and bear the least GEI contents. The stable genotype was also linked with a lower IPC1 value in a recent study on cotton . Similar results were also reported by Sumathi et al. (2017).
Genotype selection index
When significant GEI was present then the selection of genotypes on a mean yield basis leads to biased results. AMMI analysis captures GEI efficiently but is unable to find stable genotypes. GSI was found reliable parameter for genotype selection in MET experiments. It is based on the ranks of mean yield and AMMI stability value. GSI values are presented in (Table 4). GN08 (UAM-20) was found most stable cum yielder genotype with the least GSI value of (6) followed by GN03 (VH-418), GN07 (BH-225) and GN10 (Veal AG-11) respectively. Contrary to this GN06 (SLH-55) was found most unstable plus poor yielders with the highest GSI value of 20.
Table 3: Mean performance (kg/ha) of 10 cotton genotypes in 10 environments (5 locations in 2 years) for seed cotton yield.
| Genotypes | Multan | Faisalabad | Khanpur | Vehari | Sahiwal | Mean yield Kg/ha | ||||||
| 2020-21 EN01 | 2021-22 EN02 | 2020-21 EN03 | 2021-22 EN04 | 2020-21 EN05 | 2021-22 EN06 | 2020-21 EN07 | 2021-22 EN08 | 2020-21 EN09 | 2021-22 EN10 | |||
| GN01 | SLH-Chandni | 506d | 2416ab | 2572bc | 3820a | 2186b | 2336de | 1722abc | 1752ab | 2178a | 2320a | 2181 |
| GN02 | FH-494 | 822b | 2559a | 2965a | 2835b | 2197b | 2477cd | 1130d | 2061a | 2387a | 1840c | 2127 |
| GN03 | VH-418 | 980a | 2057de | 2387cde | 2374c | 2868a | 2314de | 1902ab | 1704bc | 2276a | 1520d | 2038 |
| GN04 | FH-414 | 777b | 2033de | 2183e | 1814e | 2239b | 3104a | 1471bcd | 1651bc | 2378a | 1580d | 1923 |
| GN05 | RH-King-20 | 578cd | 2105cd | 2179e | 2178cd | 2008bc | 2568bcd | 1363bcd | 1600bc | 2367a | 2120ab | 1907 |
| GN06 | SLH-55 | 699bc | 813g | 2546bcd | 1320f | 2083b | 992g | 2027a | 1154d | 2344a | 1160e | 1514 |
| GN07 | BH-225 | 603cd | 2225bcd | 2329de | 2779b | 2174b | 2060ef | 1758ab | 1686bc | 2465a | 1920bc | 2000 |
| GN08 | UAM-20 | 1034a | 1818f | 2559bcd | 2753b | 2221b | 2804b | 1417bcd | 1614bc | 2456a | 1520d | 2020 |
| GN09 | FH-498 | 555d | 2272bc | 2777ab | 2703b | 1824c | 1767f | 1202cd | 1404cd | 2467a | 1740cd | 1871 |
| GN10 | Weal-AG-11 | 609cd | 1890ef | 2912a | 2139d | 2147b | 2763bc | 1830ab | 1674bc | 2376a | 1860c | 2020 |
| Environment mean | 716 | 2019 | 2541 | 2472 | 2195 | 2319 | 1582 | 1630 | 2369 | 1758 | ||
| CV% | 11.1 | 5.8 | 5.4 | 4.9 | 6.3 | 7.5 | 19.9 | 11.9 | 9.7 | 8.2 | ||
| LSD 5% | 136.6 | 202 | 236 | 208 | 236 | 297 | 539 | 333 | 392 | 248 | ||
Note: Figures labelled with the same alphabets are statistically non-significant at (p≤0.05) and vice versa.
Table 4: Classification of cotton genotypes for mean seed cotton yield (Kgha-1), AMMI stability value (ASV) and genotype selection index (GSI).
| Genotypes | Code | Mean yield | Rank | IPC 1 score | IPC 2 score | ASV | Rank | GSI |
| SLH-Chandni | GN01 | 2181 | 1 | 23.730 | 15.319 | 42.7 | 9 | 10 |
| FH-494 | GN02 | 2127 | 2 | 12.399 | -0.861 | 20.9 | 7 | 9 |
| VH-418 | GN03 | 2038 | 3 | -9.293 | -1.667 | 15.7 | 5 | 8 |
| FH-414 | GN04 | 1923 | 7 | -4.861 | -25.772 | 27.0 | 8 | 15 |
| RH-King-20 | GN05 | 1907 | 8 | 4.119 | -10.332 | 12.4 | 3 | 11 |
| SLH-55 | GN06 | 1514 | 10 | -35.246 | 18.112 | 62.0 | 10 | 20 |
| BH-225 | GN07 | 2000 | 6 | 4.720 | 8.345 | 11.5 | 2 | 8 |
| UAM-20 | GN08 | 2019 | 5 | 1.988 | -7.985 | 8.7 | 1 | 6 |
| FH-498 | GN09 | 1871 | 9 | 8.552 | 13.192 | 19.5 | 6 | 15 |
| Weal-AG-11 | GN10 | 2020 | 4 | -6.110 | -8.350 | 13.2 | 4 | 8 |
Conclusion and Recomsmendations
The cotton genotypes UAM-20, Weal-AG-11, BH-225 and VH-418 were found stable in yield performance in this study. Their release for general cultivation is needed to boost cotton production.
Novelty Statement
The AMMI analysis in cotton based on two-year data for yield stability is rarely reported in the literature. Further, the studied cotton genotypes are newly bred and have never been tested before.
Author’s Contribution
Muhammad Jamil: Conducted the trial and wrote the initial draft.
Hira Saher and Ayesha Bibi: Assisted in the write-up.
Khezir Hayat and Abdul Sattar: Reviewed recent literature.
Umair Faheem: Analyzed the data.
Rana Abdul Hameed Khan: Prepared figures and tables.
Saeed Ahmad: Compiled trial results.
Rao Sohail Ahmad Khan: Proofread the manuscript and added expert input.
Conflict of interest
The authors have declared no conflict of interests.
Figures
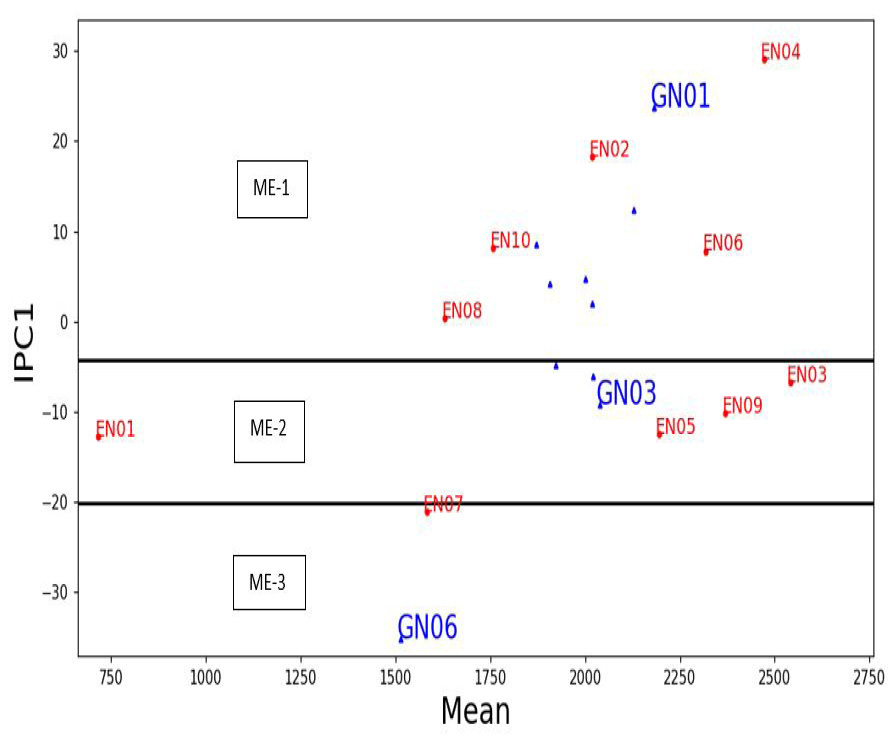
AMMI Biplot showing Seed cotton yield in abscissa and IPC1 scores along ordinate for both environments and genotypes.
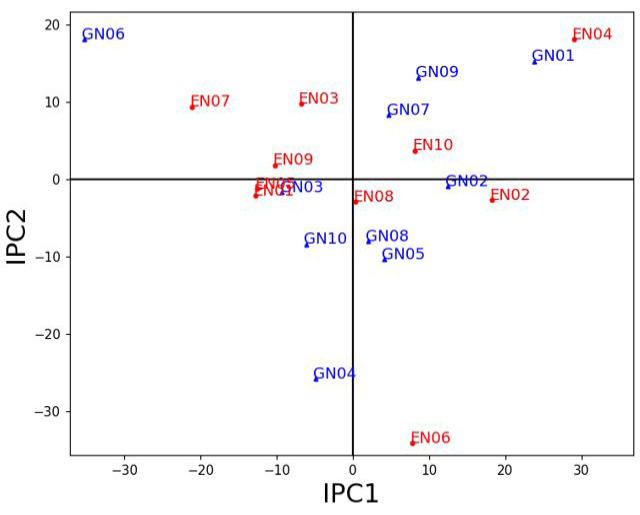
Biplot showing IPC1 and IPC2 score values plotted on opposite axes.
References
- Agahi, K., J. Ahmadi, H.A. Oghan, M.H. Fotokian and S.F. Orang. 2020. Analysis of genotype x environment interaction for seed yield in spring oilseed rape using the AMMI model. Crop Br. Appl. Biotechnol., 20(1): e26502012. https://doi.org/10.1590/1984-70332020v20n1a2[CrossRef]
- Ashraf, J., D. Zuo, Q. Wang, W. Malik, Y. Zhang, M.A. Abid and G. Song. 2018. Recent insights into cotton functional genomics: progress and future perspectives. Plant Biotechnol., 16(3): 699-713. https://doi.org/10.1111/pbi.12856[CrossRef]
- El-Hashash, E.F., S.M. Tarek, A.A. Rehab, and M.A. Tharwat. 2019. Comparison of non-parametric stability statistics for selecting stable and adapted soybean genotypes under different environments. Asian J. Res. Crop Sci., 4(4): 1-16. https://doi.org/10.9734/ajrcs/2019/v4i430080[CrossRef]
- Farshadfar, E., 2008. The AMMI stability value and grain yield were incorporated in a single non-parametric index (GSI) in bread wheat. Pak. J. Biol. Sci., 11: 1791–1796. https://doi.org/10.3923/pjbs.2008.1791.1796[CrossRef]
- Farshadfar, E., R. Mohammadi, M. Aghaee and Z. Visi. 2012. GGE biplot analysis of genotype × environment interaction in wheat-barley disomic addition lines. Aust. J. Crop Sci., 6(6): 1074-1079.
- Gauch, H.G., 2013. A simple protocol for AMMI analysis of yield trials. Crop Sci., 53: 1860-1869. https://doi.org/10.2135/cropsci2013.04.0241[CrossRef]
- Giridhar, K., S.S. Kumari, C. Sarada and L. Naram. 2016. Stability for seed yield in ajwain based on a genotype selection index. Indian J. Agric. Res., 50(3): 244-248. https://doi.org/10.18805/ijare.v50i3.10745[CrossRef]
- Purchase, J.L., 1997. Parametric analysis to describe G × E interaction and yield stability in winter wheat. Ph. D thesis. Depart. of Agron. Fac. of Agric., Uni. of the Orange Free State, Bloemfontein, South Africa.
- Rehman, H.U., U. Farooq, M.A. Bhutta, S. Ahmad, M. Akram, M.R. Shahid, H. Hussnain, M. Shahid, M.M. Iqbal, A. Raza and M. Iqbal. 2022. Genetic variability and performance of cotton (Gossypium hirsutum L.) genotypes for yield-related agro-morphologic and fibre quality traits under water deficit natural environment. Sarhad J. Agric., 38(2): 657-668. https://doi.org/10.17582/journal.sja/2022/38.2.657.668[Full text][CrossRef]
- Riaz, M., M. Naveed, J. Farooq, A. Farooq, A. Mahmood, C. Rafiq, M. Nadeem and A. Sadiq. 2013. AMMI analysis for stability, adaptability and GE interaction studies in cotton (Gossypium hirsutum L.). J. Anim. Plant Sci., 23(3): 865-871.
- Sharifi, P., A. Hashem, E. Rahman, M. Ali and A. Abouzar. 2017. Evaluation of genotype × environment interaction in rice based on AMMI model in Iran. Rice Sci., 24: 173-180. https://doi.org/10.1016/j.rsci.2017.02.001[CrossRef]
- Sial, K.B., A.D. Kalhoro, M.Z. Ahsan, M.S. Mojidano, A.W. Soomro, R.Q. Hashmi and A. Kerio. 2014. Performance of different upland cotton varieties under the climatic condition of the central zone of Sindh. Am. Eurasian J. Agric. Environ. Sci., 14: 1447–1449.
- Steel, R.G.D., J.H. Torrie and D.A. Dickey. 1997. Principles and procedure of statistics: A biometrical approach 3rd ed. McGraw-Hill Book Co., New York.
- Sumathi, P., M. Govindaraj and P. Govintharaj. 2017. Identifying promising pearl millet hybrids using AMMI and clustering models. Int. J. Curr. Microbiol. Appl. Sci., 6(2): 1348-1359. https://doi.org/10.20546/ijcmas.2017.602.153[CrossRef]
- Workie, A., H. Zeleke and Y. Dessalegn. 2013. Genotype X environment interaction of maize (Zea mays L.) across northwestern Ethiopia. J. Pl. Breed. Crop Sci., 5(9): 171-181. https://doi.org/10.5897/JPBCS2013.0406[CrossRef]
- Yayis, R., A. Bekele and Y. Goa. 2014. GGE and AMMI biplot analysis for field pea yield stability in SNNPR state, Ethiopia. Int. J. Sustain. Agric. Res., 1(1): 28-38.
- Zare, M., 2012. Evaluation of drought tolerance indices for the selection of Iranian barley (Hordeum vulgare) Cultivars. Afr. J. Biotechnol., 11(4): 975-981. https://doi.org/10.5897/AJB12.2127[CrossRef]
- Zubair, M., L.H. Akhtar, R. Minhas, M.S.J. Bukhari, S. Hussain, M. Rehman, M.I. Akram, R. Ullah and K. Shabir. 2021. The performance of potential wheat genotypes across diverse environments of Pakistan. Pak. J. Agric. Sci., 58: 1769-1775. https://doi.org/10.21162/PAKJAS/21.1226[CrossRef]
Services
Article usage statistics
Loading…