
The silkworm, Bombyx mori, an economically important insect, is also used as a model insect for investigation. However, pesticide exposure often causes huge economic losses to the sericulture. The fat body is an important intermediate metabolic tissue, which is involved in detoxification in insects. In this study, high-throughput transcriptome sequencing was performed to investigate the gene expression differences between two silkworm strains with different susceptibility after exposure to fenvalerate. The results showed that a total of 2363 differentially expressed genes were detected in the Lan5 DGE library and 1611 were detected in the Mysore DGE library, respectively. The possible functions of all DEGs were determined using the gene ontology (GO) classification system. Pathway enrichment analysis was carried out using the Kyoto Encyclopedia of Genes and Genomes (KEGG) database. Furthermore, some selected differentially expressed genes (DEGs) were verified by qRT-PCR. Our results can facilitate the overall understanding of the mechanism of silkworm’s tolerance to pesticides and provide a new control strategy of Lepidoptera pests.
Research Article · Volume 54, Issue 4, 24 April 2022 · Open Access
Transcriptome Analysis in the Fat Body of Two Silkworm (Bombyx mori) Strains with Different Susceptibility to Fenvalerate
· · · · ·
Affiliations & Notes ⌄
- 1School of Biotechnology, Jiangsu University of Science and Technology, Zhenjiang, No. 2 Mengxi Road, Jiangsu 212018, China 2The Sericultural Research Institute, Chinese Academy of Agricultural Sciences, Zhenjiang, Jiangsu 212018, China. Guo-dong Zhao, He-ying Qian and Yi-ling Zhang contributed equally to this work. * Corresponding author: sdgdzhao@126.com, xaysri@126.com
Article Info ⌄
- Journal:
- Pakistan Journal of Zoology
- Published:
- 24 April 2022

From the article
- This study is the first report systematically analyzing the expression profile and regulation of genes in fat body of two silkworm strains with different susceptibility after exposure to fenvalerate.
- In this study, fenvalerate-induced up-regulation of many cytochrome P450, such as Cyp305b1, Cyp6ab4, Cyp9a21 and Cyp18a1, were observed in the fat body of both two silkworm strains, which suggested their role in detoxification.
- We suppose that these four detoxification genes may be involved in the susceptibility differences between two silkworm strains.
- In our study, the transcription levels of glv3, Mor and PGRP-S1 were observed down-regulated after exposure to fenvalerate in both two silkworm strains.
Selected from the article's own text.
Abstract
INTRODUCTION
Sericulture is the main economic source of farmers in many developing countries such as China and India . The total silk production of China accounts for 80% of the world’s total . However, to date, pesticide poisoning and various diseases still cause great damage to the sericulture ; . Pyrethroid pesticide fenvalerate is an efficient and low toxic insecticide commonly used in mulberry fields in China . Pesticide pollution is becoming more and more serious due to the emergence of insecticide resistance . Silkworm is a non target insect that is extremely susceptible to insecticides in the ecological environment . Pesticide exposure may affect growth, reproduction and cocoon, which will bring huge economic losses to the sericulture .
As a main silk-producing insect, the silkworm is an economically important insect, and it is also used as a model insect for investigating the genome and molecular genetics of the Lepidoptera order . The fat body is an important intermediate metabolic tissue in insects . As reflected by the transcriptome pattern observed from Drosophila melanogaster and B. mori, the fat body is a multifunctional tissue in insect ; . It plays a crucial role in nutrient synthesis, storage and substance metabolism, and participates in the metabolism and detoxification of toxic substanc . However, to date, the impact of fenvalerate exposure on the transcriptome pattern in the fat body of silkworms with different pesticide susceptibility has not been studied and reported. We tested 198 silkworm strains by bioassay for their fenvalerate tolerance and found that a notable difference exists in different strains (data unpublished). Of those silkworm strains tested, Lan5, a silkworm strain from Zhejiang province of China, is susceptible to fenvalerate and Mysore, a silkworm strain from India, is tolerant to fenvalerate.
High-throughput transcriptome sequencing is an efficient, accurate and economic technique to obtain new information about the expression of whole transcriptome ; . Using this technique, differentially expressed genes and critical target pathways in multiple samples can be analyzed conveniently and accurately . In this study, a transcriptome sequencing system was employed to examine differentially expressed genes in the fat body of two strains of silkworms with different susceptibility after exposure to fenvalerate. Tag annotation, gene ontology (GO) and KEGG pathway analyses were performed. The differentially expressed genes were verified using real-time PCR at the transcriptional level. These results can provide a reference for further research on the mechanism of silkworm’s tolerance to pesticides and the new control strategy of Lepidoptera pests.
MATERIALS AND METHODS
Preparation of fenvalerate solution
According to the result of pre-experiment, fenvalerate solution (Sigma-Aldrich Trading Co, Ltd, USA) was diluted to a 0.02 mg/L concentration, which is less than LC50 for 24 h . Mulberry leaves were immersed in the solutions for 10 s, and allowed to dry naturally, before being fed the fifth instar silkworms on the second day for three times a day.
Insects and tissue dissection
Domesticated silkworm strain Lan5 (susceptible strain) and Mysore (tolerant strain) were provided by the National Center for Silkworm Genetic Resources Preservation of the Chinese Academy of Agricultural Sciences. They were reared at standard temperature under a photoperiod of 12 h of light and 12 h of dark. At 24 h after feeding with fenvalerate solution coated leaves, the larvae and the unfed control larvae were dissected. The fat bodies of ten larvae were collected and rinsed three times in diethylpyocarbonate (DEPC) treated double distilled H2O. All samples were stored at -70 °C until use. Each treatment was undertaken in triplicate.
RNA extraction
For Illumina sequencing, total RNA was isolated from the fenvalerate-exposed fat body as well as the control fat body by using TRIzol reagent (Invitrogen, USA) according to the manufacturer’s protocol. To remove any residual DNA, samples were pretreated with RNase-free DNase I (TaKaRa) for 30 min at 37°C. The quality of RNA was assessed by formaldehyde agarose gel electrophoresis and was quantitated spectrophotometrically.
Library preparation and illumina sequencing
The RNA-seq libraries were prepared using TruSeqTM DNA Sample Preparation Kit-Set A (Illumina, San Diego, USA) following the manufacturer’s protocol (Illumina, San Diego, CA). Approximately 20 μg of total RNA from the fenvalerate-treated fat body or the wild fat body was used to isolate mRNA using Sera-mag Magnetic Oligo (dT) Beads (Illumina). To avoid cDNA synthesizing bias by priming, the purified mRNA was fragmented into small pieces (100-400 bp) using divalent cations at 94°C for 5 minutes. The double-stranded cDNA was first synthesized using the SuperScript Double-Stranded cDNA Synthesis kit (Invitrogen, Camarillo, CA) with random hexamer (N6) primers (Illumina). The libraries were sequenced using Illumina Highseq 2000 platform (Illumina, San Diego, USA) according to the manufacturer’s instructions.
Data analysis
The raw reads were filtered to remove low-quality sequences, the generated clean reads were mapped directly into deposited reference gene sequences generated from SilkDB v2.0 database (ftp://silkdb.org/pub/current/Gene/) using TopHat 2.0.6 software . The differentially expressed genes were identified at a Q value (corrected P value of T test with False discovery rate) of 0.05 . With regard to a gene which is only expressed in one sample, the differentially expressed gene was identified at a fold-change value of 1 (FC-test). Software Heatmap was used to plot the heatmap of differentially expressed genes based on the log10 of P value of two groups, ±10 was set as the extreme value.
Functional annotations
The possible functions of all differentially expressed genes were determined using the gene ontology (GO) classification system (http://www.geneontology.org/). GO term with a corrected P value ≤ 0.05 was designated as significantly enriched term in differentially expressed genes. WEGO (Web Gene Ontology Annotation Plot) software was used for visualizing, comparing and plotting GO annotation results . Pathway enrichment analysis was carried out using the Kyoto Encyclopedia of Genes and Genomes (KEGG) database (http://www.genome.jp/kegg/). Pathway with a corrected P value ≤ 0.05 was designated as significantly enriched pathways in differentially expressed genes.
Quantitative real-time PCR
To confirm the RNA-Seq data, the quantitative real-time PCR was carried out with a real-time reverse transcription-PCR system (ABI 7300, Applied Biosystems, USA) with SYBR green. Total RNA was extracted from the fat body of both the treated and control larvae after 24 h using Trizol reagent (Takara). First-strand cDNA was synthesized with M-MLV Reverse transcriptase and an oligo (dT) primer. A total of 20 μl volume of real-time PCR reaction solution contained 0.2 µg cDNA, 5 pmol of each primer, and 10 μL of SYBR Green Real-time PCR Master Mix. PCR reactions were run in triplicates with 2 biological replicates with thermal cycling parameters at 95°C for 10 min followed by 40 cycles at 95°C for 30 sec, 60°C for 1 min according to the manufacturer’s protocol. The specific primers of 20 genes were designed based on the cDNA sequences (Table I). The housekeeping gene of B. mori actin3 was used as an internal control for the normalization. The relative expression level of these genes was estimated according to the 2-ΔΔCt method . All the samples were measured independently three times.
RESULTS
Global statistics of RNA-Seq data
In our project, we sequenced 12 samples on Illumina HiSeq Platform in total and generated about 6.64 Gb per sample. The average genome mapping rate is 79.93% and the average gene mapping rate is 80.09%. 14,194 genes were identified in which 13,126 of them are known genes and 1,096 of them are novel genes. 11,666 novel transcipts were identified in which 5,776 of them are previously unknown splicing event for known genes, 1,096 of them are novel coding transcripts without any known features, and the remaining 4,794 are long noncoding RNA.
Identification of DEGs after fenvalerate treated in two silkworm varieties
The differentially expressed genes in the infected fat body samples were identified by FDR≤0.001 and |log2 ratio|≥1. In the susceptible variety Lan5 DEG class, a total of 2363 genes were found with 490 up-regulated and 1873 down-regulated. In the tolerant variety Mysore DEG class, a total of 1611 genes were found with 746 up-regulated and 865 down-regulated.
GO analysis of differentially expressed genes
Gene ontology (GO) assignments were used to understand the functions of these differentially expressed genes revealed by transcriptomics analysis. The DEGs were termed by GO ontology into three categories, namely cellular component, molecular function and biological process.
Table I. Primer pairs for Real-time PCR.
| Gene name | F primer sequence (5’-3’) | R primer sequence (5’-3’) |
| Cyp305b1 | TGGCAGCAGCTCAATTGTTC | CGTAGACGACGACCACTAATTC |
| Cyp4l6 | CAAAGCGGTAATGGGAAAC | AGGTGGAGACTACATCGCAAAT |
| Cyp6ab4 | AACTTGCGTTCCATCCTG | AGCGACGGAAACATTCTC |
| Cyp6ae22 | GAATTGTTGCCGAGTCTTCG | TTGCGAGTGCTTTTCCATG |
| Cyp6b29 | CGGAGCAGGATATTCATACG | TGACAGCCTGTCGATTTC |
| Cyp9a21 | AGAGAAATGCGGAAAATC | ACCAGCAACGAAGAAAAG |
| Cyp18a1 | TTGGAAATGGCTGAAGGTG | GCCGACATGACGAAGATGAG |
| GSTo4 | ATTGAGGTGGAAGATGGA | AAATATAGGCTCGGAAGC |
| GSTs2 | GCCGCATCGGTCCACTAC | TGTTCTTCGTCAGTATCTCATT |
| CarE5A | GCAGCATCAGTTTCGTTT | TTCTCGGCACTCTTGTCA |
| Hsp20.4 | TGATCTTCTTAGTGTCGC | TTTCTTCTCTTCGTGCTT |
| Hsp20.8 | CCTGTCCAGTGCTCTCCG | CTTCGTGCTTGCCTTCCA |
| Hsp70 | CGTGGCTCCTCTGTCCCT | TCATCGCTCTCTCTCCCT |
| Hsp90 | AAAGTTGAGAAAGTTGTT | GTGGATGTGTCACGTAGA |
| GlcNAcase3 | CATGACTTTCCCCGTTAC | ACCCTGATCCCTCTGTTC |
| UGT40B4 | GGTCATCCAAATCGCACA | TACCGAAGCCACTAAAAA |
| Tret1-like | CTCCGTCGTATCTGGCTT | TGTGTCCCGTTTTCTTCT |
| glv3 | AGAATGGGAGGAGGGAAG | GGCTGAGATGTGGGTGTT |
| Mor | AGGTCTAAGAGCCATCA | ACTACAAAGGGGAAAAC |
| PGRP-S1 | GTCATCGTCCAGCACACA | ACACCTTGCCGTTACCTC |
In the susceptible strain Lan5 DEG class, differentially expressed genes have been categorized into a total of 46 functional groups using the WEGO software. In each of the three main categories of the GO classification, “metabolic process”, “cellular process”, “cell”, “cell part”, “binding”, and “catalytic activity” terms are dominant. In almost all the terms, more down-regulated genes were observed than the up-regulated genes. Some genes related to the immune system process, behavior, locomotion, biological adhesion, cell killing, growth, cell junction and nucleic acid binding transcription factor activity were all down-regulated.
Meanwhile, in the tolerant strain Mysore DEG class, differentially expressed genes have also been categorized into a total of 46 functional groups using the WEGO software. In each of the three main categories of the GO classification, “metabolic process”, “cellular process”, “cell”, “cell part”, “binding” and “catalytic activity” terms are dominant. Interestingly, some genes related to the extracellular region, extracellular region part and cell junction were up regulated, whereas more down regulated genes were observed than the up regulated genes in other terms.
KEGG pathways of differentially expressed genes
In order to further understand the biological functions of the differentially expressed genes, KEGG (http://www.genome.jp/kegg) ontology assignments were used to classify functional annotations of the identified genes. There are six branches for KEGG pathways: Cellular processes, environmental information processing, genetic information processing, human disease, metabolism, and organismal systems. There is a difference between up (down) regulated pathways observed in Mysore compared with Lan5. In Lan5, genes involved in metabolic pathways were the most significantly enriched. In Mysore, 12 metabolism pathways and 10 that were involved in organismal systems were identified.
Determination of differentially expressed genes by qRT-PCR
20 co-regulated differentially expressed genes were verified by using qRT-PCR. The results show that 15 genes were concordant with the DGE libraries, but 3 genes from Lan5 (Cyp6b29, UGT40B4, Mor) and 2 genes from Mysore (Cyp4l6, GSTo4) were non-concordant. Although some differences were observed in the results of qRT-PCR and DGE analysis, the overall regulate trend of most genes was consistent, which indicated that the results of the DGE data were accurate.
Out of these determined genes, 6 genes were up-regulated, 6 genes were down-regulated and 8 genes exhibited opposite trends in the two DGE libraries, and in the 8 genes, 7 genes were down-regulated in Lan5 and up-regulated in Mysore. More of these kinds of genes were detoxification genes such as Cyp6b29, GSTs2 and CarE5A.
DISCUSSION
This study is the first report systematically analyzing the expression profile and regulation of genes in fat body of two silkworm strains with different susceptibility after exposure to fenvalerate. On a genome-wide scale, profiles of transcriptome provided information for deep insights into functional genomics by its ability to interpret the functional elements of the genome, biological pathways, and molecular mechanisms. RNA-Seq used in this study is a recently developed technology which is cost efficient and powerful for the rapid identification and analysis of majority part of the whole transcriptome . In this study, RNA-Seq technology was employed to analyze the transcriptome change in fat body of two silkworm strains after feeding fenvalerate. GO and KEGG analysis were used to classify the functions of DEGs and identify the difference of pathways involved in the fenvalerate regulation.
Fenvalerate-exposed susceptible Lan5 and tolerant Mysore silkworms were subjected to DGE to perform a global analysis of their transcriptomes. The Lan5 silkworms yielded 2363 differentially expressed genes and the Mysore silkworms yielded 1611 differentially expressed genes. Among the 2363 differentially expressed genes in the Lan5 strain, the number of down-regulated genes (1873) was higher than the number of up-regulated genes (490), but more up-regulated genes (746) and less down-regulated genes (865) were detected in the Mysore strain. This difference in the two silkworm strains might be involved in different susceptibility or defense responses to fenvalerate, which is similar to the previous studies . However, the possible mechanism of the susceptibility differences between two silkworm strains and molecular information on these differentially expressed genes still needs to be clarified in our future research.
Many studies showed that the fat body is the major detoxification tissue in B. mori. There are some detoxification enzymes in fat body, such as cytochrome P450s, glutathione-S-transferase and carboxylesterase, which are able to hydrolyze insecticide and eliminate them from silkworm body through metabolism. Cytochrome P450s are a complex and ubiquitous superfamily of heme-containing enzymes that participate in metabolism of exogenous substrates . There are 84 P450s genes in all and 78 of them are functional genes in the silkworm . In this study, fenvalerate-induced up-regulation of many cytochrome P450, such as Cyp305b1, Cyp6ab4, Cyp9a21 and Cyp18a1, were observed in the fat body of both two silkworm strains, which suggested their role in detoxification. At the same time, the expression levels of Cyp4l6 and Cyp6b29 were up-regulated by fenvalerate in the fat body of tolerant Mysore, while down-regulation were observed in susceptible Lan5. On the other hand, GSTo4 and CarE5A showed the similar expression level changes in the fat body of two silkworm strains. We suppose that these four detoxification genes may be involved in the susceptibility differences between two silkworm strains.
As activators of the innate immune system in many organisms, HSPs are a family of proteins that help organisms protect from environmental-induced cellular damage. Wu et al. (2011) observed the up-regulation of several HSPs after BmCPV infection in silkworm. Gu et al. demonstrated that the transcription level of Hsp21.4 was found up-regulated in the fat body after exposure to phoxim for 24 h . In this study, the up-regulations of transcription levels of Hsp20.4 and Hsp20.8 were also found in the fat body of Mysore silkworm after exposure to fenvalerate for 24 h. This result suggested that HSPs may be functionally involved in protecting tissues against injury of fenvalerate.
In B. mori, 6 groups of antimicrobial peptides (AMPs) have been identified and characterized by a BLASTP search from silkworm genome database . AMPs such as moricins, gloverins, and attacins play an important role in eliminating invades. In our study, the transcription levels of glv3, Mor and PGRP-S1 were observed down-regulated after exposure to fenvalerate in both two silkworm strains. Due to the down-regulation of these AMPs, the silkworm larvae may become more susceptible to infection of various microbes.
In conclusion, this is the first report that employed the DGE technique to examine the transcriptomes differences between two silkworm strains after exposure to fenvalerate. The current results can provide a reference for further research on the mechanism of silkworm’s tolerance to pesticides and the new control strategy of Lepidoptera pests.
ACKNOWLEDGEMENTS
This work was supported by the Foundation of Post Scientist in National Sericultural System (Grant No. CARS-22-ZJ0101), the Natural Science Foundation of Jiangsu Province (Grant No. BK20181228), and the Key Research & Development program of Zhenjiang (Grant No. NY2017017).
Statement of conflict of interest
The authors have declared no conflict of interests.
Figures
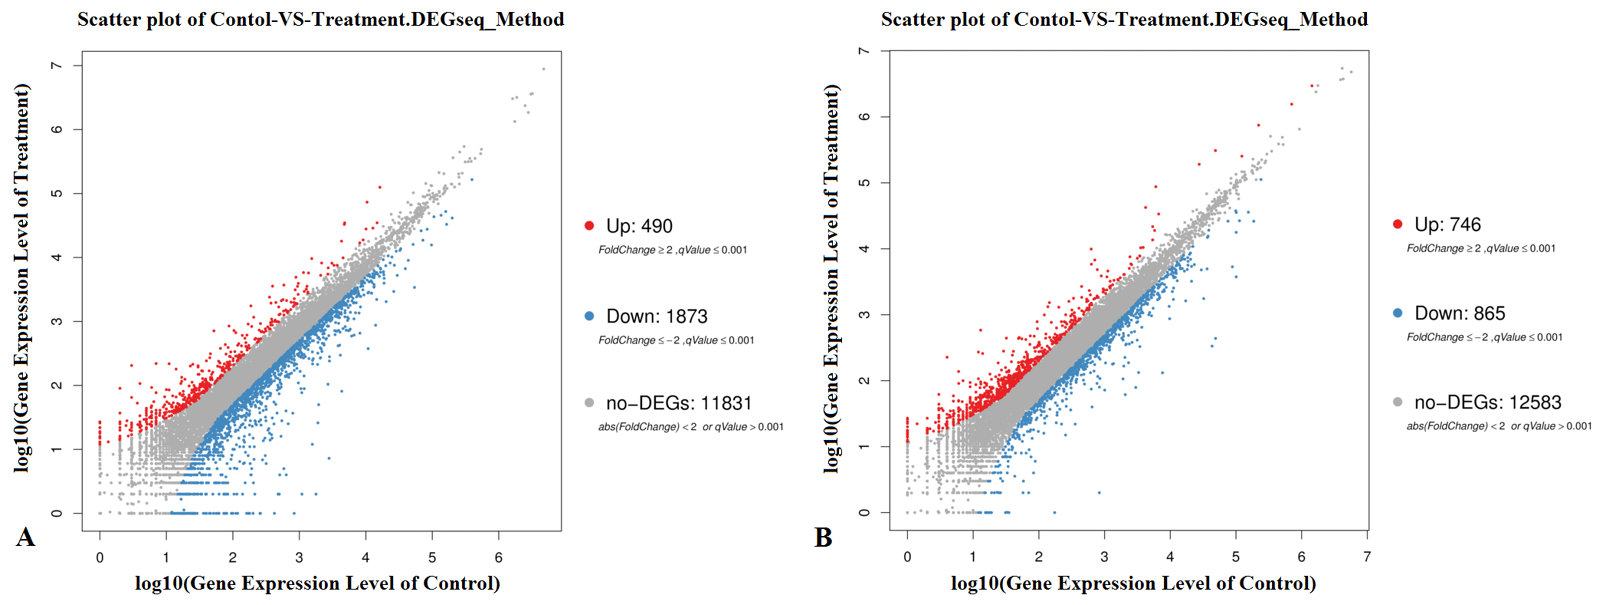
Scatter plot of differentially expressed genes. (A) Lan5; (B) Mysore. X and Y axis represents log10 transformed gene expression level, red color represents the up-regulated genes, blue color represents the down-regulated genes, gray color represents the non-DEGs.
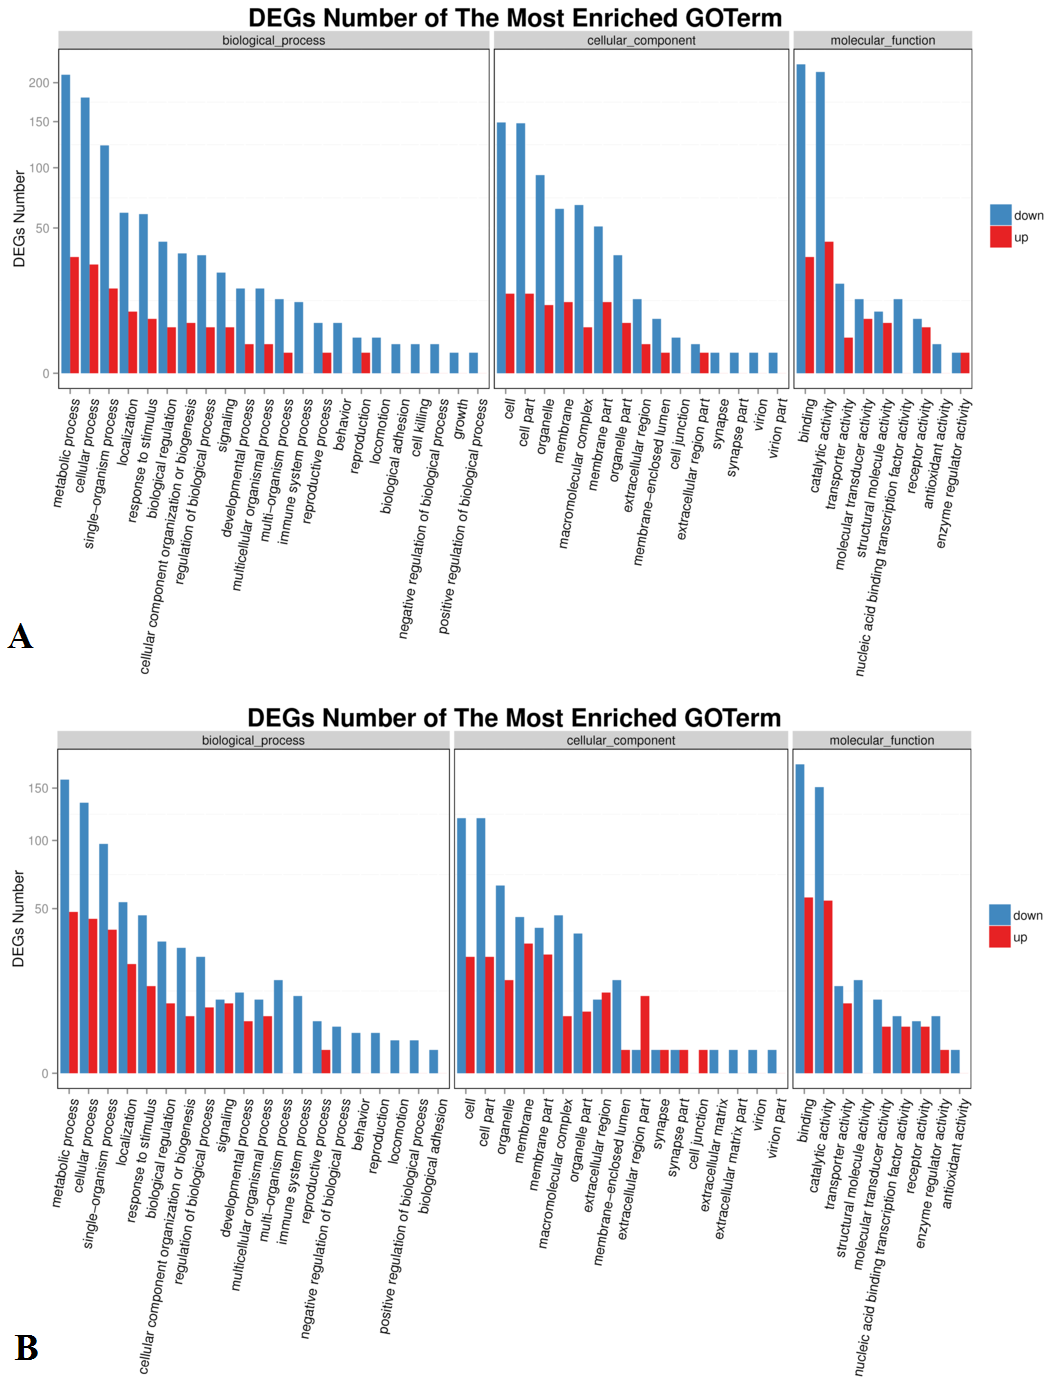
GO classification of up-regulated and down-regulated genes. (A) Lan5; (B) Mysore. X axis represents GO term. Y axis represents the amount of up/down-regulated genes in a category.
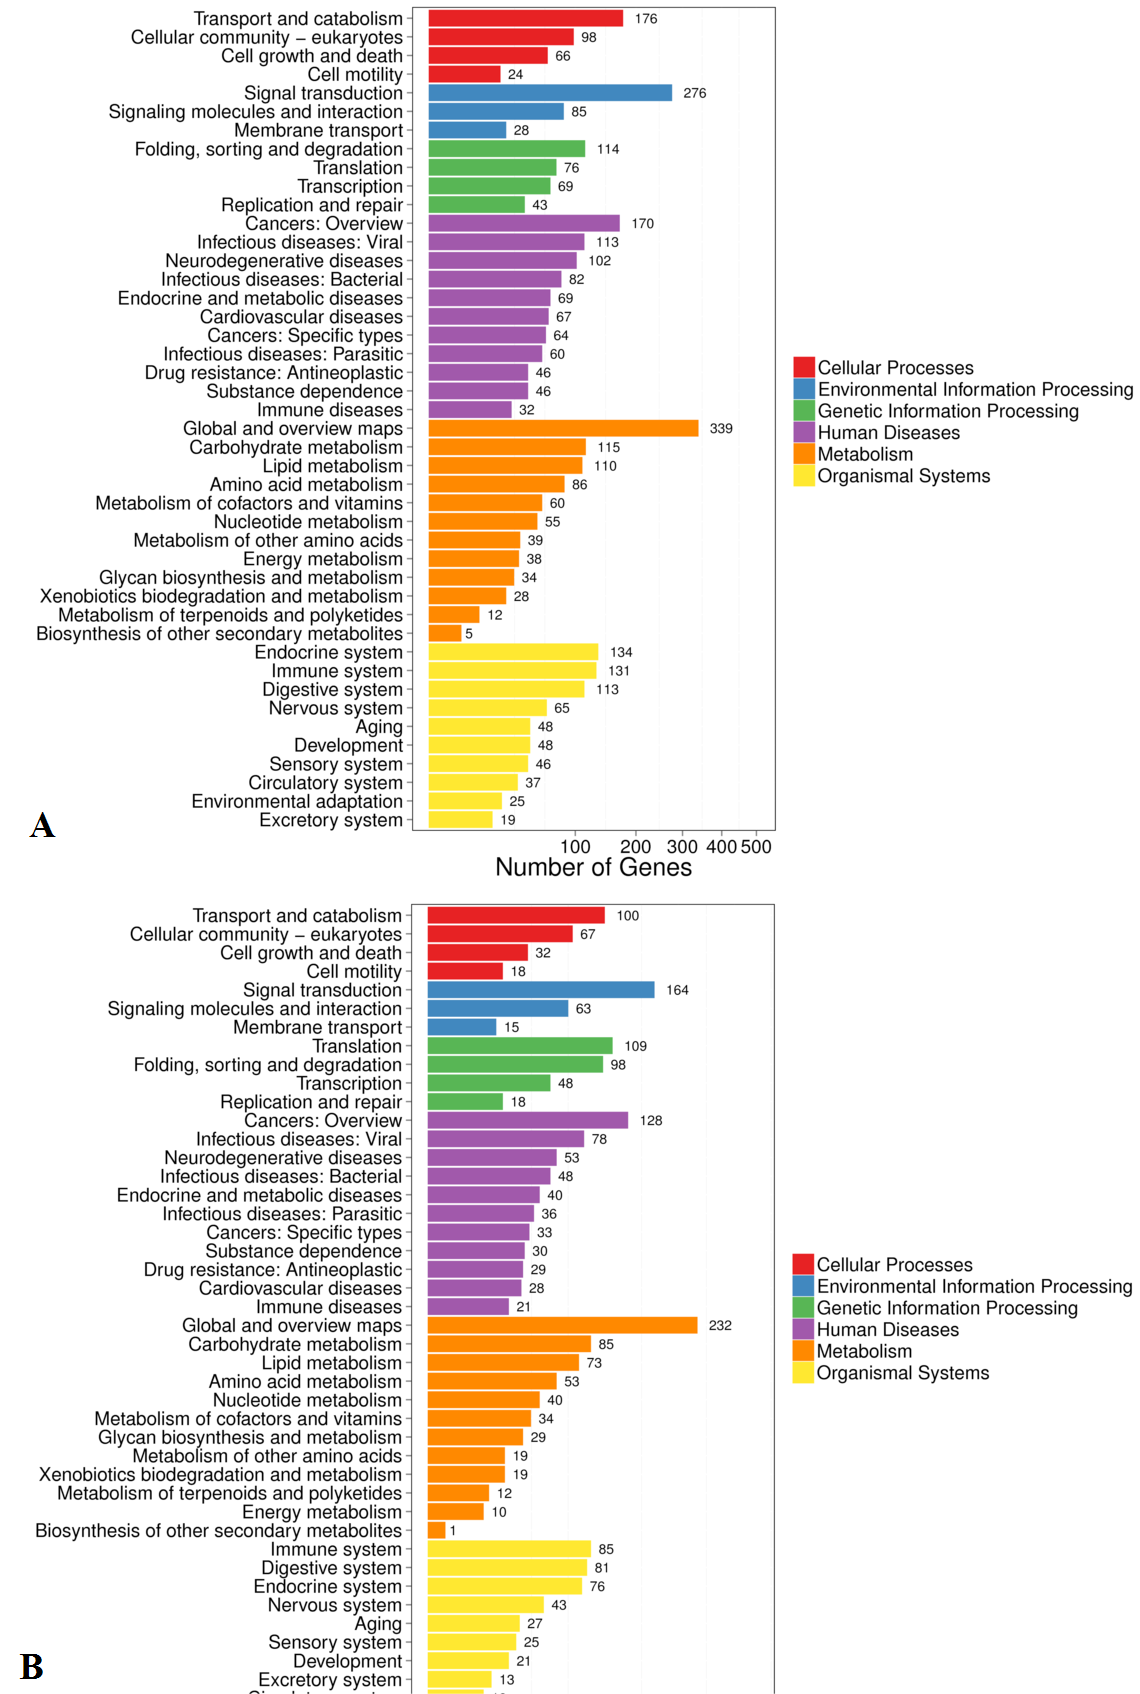
Pathway classification of DEGs. (A) Lan5; (B) Mysore. X axis represents number of DEG. Y axis represents functional classification of KEGG. There are six branches for KEGG pathways: cellular processes, environmental information processing, genetic information processing, human disease (for animals only), metabolism and organismal systems.
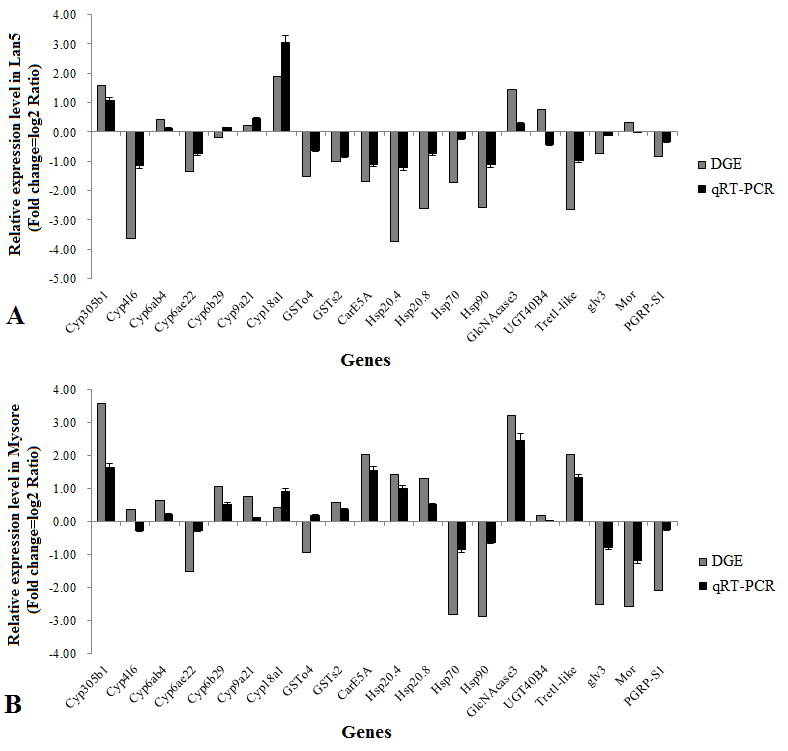
Verification of transcriptomics results of DEGs by qPCR. (A) Lan5; (B) Mysore. The y-axis indicates the relative expression level of gene mRNA transcripts (fold change=log2 ratio). The x-axis indicates the selected genes. Vertical bars represent the mean±SE (n=3).
References
- Cheng, T.C., Zhao, P., Liu, C., Xu, P.Z., Gao, Z.H., Xia, Q.Y. and Xiang, Z.H., 2006. Structures, regulatory regions, and inductive expression patterns of antimicrobial peptide genes in the silkworm Bombyx mori. Genomics, 87: 356-365. https://doi.org/10.1016/j.ygeno.2005.11.018[CrossRef]
- Fournier, D. and Mutero, A., 1994. Modification of acetylcholinesterase as s mechanism of resistance to insecticides. Comp. Biochem. Physiol., 108: 19-31. https://doi.org/10.1016/1367-8280(94)90084-1[CrossRef]
- Gao, K., Deng, X.Y., Qian, H.Y., Qin, G.X., Hou, C.X. and Guo, X.J., 2014. Cloning, Cytoplasmic polyhedrosis virus-induced differential gene expression in two silkworm strains of different susceptibility. Gene, 539: 230-237. https://doi.org/10.1016/j.gene.2014.01.073[CrossRef]
- Gu, Z.Y., Li, F.C., Wang, B.B., Xu, K.Z., Ni, M., Zhang, H., Shen, W.D. and Li, B., 2015. Differentially expressed genes in the fat body of Bombyx mori in response to phoxim insecticide. Pestic. Biochem. Physiol., 117: 47-53. https://doi.org/10.1016/j.pestbp.2014.10.007[CrossRef]
- Gu, Z.Y., Zhou, Y.J., Xie, Y., Li, F.C., Ma, L., Sun, S.S., Wu, Y., Wang, B.B., Wang, J.M., Hong, F.S., Shen, W.D. and Li, B., 2014. The adverse effects of phoxim exposure in the midgut of silkworm, Bombyx mori. Chemosphere, 96: 33-38. https://doi.org/10.1016/j.chemosphere.2013.06.089[CrossRef]
- Hu, J.S., Li, F.C., Xu, K.Z., Ni, M., Wang, B.B., Tian, J.H., Li, Y.Y., Shen, W.D. and Li, B., 2016. Mechanisms of TiO2 NPs-induced phoxim metabolism in silkworm (Bombyx mori) fat body. Pestic. Biochem. Physiol., 129: 89-94. https://doi.org/10.1016/j.pestbp.2015.11.004[CrossRef]
- Kanehisa, M. and Goto, S., 2000. KEGG: Kyoto encyclopedia of genes and genomes. Nucl. Acids Res., 27: 29-34. https://doi.org/10.1093/nar/27.1.29[CrossRef]
- Li, B., Wang, Y.H., Liu, H.T., Xu, Y.X., Wei, W.Z., Chen, Y.H. and Shen, W.D., 2010. Resistance comparison of domesticated silkworm (Bombyx mori L.) and wild silkworm (Bombyx mandarina M.) to phoxim insecticide. Afr. J. Biotechnol., 9: 1771-1775. https://doi.org/10.5897/AJB10.1955[CrossRef]
- Li, B., Zhang, H., Ni, M., Wang, B.B., Li, F.C., Xu, K.Z., Shen, W.D., Xia, Q.Y. and Zhao, P., 2014. Identification and characterization of six cytochrome P450 genes belonging to CYP4 and CYP6 gene families in the silkworm, Bombyx mori. Mol. Biol. Rep., 41: 5135-5146. https://doi.org/10.1007/s11033-014-3379-z[CrossRef]
- Lindquist, S. and Craig, E.A., 1998. The heat-shock proteins. Annu. Rev. Genet., 22: 631-677. https://doi.org/10.1146/annurev.ge.22.120188.003215[CrossRef]
- Livak, K.J. and Schmittgen, T.D., 2001. Analysis of relative gene expression data using real-time quantitative PCR and the 2 (-Delta Delta C (T)) method. Methods, 25: 402-408. https://doi.org/10.1006/meth.2001.1262[CrossRef]
- Marguerat, S. and Bähler, J., 2010. RNA-seq: From technology to biology. Cell. Mol. Life Sci., 67: 569-579. https://doi.org/10.1007/s00018-009-0180-6[CrossRef]
- Nath, B.S., Suresh, A., Varma, B.M. and Kumar, R.P.S., 1997. Changes in protein metabolism in hemolymph and fat body of the silkworm, Bombyx mori (Lepidoptera: Bombycidae) in response to organophosphorus insecticides toxicity. Ecotoxicol. Environ. Saf., 36: 169-173. https://doi.org/10.1006/eesa.1996.1504[CrossRef]
- Peng, G.D., Wang, J.M., Ma, L., Wang, Y.H., Cao, Y.Q., Shen, W.D. and Li, B., 2011. Transcriptional characteristics of acetylcholinesterase genes in domestic silkworms (Bombyx mori) exposed to phoxim. Pestic. Biochem. Physiol., 101: 154-158. https://doi.org/10.1016/j.pestbp.2011.08.010[CrossRef]
- Qin, Y.F., Fang, H.M., Tian, Q.N., Bao, Z.X., Lu, P., Zhao, J.M. and Chen, S.J., 2011. Transcriptome profiling and digital gene expression by deep-sequencing in normal/regenerative tissues of planarian Dugesia japonica. Genomics, 97: 364-371. https://doi.org/10.1016/j.ygeno.2011.02.002[CrossRef]
- Shi, Y., Wang, H., Liu, Z., Wu, S., Yang, Y., Feyereisen, R., Heckel, D.G. and Wu, Y., 2018. Phylogenetic and functional characterization of ten P450 genes from the Cyp6ae subfamily of Helicoverpa armigera involved in xenobiotic metabolism. Insect Biochem. mol. Biol., 93: 79-91. https://doi.org/10.1016/j.ibmb.2017.12.006[CrossRef]
- Snyder, M., 2009. RNA-Seq: A revolutionary tool for transcriptomics. Nat. Rev. Genet., 10: 57-63. https://doi.org/10.1038/nrg2484[CrossRef]
- Surget-Groba, Y. and Montoya-Burgos, J.I., 2010. Optimization of de novo transcriptome assembly from next-generation sequencing data. Genome Res., 20: 1432-1440. https://doi.org/10.1101/gr.103846.109[CrossRef]
- Tian, J.H., Hu, J.S., Li, F.C., Ni, M., Li, Y.Y., Wang, B.B., Xu, K.Z., Shen, W.D. and Li, B., 2016. Effects of TiO2 nanoparticles on nutrition metabolism in silkworm fat body. Biol. Open, 5: 764-769. https://doi.org/10.1242/bio.015610[CrossRef]
- Tian, J.H., Xue, B., Hu, J.H., Li, J.X., Cheng, X.Y., Hu, J.S., Li, F.C., Chen, Y.H. and Li, B., 2017. Exogenous substances regulate silkworm fat body protein synthesis through MAPK and PI3K/Akt signaling pathways. Chemosphere, 171: 202-207. https://doi.org/10.1016/j.chemosphere.2016.12.080[CrossRef]
- Tian, K., Liu, D., Yuan, Y.Y., Li, M. and Qiu, X.H., 2017. Cyp6B6 is involved in esfenvalerate detoxification in the polyphagous lepidopteran pest, Helicoverpa armigera. Pestic. Biochem. Physiol., 138: 51-56. https://doi.org/10.1016/j.pestbp.2017.02.006[CrossRef]
- Trapnell, C., Williams, B.A., Pertea, G., Mortazavi, A., Kwan, G., van Baren, M.J., Salzberg, S.L., Wold, B.J. and Pachter, L., 2010. Transcript assembly and quantification by RNA-Seq reveals unannotated transcripts and isoform switching during cell differentiation. Nat. Biotechnol., 28: 511-515. https://doi.org/10.1038/nbt.1621[CrossRef]
- Wang, L., Feng, Z., Wang, X., Wang, X. and Zhang, X., 2010. DEGseq: An R package for identifying differentially expressed genes from RNA-seq data. Bioinformatics, 26: 136-138. https://doi.org/10.1093/bioinformatics/btp612[CrossRef]
- Wang, Y.H., Gu, Z.Y., Wang, J.M., Sun, S.S., Wang, B.B., Jin, Y.Q., Shen, W.D. and Li, B., 2013. Changes in the activity and the expression of detoxification enzymes in silkworms (Bombyx mori) after phoxim feeding. Pestic. Biochem. Physiol., 105: 13-17. https://doi.org/10.1016/j.pestbp.2012.11.001[CrossRef]
- Wang, Y.H., Wang, J.M., Peng, G.D., Sun, B.X., Li, B. and Shen, W.D., 2011. Gene expression analysis from phoxim-induced domesticated silkworm (Bombyx mori) by whole-genome oligonucleotide microarray. Pestic. Biochem. Physiol., 101: 48-52. https://doi.org/10.1016/j.pestbp.2011.07.003[CrossRef]
- Wang, Z., Mark, G. and Michael, S., 2009. RNA-Seq: a revolutionary tool for transcriptomics. Nat. Rev. Genet., 10: 57-63. https://doi.org/10.1038/nrg2484[CrossRef]
- Wu, P., Wang, X., Qin, G.X., Liu, T., Jiang, Y.F., Li, M.W. and Guo, X.J., 2011. Microarray analysis of the gene expression profile in the midgut of silkworm infected with cytoplasmic polyhedrosis virus. Mol. Biol. Rep., 38: 333-341. https://doi.org/10.1007/s11033-010-0112-4[CrossRef]
- Yamamoto, K., Ichinose, H., Aso, Y. and Fujii, H., 2010. Expression analysis of cytochrome P450s in the silkmoth, Bombyx mori. Pestic. Biochem. Physiol., 97: 1-6. https://doi.org/10.1016/j.pestbp.2009.11.006[CrossRef]
- Ye, J., Fang, L., Zheng, H., Zhang, Y., Chen, J., Zhang, Z., Wang, J., Li, S., Li, R., Bolund, L. and Wang, J., 2006. WEGO: A web tool for plotting GO annotations. Nucl. Acids Res., 34: 293-297. https://doi.org/10.1093/nar/gkl031[CrossRef]
- Zhao, G.D., Tang, J., Yu, T.T., Zhou, K.Y., Hao, C.F., Li, Y.X., Qian, H.Y., Li, G. and Xu, A.Y., 2018. Effect of trace pyrethroid pesticides on transcription levels of P450 9 family genes in silkworm, Bombyx mori. Sci. Sericul., 44: 537-543.
- Zhao, G.D., Zhang, Y.L., Gao, R.N., Wang, R.X., Zhang, T., Li, B., Zhang, Y., Lu, C.D., Shen, W.D. and Wei, Z.G., 2011a. Quantitative analysis of expression of six BmGST genes in silkworm, Bombyx mori. Mol. Biol. Rep., 38: 4855-4861. https://doi.org/10.1007/s11033-010-0626-9[CrossRef]
- Zhao, G.D., Zhao, S.S., Gao, R.N., Wang, R.X., Zhang, T., Ding, H., Li, B., Lu, C.D., Shen, W.D. and Wei, Z.G., 2011b. Transcription profiling of eight cytochrome P450s potentially involved in xenobiotic metabolism in the silkworm, Bombyx mori. Pestic. Biochem. Physiol., 100: 251-255. https://doi.org/10.1016/j.pestbp.2011.04.009[CrossRef]
Services
Article usage statistics
Loading…