
Scavenger receptor class B type I protein (SCARB1) plays an essential role in cholesterol homeostasis. The effect of the polymorphisms in the gene have varying influences on lipid levels and development of cardiovascular disease (CVD) in different populations. In this study, we investigated the association of rs5888 polymorphism with serum lipid levels and CVD risk in an Indian population. A total of 412 samples which included 148 myocardial infarction survivors, 162 Normolipidemic healthy controls and 102 patients with hypercholesterolemia in a Indian Tamilian population were included in the study. Genotyping of SCARB1 genetic polymorphisms was done by PCR-RFLP combined with gel electrophoresis. The genotype distribution in the population was found to be consistent with Hardy Weinberg equilibrium. Through logistic regression analysis, it was observed that, in Tamil population the CC and CT genotype carriers have higher odds of developing myocardial infarction (OR – 1.64 and 2.04 respectively) and for developing hypercholesterolemia (OR – 2.02 and 2.13 respectively). In the total population, the CC genotype carriers have significantly lower HDL-C (0.82 ± 0.04 mmol/L Vs, 0.9 ± 0.05 mmol/L (p<0.05)) and higher LDL-C (3.7 ± 0.2 mmol/L Vs 3.5 ± 0.14 mmol/L, (p<0.05)) than TT carriers. The TT carriers have lower risk of developing MI and Hypercholesterolemia with OR – 0.6 and 0.49, respectively. SCARB1 rs5888 polymorphism is associated with the development of myocardial infarction and CC genotype influences LDL and HDL cholesterol levels significantly, whereas TT genotype has atheroprotective function in the Indian Tamil population
Research Article · Volume 49, Issue 3, 14 May 2017 · Open Access
SCARB1 rs5888 c.1050C>T Polymorphism and the Risk of Hypercholesterolemia and Myocardial Infarction in Indian Tamil Population
· · · · ·
Affiliations & Notes ⌄
- 1Department of Genetic Engineering, SRM University, Chennai 603203, India 2Department of Clinical Pharmacology, SRM Medical College Hospital, Chennai, India 3Department of Cardiology, SRM Medical College Hospital, Chennai, India , * Corresponding author: adevipradeep@gmail.com
Article Info ⌄
- Journal:
- Pakistan Journal of Zoology
- Published:
- 14 May 2017

From the article
- Thus the results proves that the presence of C allele either in homozygous or in heterozygous condition has higher odds of developing MI and hypercholesterolemia in South Indian Tamil population.
- This study demonstrated that in South Indian Tamil population SCARB1 rs5888 polymorphism is associated with Hypercholesterolemia and MI.
- C allele is identified as risk allele in the population and CT as well as CC genotypes are associated with increased risk of causing hypercholesterolemia and MI.
- Although the study has limitation such as relatively small sample size, this is the very first study to report the association of SCARB1 polymorphism in MI and Hypercholesterolemia in Indian population.
Selected from the article's own text.
Abstract
Introduction
Cardiovascular disease (CVD) risk and fatality is spread worldwide and is the result of complex interactions between genetic and environmental factors. Asian Indians are at increased risk for developing cardiovascular Diseases, Men are at 103% and women at 90 % risk of developing CVD. The disease would be ranking first to cause mortality in Indian population by the year 2015 (Nag and Ghosh, 2014). Risk of CVD is determined by low HDL levels (Toth, 2004; Dullaart, 2010), high LDL (Cromwell et al., 2007) and high triglyceride levels (Manninen et al., 1992). During the past few decades, much attention has focused on plasma lipoproteins as CVD risk factors.
SCARB1 is Scavenger Receptor class B type which is an antiatherogenic gene involved in cellular transport of cholesterol. The gene has been mapped to human 12q24.31 and encodes a 509 amino acid protein with a molecular weight of 82 KDa. It can be described as the first functionally active HDL receptor capable of facilitating the selective uptake of HDL-C, expressed primarily in liver and adrenal glands. The SCARB1 is a key component in the reverse cholesterol transport pathway which drives the cholesterols from peripheral tissues to the liver for excretion (Trigatti et al., 2003; Kozarsky et al., 1997). Studies have shown that the SCARB1 gene polymorphism rs5888 is associated with serum lipid levels and also associated with the risk of CAD (Wu et al., 2012, 2013) and Myocardial infarction (Stanislovaitiene et al., 2013).
The rs5888 polymorphism has C to T conversion at c.1050 position in exon 8. The polymorphism has shown diverse effects on different population with respect to serum lipid levels and being a risk factor for cardiovascular diseases. The polymorphism affects the HDL cholesterol, Triglyceride, ApoB levels in Chinese population (Wu et al., 2012). The SCARB1 TT genotype was found to be a risk factor for CAD in Chinese population (Wu et al., 2013). TT genotype in Bai Ku Yao and Han Chinese population is associated with low HDLC levels (Wu et al., 2012); whereas, in Lithuanian population CC genotype is associated with elevated TG levels (Smalinskiene et al., 2013). Since the effect of rs5888 polymorphism is different for every population, it is essential to study each population to find the association between the polymorphism and its effects on serum lipid levels and pathogenicity of CVD.
In India majority of Tamil language speaking individuals called Tamilians live in the southernmost part of Indian sub-continent, the state of Tamilnadu, where the consanguinity and inbred marriages are popular even today. There are no reports on SCARB1 polymorphism in Tamil population till date. In our study, the allele frequency and genotype distribution for the South Indian Tamil population was estimated for the first time, also the impact of SCARB1 SNP rs5888 (c.1050C>T) on serum lipid levels and its association with the development of Myocardial infarction has been analyzed by case control study.
Subjects and methods
Study population
A total of 412 subjects from South Indian Tamil population attending SRM Medical College Hospital, Chennai were selected after obtaining written consent. This study was approved by the SRM Medical College Institutional Ethics Committee.
Subject selection
Normolipidemic control group comprised of individuals with normal lipid profile (TC< 7.5, LDLC <4.5, TG <5.0, HDL = 1 mmol/L) and without any history of CVD. Subjects with elevated serum lipids (TC > 7.5. LDLC > 4.5, TG > 5.0) based on American Association of Clinical Endocrinologists (AACE) guidelines were considered as Hypercholesterolemia (HC) group (Handelsman et al., 2011). The myocardial infarction survivors (MI group) included patients who sustained a ST elevation myocardial infarction as diagnosed by American College of Cardiology/ American Heart Association (ACC/AHA) guidelines. Written informed consent was obtained from all subjects who participated in the study.
All demographic and basic laboratory investigations of the study subjects were recorded. Five ml of blood was obtained from the antecubital vein and after processing, the samples were stored in -80°C for analysis later. The serum HDL-C, LDL-C, triglyceride and total cholesterol levels were obtained from clinical records of the patients.
Genomic DNA isolation
Genomic DNA was isolated from the study subjects. 500µL of blood sample was mixed with 1.3 mL lysis buffer (1M sucrose, 1M Tris, 1M MgCl2, TritonX100) and incubated in ice for 20 min followed by centrifugation at 6,000 rpm for 15 min at 4°C. 1 mL lysis buffer was added to the pellet and centrifuged. 500µL nuclease buffer (5M NaCl, 0.5M EDTA) was added to the pellet followed by 10% SDS and 1µL of proteinase K and incubated at 37°C overnight. It was mixed with phenol: chloroform: IAA (25:24:1) and incubated in ice for 25 min. After centrifugation, the aqueous layer was mixed with equal volume of chloroform: IAA (24:1), incubated in ice for 20 min followed by centrifugation. 3M sodium acetate was added to the supernatant followed by equal volume of ice cold isopropanol. The DNA pellet was washed with 70% ethanol. The pellet was then air dried followed by addition of Tris-EDTA. Storage was done at -20°C.
PCR amplification
The polymerase chain reaction was carried out in Applied Biosystems Veriti thermal cycler (India, ThermoFisher Scientific TM). The forward primer used for SCARB1 gene TTGTTTCTCTCCCATCCTCACTTCCTCGACGC3’ and reverse primer 5’CACCACCCCAGCCCACAGCAGC3’ were retrieved from previous reports guidelines (Wu et al., 2012). The 20µL reaction mixture was subjected to initial denaturation at 95°C for 5 min, followed by 33 cycles at 95°C for 45s (denaturation), 71.5°C for 30 seconds (annealing), 72°C for 1 min (extension), and then final extension at 72°C for 8 min. The PCR product of size 218 bp was analyzed by running in 1% agarose gel and visualized under UV illumination.
Genotyping
The genotypes were determined by Restriction Fragment Length Polymorphism (RFLP). The PCR amplified products were digested with 1 unit of Hin1I restriction enzyme (Thermo Scientific TM) by incubating it at 37°C overnight. The digested fragments were separated by electrophoresis on 2.5% agarose gel and visualized it under UV illuminator. The genotyping of the samples was done according to the fragments acquired. Fragments with sizes: 187 bp and 31 bp corresponds to CC; 218 bp, 187 bp and 31 bp to CT and 218 bp to TT.
Statistical analysis
Data collected were recorded in Excel software. Genotyping and allelic frequencies were calculated by direct counting. Quantitative data were expressed as means ± standard deviation. Each genotype was tested for Hardy-Weinberg equilibrium by standard chi square method. The risk allele association was determined by odds ratio (OR) with confidence interval 95% using logistic regression analysis. A p value of less than 0.05 was considered statistically significant. All statistical analysis were performed using SPSS software.
Table I.- Basic characteristic clinical features of subjects.
| Variable | Control (Mean±SD) | MI (Mean±SD) | Hypercholesterolemia (Mean ±SD) |
| Ethnicity | South Indian Tamil | ||
| Number | 155 | 148 | 102 |
| M/F | 86/69 | 102/46 | 54/48 |
| Age | |||
| Male | 51.1 ± 1.7 | 52 ± 1 | 50.5 ± 1 |
| Female | 52.2 ± 1.6 | 55.5 ± 1.5 | 54.38 |
| TC (mmol/L) | 4.6 ± 0.17 | 3.6 ± 0.19 | 7.7 ± 0.25 |
| LDLC (mmol/L) | 3.2 ± 0.11 | 2.4 ± 0.14 | 5.2 ± 0.13 |
| HDLC (mmol/L) | 0.87 ± 0.03 | 0.76 ± 0.04 | 0.94 ± 0.05 |
| TG (mmol/L) | 3.7 ± 0.17 | 3.2 ± 0.24 | 5.8 ± 0.33 |
Results
The demographical and clinical features of the subjects are shown in Table I. All the subjects involved in this study were of South Indian Tamil origin. There was no significant difference in mean age between the study groups (p>0.05). When comparing the lipid profile between the groups, hypercholesterolemic subjects have a significant difference from control groups in their mean total cholesterol, LDL-C and triglyceride levels (p < 0.0001).
The PCR product of SCARB1 gene was obtained and viewed in 1% agarose gel. The genotypes identified by RFLP were named according to the presence or absence of the enzyme restriction sites, due to a C to T transition at amino acid 350 of the SCARB1 gene. The presence of cutting site indicates the C allele, while its absence indicates the T allele (Fig. 1).
The genotype distribution and allele frequency are shown in Table II. The genotype distribution of SCARB1 variants among healthy controls was recorded as CC (22%), CT (60%) and TT (18%). In the MI group, the distribution was CC (22%), CT (48%) and TT (30%) and in the HC group, the distribution was CC (19%), CT (49%) and TT (32%). The allele frequency varied between the three groups, control [C (0.51) and T (0.49)], MI [C (0.46) and T (0.54)] and HC [C (0.43) and T (0.57)]. When recorded for the total population (all three groups combined), the genotype frequencies were found to be CC (21%), CT (53%) and TT (26%). The allele frequencies in the total population was calculated as C (0.47) and T (0.53). The genotypic distribution of SNP among the total population was consistent with Hardy-Weinberg equilibrium (p > 0.05). The heterozygous genotype was found to be marginally predominant in the total population (53%).
Table II.- Genotype distribution and allele frequency.
| Control (n=162) | MI (n=148) | HC (n= 102 ) | Total (n = 412 ) | Allele frequency | |
| CC | 35(22%) | 32(22%) | 19 (19%) | 86 (21%) | |
| CT | 97(60%) | 71 (48%) | 50 (49%) | 218 (53%) | |
| TT | 30(18%) | 45(30%) | 33 (32%) | 108 (26%) | |
| C | 167(51%) | 135 (46%) | 88 (43%) | 382 (47%) | 0.47 |
| T | 157 (49%) | 161 (54%) | 116 (57%) | 428 (53%) | 0.53 |
Table III.- Binomial logistic regression analysis.
| Odds Ratio | CI (95%) | p value | χ2 | |
| MI vs. Control | ||||
| CC | 1.64 | 0.84 – 3.19 | 0.14 | 2.13 |
| CT | 2.04 | 1.17 – 3.56 | 0.01 | 6.53 |
| TT | 0.6 | 0.3132-1.1861 | 0.14 | 2.13 |
| TT Vs CC + CT | 0.52 | 0.30 – 0.88 | 0.01 | 5.97 |
| CC+CT vs TT | 1.92 | 1.13 – 3.26 | 0.01 | 5.97 |
| C | 1.27 | 0.92 – 1.73 | 0.13 | 2.18 |
| T | reference allele | |||
| HC vs. Control | ||||
| CC | 2.02 | 0.96 – 4.2 | 0.06 | 3.5 |
| CT | 2.13 | 1.17 – 3.39 | 0.01 | 6.14 |
| TT | 0.49 | 0.2341 1.040 | 0.06 | 3.5 |
| TT vs. CC + CT | 0.47 | 0.26 – 0.84 | 0.01 | 6.46 |
| CC+CT vs. TT | 2.10 | 1.18 – 3.73 | 0.01 | 6.4 |
| C | 1.4 | 0.98 – 1.99 | 0.05 | 3.5 |
| T | reference allele | |||
T, reference allele; p, significant at 0.05.
Discussion
This study was designed to determine the association of rs5888 polymorphism in the SCARB gene with risk of developing hypercholesterolemia and myocardial infarction in Indian Tamil population. From this study we have observed that, significant association exists between the rs5888 polymorphism with myocardial infarction and increased plasma lipid levels. To the best of our knowledge, this is the first report that reports an association of rs5888 polymorphism with MI and HC in Indian population.
The logistic regression analysis shows that the T allele has protective function, with the TT genotype having lesser odds of developing MI and C allele is a risk allele with CC genotype having high odds of developing myocardial infarction (OR-1.64) and hypercholesterolemia (OR-2.02). The CT heterozygous genotype had higher odds of developing MI (OR-2.04) and hypercholesterolemia (OR-2.13). The results shows that C homozygous and heterozygous condition had higher odds of developing MI and HC whereas the T homozygous had a protective effect. On the contrary, in Iranian population the T allele was associated with increased odds of CAD and C allele remains as reference allele in majority of the reports from various populations (Cerda et al., 2010; Stanislovaitiene et al., 2013; Wu et al., 2012; Rejeb et al., 2012) and T is a minor allele (Goodarzynejad et al., 2016).
When the risk of TT genotype against additive effects of CC and CT were analyzed, the odds were lower for MI (OR – 0.52) and HC (OR-0.47), proving T as a protective allele in homozygous conditions. When the CC + CT vs. TT was analyzed, the odds were higher for MI (OR – 1.92 at CI – 95%) and HC (OR – 2.1 at CI-95%). Thus the results proves that the presence of C allele either in homozygous or in heterozygous condition has higher odds of developing MI and hypercholesterolemia in South Indian Tamil population.
When the serum lipid profiles of the study groups were analyzed according to the respective SCARB1 genotypes, it was observed that with respect to the total population there was a significant difference in the LDL levels, with the highest levels present in the CC genotype (p=0.0001). Among patients with hypercholesterolemia, the CC genotype had a significantly lower HDL (p=0.02), while in the normal control group, CT genotype had significantly lower HDL (p=0.03). From these results, we can observe there exists a significant effect of the genotypes in influencing the serum HDLC levels and the C allele plays a role in lowering the HDLC levels thus increasing the risk of hypercholesterolemia. A similar result was obtained in the study of effect of the polymorphism in the Tunisian population (Kozarsky et al., 1997) where the T allele contributed to increased HDLC levels. A conflicting result was obtained in the Chinese Han (Yin et al., 2012) population where the T allele played a role in lowering HDL-C levels.
Conclusion
This study demonstrated that in South Indian Tamil population SCARB1 rs5888 polymorphism is associated with Hypercholesterolemia and MI. C allele is identified as risk allele in the population and CT as well as CC genotypes are associated with increased risk of causing hypercholesterolemia and MI. In contrast, the TT genotype appears to have an athero-protective function. Although the study has limitation such as relatively small sample size, this is the very first study to report the association of SCARB1 polymorphism in MI and Hypercholesterolemia in Indian population. In future, larger samples may be analyzed to further establish the association of rs5888 in MI and Hypercholesterolemia in the Indian population.
Conflict of interest statement
We declare that we have no conflict of interest.
Figures
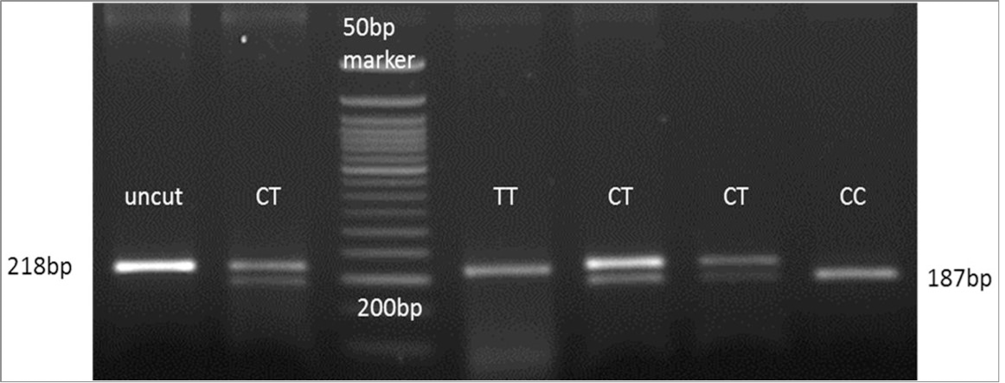
Genotyping of SCARB1 using Hin1l.
References
- MI, myocardial infarction patients; HC, hypercholesterolemia.
- The binomial logistic regression analysis was performed for the MI population group and HC population group with control group as reference group. For the MI vs. Control, the Odds Ratio was obtained for the genotypes CC (OR - 1.64 at 95% CI - 0.84 – 3.19) and CT (OR - 2.04 at 95% CI - 1.17 – 3.56). For analyzing the additive effect of C allele, the odds ratio was obtained for TT Vs CC/CT (OR - 0.52 at 95% CI - 0.30 – 0.88), CC/CT vs. TT (1.92 at 95% CI - 1.13 – 3.26). For C allele 1.27 (at 95% CI - 0.92 – 1.73) was calculated as the odds ratio where T allele was used as the reference allele. For HC vs. control, the odds ratio was obtained for the genotypes CC (OR - 2.02 at 95% CI - 0.96 – 4.2) and CT (OR - 2.13 at 95% CI - 1.17 – 3.39). For analyzing the additive effect of C allele, the odds ratio was obtained for TT vs. CC/CT (OR - 0.47 at 95% CI - 0.26 – 0.84), CC/CT vs. TT (OR - 2.10 at 95% CI - 1.18 – 3.73). For C allele 1.4 (at 95% CI - 0.98 – 1.99) was calculated as the odds ratio whereas T allele was used as the reference allele (Table III).
Services
Article usage statistics
Loading…