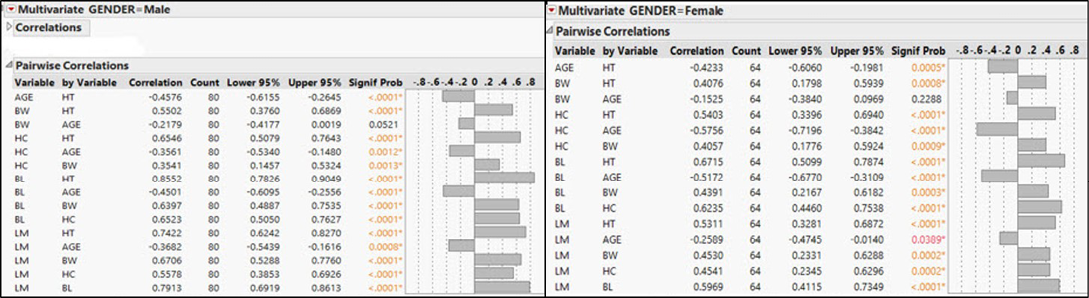
Figure 2: Pairwise correlation between the zoometric measurements in male and female dogs in Maiduguri
Table 3 shows the morphometric measurements of female dogs with brown and white coat colors and different Body Condition Scores. There were no significant differences between female dogs with brown and white coat colors that had ideal (normal) body condition scores and those with thin BCS in terms of all the morphometric measurements (P = 0.2815). The morphometric measurements of male dogs with brown and white coat colors and different Body Condition Scores showed significant differences between male dogs with brown and white coat colors, presenting ideal (normal) body condition scores, obese BCS and those with thin BCS in terms of height at withers, body weight, head circumference, body length and length of muzzle (P = 0.0005).
Table 4 shows the morphometric measurements of female dogs with black and white coat colors and different Body Condition Scores. There were no significant differences between female dogs with black and white coat colors that had ideal (normal) body condition scores and those with thin BCS in terms of all the morphometric measurements (P = 0.6667). The morphometric measurements of male dogs with black and white coat colors and different Body Condition Scores showed significant differences between male dogs with black and white coat colors that had ideal (normal) body condition scores and those with thin BCS in terms of body weights and head circumference (P = 0.0001).
Figure 2 shows pairwise correlations between the zoometric measurements in male and female Nigerian indigenous dogs. There were significant (P < 0.0001) strong positive correlations between HC and HT, BL and HT, BL and BW, BL and HC, LM and HT, LM and BW, LM and HC, LM and BL. Furthermore, there were significant (P < 0.0001) weak negative correlations between age and HT, HC and age, BL and age, LM and age, except BW and age which is not significant (P = 0.0521). The pairwise correlations between the zoometric measurements in female Nigerian indigenous dogs. There were significant (P < 0.0001) strong positive correlations between HC and HT, BL and HT, BL and HC, LM and HT, LM and BW, LM and HC, LM and BL. Additionally, there were significant (P < 0.0001) weak positive correlations between BL and BW, HC and BW, BW and HT. Furthermore, there were significant (P < 0.0001) weak negative correlations between age and HT, HC and age, BL and age, LM and age, except BW and age which is not significant (P = 0.2288).
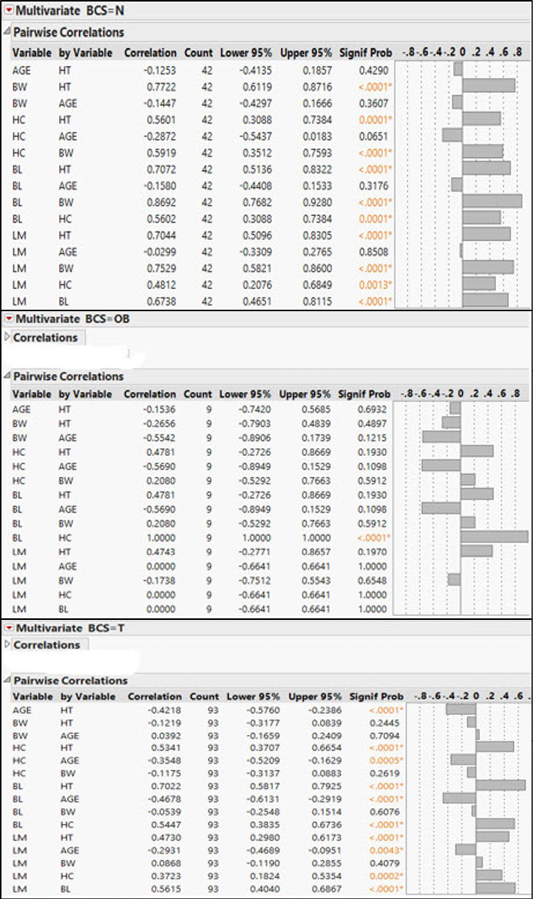
Figure 3: Pairwise correlation between the zoometric measurements in Nigerian indigenous dogs with ideal, obese and thin BCS
Figure 3 shows the pairwise correlations between the zoometric measurements in Nigerian indigenous dogs with ideal (N), obese (OB) and thin (T) body condition scores (BCS). In those with N body condition scores, there were significant (P < 0.0001) strong positive correlations between BW and HT, HC and HT, HC and BW, BL and HT, BL and BW, BL and HC, LM and HT, LM and BW, LM and BL. Furthermore, there were weak negative correlations and not significant between age and HT (P = 0.4290), BW and age (P = 0.3607), HC and age (P = 0.0651), BL and age (P = 0.3176), except LM and age that was weak negatively correlated and not significant (P = 0.8508). The pairwise correlations between the zoometric measurements in Nigerian indigenous dogs with obese BCS. In the dogs with obese BCS, there was a perfect positive and significant (P < 0.0001) correlations between body length and head circumference. Furthermore, the Pairwise correlations between the zoometric measurements in Nigerian indigenous dogs with thin BCS, there were strong positive and significant (P < 0.0001) correlations between BL and HT, BL and HC, LM and HT, LM and BL. Furthermore, there were moderate positive and negative significant (P < 0.0001) correlations between LM and HC, age and HT respectively. There were moderate and weak negative significant (P < 0.0001) correlations between HC and age, LM and age, respectively. Moreso, there were weak negative and not significant correlations between BW and HT (P = 0.2445), HC and BW (P = 0.2619), BL and BW (P = 0.6076), LM and BW (P = 0.4079), BW and age (P = 0.7094) amongst the dogs with thin BCS.
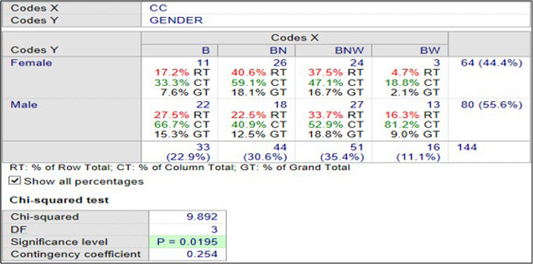
Figure 4: Association between gender and coat colours in Nigerian indigenous dogs in Maiduguri
Figure 4 shows the association between gender and coat colors in Nigerian indigenous dogs in Maiduguri. The association between gender and coat colors of the dogs in Maiduguri is strong and significant. In a population of 33 (22.9%) black (B) dogs in Maiduguri, 22 (66.7%) of the male dogs were B compared with 11 (33.3%) of the female dogs that were B. In a population of 44 (30.6%) brown (BN) dogs in Maiduguri, 18 (40.9%) of the male dogs were BN compared with 26 (59.1%) of the female dogs that were BN. Furthermore, in a population of 51 (35.4%) of brown, white (BNW) dogs in Maiduguri, 27 (52.9%) of the male dogs were BNW compared with 24 (47.1%) of the female dogs that were BNW. Additionally, in a population of 16 (11.1%) of black, white (BW) dogs in Maiduguri, 13 (81.2%) of male dogs were BW while 3 (18.8%) of the female dogs were BW. The female population of dogs in Maiduguri 64 (44.4%), 11 (17.2 %) were B compared with 26 (40.6%) BN, 24 (37.5%) BNW and 3 (4.7%) BW.
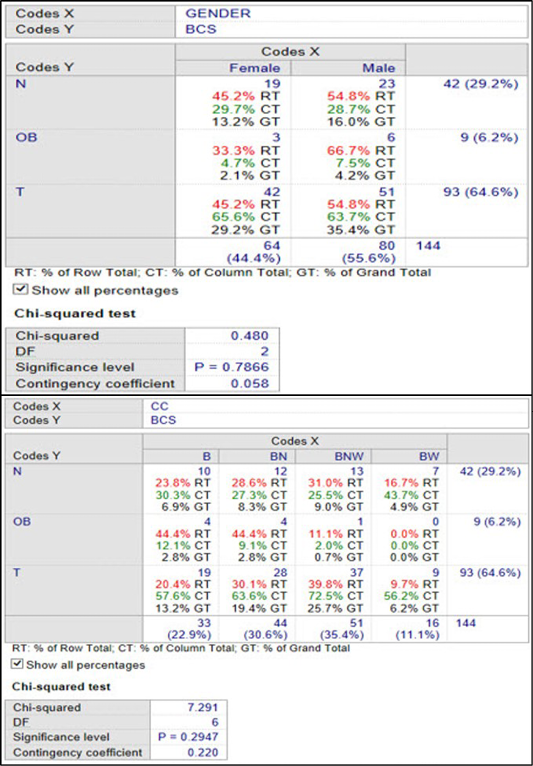
Figure 5: Association between gender, coat colour and body condition scores in Nigerian indigenous dogs in Maiduguri
Figure 5 shows the association between genders, coat color and body condition scores in Nigerian indigenous dogs in Maiduguri. The association between gender and body condition scores of dogs in Maiduguri is weak and not significant. With a population of 42 (29.2%) normal dogs in Maiduguri, 23 (54.8%) of the male dogs were normal compared with 19 (45.2%) of the female dogs. With a population of 9 (6.2%) obese dogs in Maiduguri, 6 (66.7%) of the male dogs were obese compared with 3 (33.3%) of the female dogs. Furthermore, in a population of 93 (64.6%) thin dogs in Maiduguri, 51 (54.8%) of the male dogs were thin compared with 42 (45.2%) of the female dogs. In the female population of dogs in Maiduguri 64 (44.4%), 42 (65.6 %) were thin compared with 19 (29.7%) and 3 (4.7%) that were normal and obese respectively. In the male population of dogs in Maiduguri 80 (55.6%), 51 (63.7%) were thin compared with 23 (28.7%) and 6 (7.5%) that were normal and obese respectively. The association between body condition scores and coat colors of the dogs in Maiduguri is strong and not significant. In a population of 42 (29.2%) ideal (N) dogs, the black (B) dogs in Maiduguri were 10 (23.8%) compared with 12 (26.8 %) that were brown (BN), 13 (31.0%) that were brown/white (BNW) and 7 (16.7%) were black/white (BW). Amongst the obese dogs 9 (6.2%), 4 (44.4%) were B, 4 (44.4%) were BN, 1 (11.1%) was BNW and 0 (0.0%) none was BW. 93 (64.6%) made up the population of thin dogs in the study area. 19 (20.4%) were B, 28 (30.1%) were BN, 37 (39.8%) were BNW and 9 (9.7%) were BW, respectively.