Two physico–chemical parameters of the soil samples were estimated in the laboratory as per the standard protocols and listed in Table 2. The infective titer for this experiment was standardized following serial tenfold dilution of the standard virus and 104 EID50 virus/gram of the soil sample was estimated to be the optimum infective dose for the experiment. Accordingly, 50 μl of 106 EID50 virus per ml of the allantoic fluid was used to spike each 5 g aliquot.

Table 1: Primers used in Real Time RT–PCR for amplification of specific fragment of HA gene
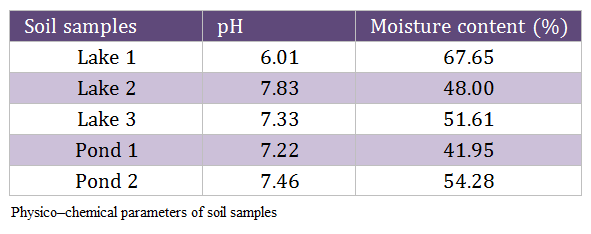
Table 2: Physico–chemical parameters of soil samples
Persistence of HPAI Virus (H5N1) in Soil Samples at 12°C
A set of 50 centrifuge tubes of each soil samples was prepared and kept at 12°C and the persistence of HPAI virus (H5N1) at 12°C was detected every 24 hrs. In the first passage the virus was isolated up to 5, 29, 13, 16 and 14 days post spiking in Lake 1, Lake 2, Lake 3, Pond 1 and Pond 2 soil samples, respectively (Figure 1). In second and third passage also virus could not be isolated from the soil samples found negative in first passage. The viral RNA was detected by qRT–PCR up to 5, 31, 13, 18 and 16 days post spiking in Lake 1, Lake 2, Lake 3, Pond 1 and Pond 2 soil samples, respectively (Fig. 1 and 2). Viral RNA could not be detected in Lake 1 soil on 6 and 7 DPS, in lake 2 soil on 32 and 33 DPS, in lake 3 soil on 14 and 15 DPS, in Pond 1 soil on 19 and 20 DPS and in Pond 2 soil on 17 and 18 DPS samples (Figure 2). The linear regression analysis indicated that the expected time required for virus to become undetectable was 7.42, 34.55, 16.59, 22.23 and 15.71 days against the observed values of 6, 30, 14, 17 and 15 days in Lake 1, Lake 2, Lake 3, Pond 1 and Pond 2 soil samples respectively. The coefficients of determination (R2) values for Lake 1, Lake 2, Lake 3, Pond 1 and Pond 2 soil samples were estimated to be 0.815, 0.866, 0.887, 0.807 and 0.948 respectively (Table 3 and Figure 3a–e).
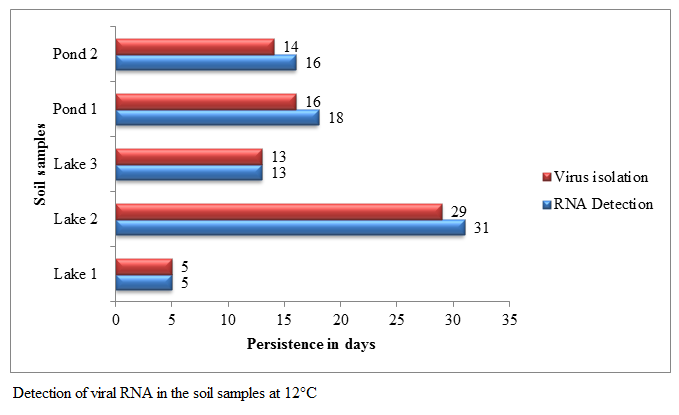
Figure 1: Persistence of HPAI virus and detection of viral RNA from soil samples at 12°C
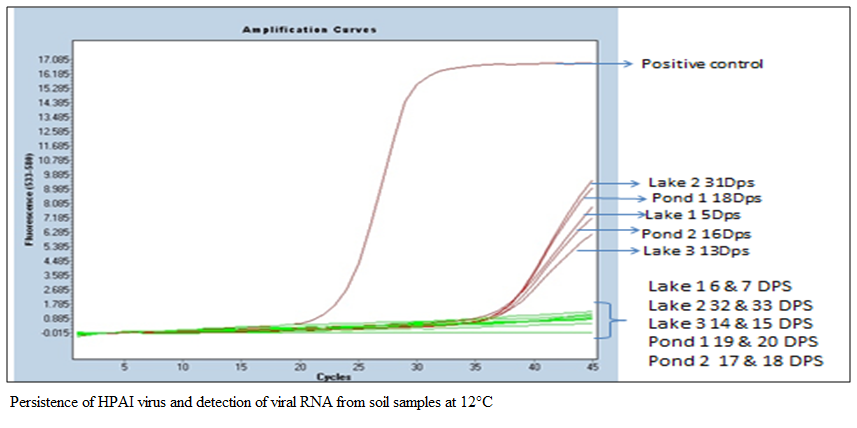
Figure 2: Detection of viral RNA in the soil samples at 12°C
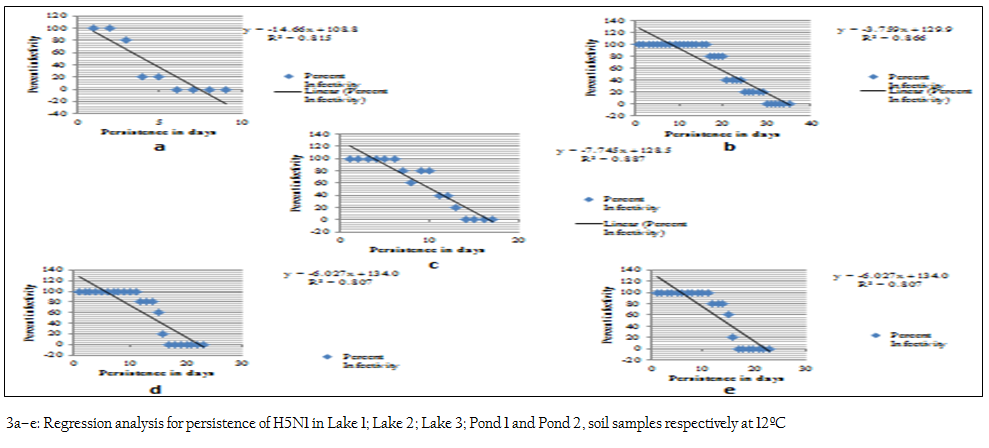
Figure 3: a–e: Regression analysis for persistence of H5N1 in Lake 1; Lake 2; Lake 3; Pond 1 and Pond 2, soil samples respectively at 12ºC
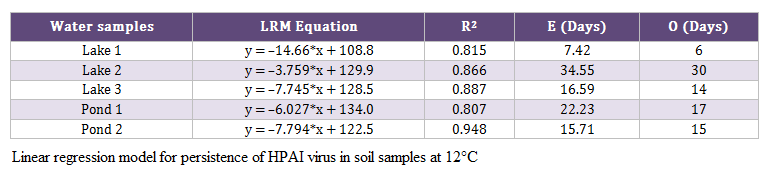
Table 3: Linear regression model for persistence of HPAI virus in soil samples at 12°C
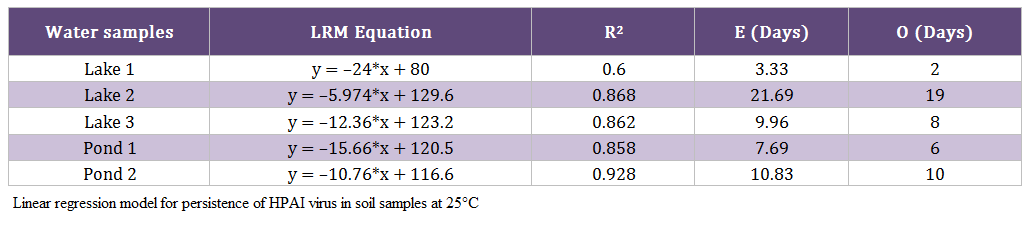
Table 4: Linear regression model for persistence of HPAI virus in soil samples at 25°C
Persistence of HPAI Virus (H5N1) in Soil Samples at 25°C
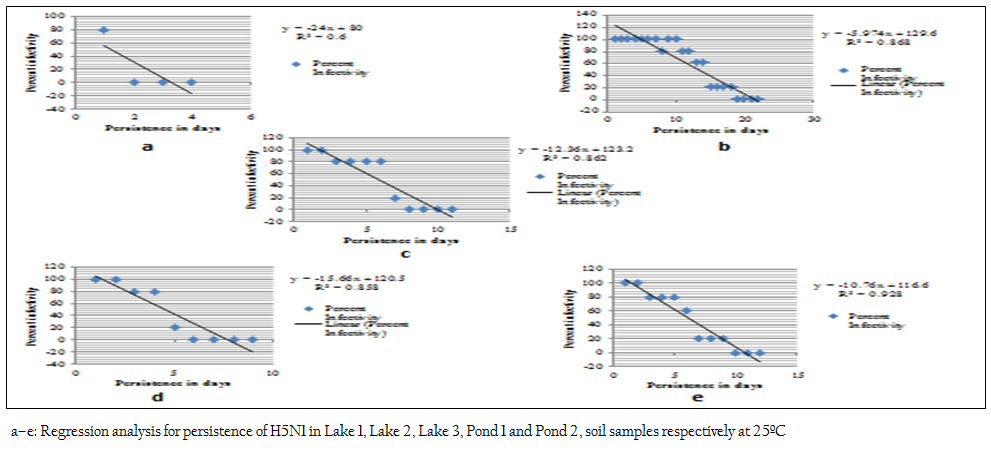
A set of 35 centrifuge tubes of each soil sample was prepared and kept at 25°C and the persistence of HPAI virus (H5N1) at 25°C was detected every 24 hrs. In the first passage the virus was isolated only up to 1, 18, 7, 5 and 9 days of post spiking in Lake 1, Lake 2, Lake 3, Pond 1 and Pond 2 soil samples respectively (Figure 4). In second and third passage virus could not be isolated from the samples negative in the first passage. The viral RNA was detected by qRT–PCR up to 2, 20, 8, 9 and 9 days post spiking in Lake 1, Lake 2, Lake 3, Pond 1 and Pond 2 soil samples, respectively (Figure 4 and 5). Viral RNA could not be detected in Lake 1 soil on 3 and 4 DPS, in lake 2 soil on 21 and 22 DPS, in lake 3 soil on 9 and 10 DPS, in Pond 1 soil on 10 and 11 DPS and in Pond 2 soil on 10 and 11 DPS samples (Figure 5). The linear regression analysis indicated that the expected time required for virus to become undetectable was 3.33, 21.69, 9.96, 7.69 and 10.83 days against the observed values of 2, 19, 8, 6 and 10 days in Lake 1, Lake 2, Lake 3, Pond 1 and Pond 2 soil samples respectively. The coefficients of determination (R2) values for Lake 1, Lake 2, Lake 3, Pond 1 and Pond 2 soil samples were estimated to be 0.6, 0.868, 0.862, 0.858 and 0.928 respectively (Table 4 and Figure 6a–e).
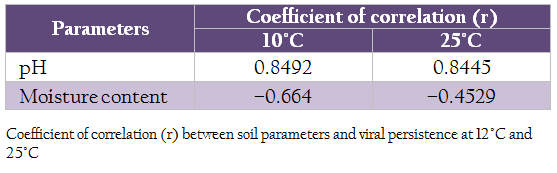
Table 5: Coefficient of correlation (r) between soil parameters and viral persistence at 12°C and 25°C
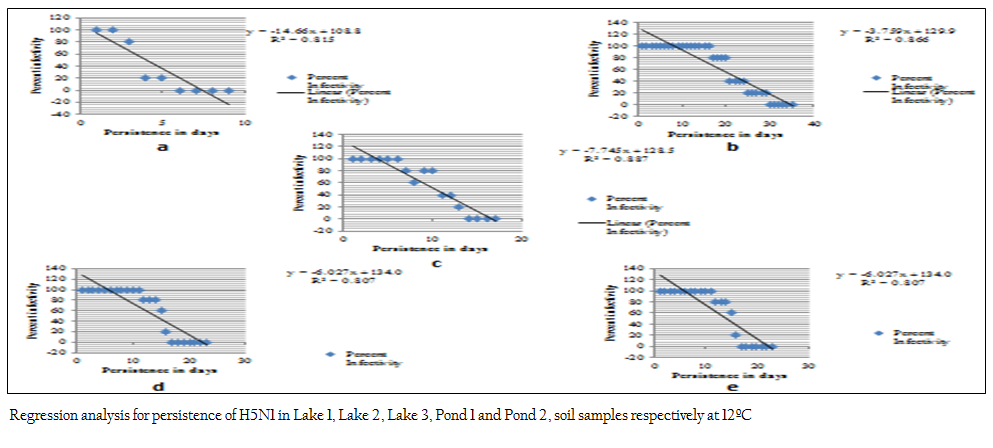
Figure 4: a–e: Regression analysis for persistence of H5N1 in Lake 1, Lake 2, Lake 3, Pond 1 and Pond 2, soil samples respectively at 12ºC
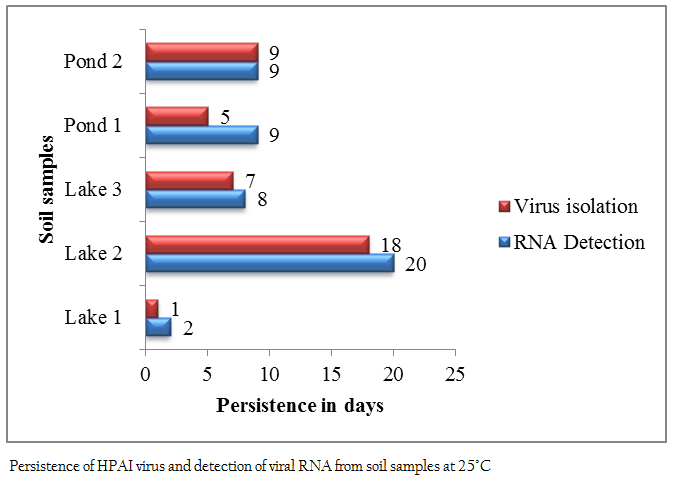
Figure 5: : Persistence of HPAI virus and detection of viral RNA from soil samples at 25°C
Coefficient of correlation (r) was calculated to study the effect of physico–chemical parameters of soil samples on the viral persistence at 12°C and 25ºC (Table 5). The strength of the correlation was estimated as per Cohen (1988). Among the soil parameters, soil pH showed a strong positive correlation at both the temperatures and whereas moisture content showed strong negative correlation at 12°C and moderate negative correlation on the viral persistence at 25°C. Critical values for the Pearson correlation was used to know whether the estimated coefficient of correlation (r) for each parameter is significant or not. None of the soil parameters were statistically significant at critical significance levels (α: alpha) of 0.05 but soil pH was statistically significant at critical significance levels (α: alpha) of 0.1
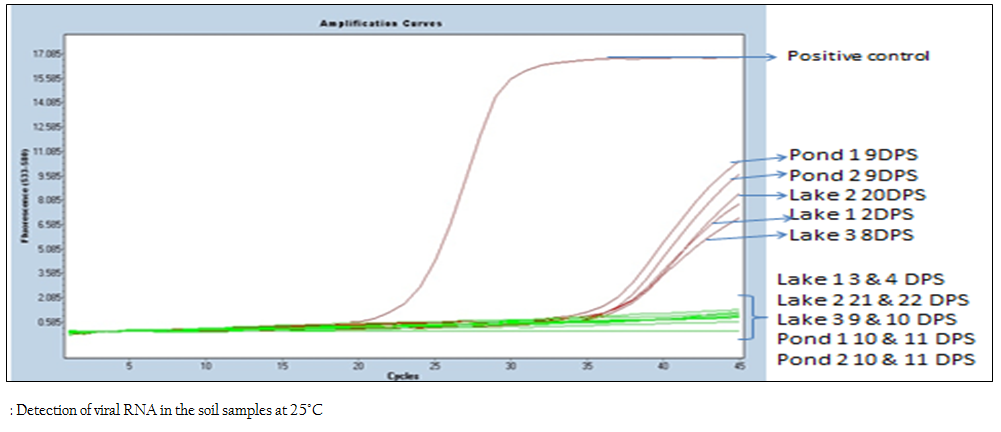
Figure 6: Detection of viral RNA in the soil samples at 25°C