
Marine fisheries play an important role in the national economy of Pakistan, as reflected in the provision of animal protein, employment solutions, and foreign-exchange earnings through exports. However, stock assessments are available for few of the commercial marine fish species in Pakistani waters. Most commercial fish species lack assessments of maximum sustainable yield (MSY) and allowable catch, a situation that hinders effective fisheries management. A Catch–MSY model based on statistical catch data and prior information on population parameters was applied to assess the total allowable catch (TAC) and MSY values for 24 commercial marine fish groups, and thereby assess the status of the fisheries. The results showed an overall MSY of 40.53×10⁴ tonnes and a TAC of 36.47×10⁴ tonnes for the marine fisheries in Pakistani waters. The overall catch in 2015 was less than MSY, so it was considered that the waters were not overfished. However, the MSY estimates for the 24 fish groups showed that 8 groups (cobia, barracudas, groupers, butterfishes, common dolphinfish, dorab wolf-herring, crevalle jack and largehead hairtail) were overfished because their catches in 2015 exceeded the MSY values. Our assessment indicates that the marine fishery resources in Pakistan have now been fully developed. Therefore, it is necessary to intensify the management of the fish resources, and take effective measures to control the fishing effort and catches in Pakistani waters. Moreover, we recommended developing the pelagic fishery resources, such as purpleback flying squid Sthenoteuthis oualaniensis in the Arabian Sea.
Research Article · Volume 53, Issue 1, 26 December 2020 · Open Access
Maximum Sustainable Yield and Development Status of 24 Commercial Marine Fish Groups from Pakistani Waters
· · · ·
Affiliations & Notes ⌄
- 1Key Laboratory of Open-Sea Fishery Development, Ministry of Agriculture and Rural Affairs, South China Sea Fisheries Research Institute, Chinese Academy of Fishery Sciences, Guangzhou 510300, P.R. China 2Southern Marine Science and Engineering Guangdong Laboratory, Guangzhou 510300, P.R. China 3Fishery Biology Laboratory, Centre of Excellence in Marine Biology, University of Karachi, Karachi 75270, Pakistan 4Department of Zoology, Shah Abdul Latif University, Khairpur Mir’s 66020, Pakistan , * C
Article Info ⌄
- Journal:
- Pakistan Journal of Zoology
- Published:
- 26 December 2020

From the article
- In particular, the yields of cobia, barracudas, groupers and common dolphinfish were >20% higher than the MSY, indicating these groups were severely overfished (Fig. 3).
- In particular, the yields of threadfin breams, anchovies, rays and carangids were >40% lower than the MSY in 2015.
- Among the 24 groups, the allowable catches of anchovies, croakers, groupers, long-headed sardines, largehead hairtail, rays and sea catfishes were higher than 10 × 104 t (Table III).
Selected from the article's own text.
Abstract
Introduction
Marine fishery resources are renewable resources that serve as an important source of animal proteins and micronutrients for humans, while they also provide employment opportunities and economic sources for fishermen (FAO, 2016; . In recent decades, owing to increased fishing intensity and environmental pollution, the decline of marine fishery resources has become increasingly serious worldwide ; FAO, 2016). Stock assessment combined with management lays a foundation for maintaining the sustainable development of fisheries. The status of fish populations with an available stock assessment is considerably better than the status of non-assessed populations . Fisheries management measures mainly depend on input and output controls. However, conventional input controls may no longer meet the needs of current fisheries management. Instead, quantitative management of fisheries using the total allowable catch (TAC) system combined with input controls has emerged as an important measure for international fisheries management. In this context, the scientific determination of allowable catches is a prerequisite for implementation of a fishing quota system ; .
Pakistani waters are located in the northern Arabian Sea, and lie adjacent to the marine waters of Iran and India. Pakistan has a coastline of 1 100 km and an exclusive economic zone of 24 × 104 km2, including 50 270 km2 of continental-shelf waters (FAO, 2009). Marine fisheries play a pivotal role in national economy. The yield of marine fisheries experienced rapid growth between the 1960s and the end of the 20th century, having increased from 5.38 × 10⁴ tonnes (t) in 1961 to 47.47 × 10⁴ t in 1999, and reaching a maximum of 49.91 × 10⁴ t in 1993 (data were available at the statistical database of the Food and Agriculture Organization of the United Nations, http://www.fao.org/statistics/en/). Over the last decade, the annual yield has been maintained at approximately 35.00 × 10⁴ t (Fig. 1). In 2016, the yield of Pakistan’s marine fisheries was 37.63 × 10⁴ t, accounting for 73.3% of the aquatic products from fisheries and 56.2% of the total aquatic products. The value of fishery products exported from Pakistan was 352 million US dollars, accounting for 1.7% of total merchandise exports (FAO, 2009).
Currently, stock assessments are available for very few commercial fish species in the marine resources of Pakistan ; Kalhoro et al., 2015; . Most of the country’s commercial marine fish species lack an assessment of maximum sustainable yield (MSY) and allowable catch, which hinders effective management. In addition, fisheries survey data are deficient in Pakistan, and available MSY assessment studies were based mainly on the surplus production model ; Kalhoro et al., 2015b; . As the catch per unit of effort (CPUE) data have not been standardised, there are certain uncertainties in the assessment results . For data-poor fisheries, assessment models based on statistical catch data are often used, such as the depletion-corrected average catch (DCAC) method and depletion-based stock-reduction analysis (DB-SRA) . However, these methods are mostly designed to be applied to fish species with long lifespans and thus are not applicable for most commercial fishes in offshore waters of the tropics and subtropics.
In the present study, an assessment model based on statistical catch data and prior information of the population parameters was used to assess the TAC of marine fisheries in Pakistan and the MSYs and development status of 24 important commercial fish groups in Pakistani waters. The results will provide scientific evidence needed for sustainable development of the country’s marine fishery resources and fisheries management.
Materials and methods
Data sources
The marine fishery catch data for Pakistan (1950–2016) were obtained from the FAO statistical database (http://www.fao.org/statistics/en/). As the catch data were estimated mostly by fish groups, our assessment was likewise conducted based on fish groups . The 24 important commercial fish groups assessed in this study (using the group names referred to in the FAO database) were: anchovies, barracudas, black pomfret, butterfishes, carangids, cobia, common dolphinfish, croakers, dorab wolf-herring, groupers, grunts, Indian oil sardine, crevalle jack, largehead hairtail, mangrove red snapper, mullets, narrow-barred Spanish mackerel, pike congers, porgies, rays, sea catfishes, threadfin breams, tonguefishes and torpedo scad. Some of these fish groups are composed of at least two species, whereas several comprise a single species (i.e. common dolphinfish, torpedo scad, cobia, Indian oil sardine, mangrove red snapper, narrow-barred Spanish mackerel, crevalle jack, dorab wolf-herring and black pomfret).
Assessment model
The assessment was conducted using a simplified production model, the Catch–MSY model. This assessment process no longer requires CPUE data but uses prior distributions for the abundance level and the intrinsic rate of increase . Both the catch data and model parameters were obtained by fish group, which are in line with the fishery resource characteristics and data status in Pakistan. The Catch–MSY model is expressed as follows:
Bt = λ0 k exp (v t) ……… (1)
Bt+1 = [Bt + rBt (1 – Bt / k) – Ct] exp (v t) ……… (2)
Where, Bt is abundance in year t, r is the intrinsic rate of increase, k is the environmental capacity, and Ct is the catch in year t. Assuming that the process error complies with logarithmic normal distribution, then νt represents the normal distribution, with a mean of 0 and variance of σ2; finally, λ0 is the initial abundance level (B1/k). The following Bernoulli distribution is taken as the likelihood function:
L (Θ | Ct) = 1 λ1 ≤ Bn+1 / k ≤ λ2
= 0 λ1 > Bn+1 / k > λ2 ……… (3)
Where, Θ is the parameter vector in the model, and [λ01, λ02] is the prior distribution interval of the abundance level in the final year. Such a likelihood function guarantees that the r–k joint parameter can obtain an effective solution of the population status . The posterior distribution of the parameters was calculated by sampling importance resampling , with 50 000 iterations per calculation. The r–k joint posterior distribution obtained was used to calculate the MSY, with MSY = 0.25 rk. Then, 90% of the MSY was set as the criterion for the allowable catch ; .
Setting of prior distributions for parameters
Prior distributions for both the model parameters, the intrinsic rate of increase and the abundance level, were uniform distributions ; . The prior distribution for the intrinsic rate of increase was determined according to the assignment of resilience categories given in FishBase ; . Each fish group in Pakistani waters is composed of one or more fish species, but life history characteristics of the species in each group were similar. We use the prior range of the main dominant fish species in each fish group following the assessment in the South China Sea . The prior distribution for abundance level was determined based on the development status of the assessment object and the ratio of the catch to the maximum catch in the data ; . For example, in 1954, fisheries in Pakistan relied on small wooden boats, which substantially lowered the fishing effort and yield for croakers; thus, the abundance level in the initial year 1954 was set at 0.5−0.9. The yield of croakers declined after reaching a peak in 2002; thus, the abundance level in the final year, 2015, was set to 0.3−0.7. Due to the wide diversity of fish species in Pakistan, it remains difficult to determine prior distributions for the comprehensive intrinsic rate of increase for Pakistan’s
Table I.- Catch data series and prior distributions for 24 marine fish groups from Pakistani waters.
| Fish group | Data series | Prior distributions | ||
| Intrinsic rate of increase r | Relative biomass level for first year (B1/k) | Relative biomass level for final year (Bn/k) | ||
| Anchovies | 1988−2015 | [0.6, 1.5] | [0.5, 0.9] | [0.01, 0.4] |
| Barracudas | 1978−2015 | [0.05, 0.5] | [0.5, 0.9] | [0.3, 0.7] |
| Black pomfret | 1962−2015 | [0.2, 1] | [0.5, 0.9] | [0.01, 0.4] |
| Butterfishes | 1985−2015 | [0.2, 1] | [0.5, 0.9] | [0.3, 0.7] |
| Carangids | 1962−2015 | [0.2, 1] | [0.5, 0.9] | [0.01, 0.4] |
| Cobia | 1962−2015 | [0.05, 0.5] | [0.5, 0.9] | [0.3, 0.7] |
| Common dolphinfish | 1983−2015 | [0.6, 1.5] | [0.5, 0.9] | [0.3, 0.7] |
| Croakers | 1954−2015 | [0.2, 1] | [0.5, 0.9] | [0.3, 0.7] |
| Dorab wolf-herring | 1971−2015 | [0.2, 1] | [0.5, 0.9] | [0.01, 0.4] |
| Groupers | 1962−2015 | [0.05, 0.5] | [0.5, 0.9] | [0.3, 0.7] |
| Grunts | 1962−2015 | [0.2, 1] | [0.5, 0.9] | [0.01, 0.4] |
| Indian oil sardine | 1950−2015 | [0.2, 1] | [0.5, 0.9] | [0.01, 0.4] |
| Crevalle jack | 1981−2015 | [0.2, 1] | [0.5, 0.9] | [0.01, 0.4] |
| Largehead hairtail | 1980−2015 | [0.05, 0.5] | [0.5, 0.9] | [0.01, 0.4] |
| Mangrove red snapper | 1962−2015 | [0.05, 0.5] | [0.5, 0.9] | [0.01, 0.4] |
| Mullets | 1970−2015 | [0.2, 1] | [0.5, 0.9] | [0.01, 0.4] |
| Narrow-barred Spanish mackerel | 1950−2015 | [0.2, 1] | [0.5, 0.9] | [0.3, 0.7] |
| Pike congers | 1978−2015 | [0.05, 0.5] | [0.5, 0.9] | [0.01, 0.4] |
| Porgies | 1970−2015 | [0.2, 1] | [0.5, 0.9] | [0.01, 0.4] |
| Rays | 1962−2015 | [0.05, 0.5] | [0.5, 0.9] | [0.01, 0.4] |
| Sea catfishes | 1950−2015 | [0.05, 0.5] | [0.5, 0.9] | [0.01, 0.4] |
| Threadfin breams | 1985−2015 | [0.2, 1] | [0.5, 0.9] | [0.01, 0.4] |
| Tonguefishes | 1950−2015 | [0.2, 1] | [0.5, 0.9] | [0.01, 0.4] |
| Torpedo scad | 1987−2015 | [0.2, 1] | [0.5, 0.9] | [0.3, 0.7] |
Numbers in square brackets represent uniform distributions.
marine fishery resources. Here, we instead referred to the assessment results of the comprehensive intrinsic rate of increase in fish populations of the fisheries in the South China Sea, a region which shares similar latitudes with Pakistani waters , and four different prior distributions (0.6−1.5, 0.4−1.5, 0.6−1.7 and 0.4−1.7) were set to assess the impacts of different intervals of prior distribution for the intrinsic rate of increase on the MSY assessment results. The yield data series of fish groups for assessment and the setting of prior distributions for the parameters are summarised in Table I. The modelling and data analysis were both implemented in R 3.3.1.
Results
TAC estimates for fishery resources in Pakistani waters
The model assessment results obtained using the prior distribution for the intrinsic rate of increase that complied with the uniform distribution [0.6, 1.5] are shown in Figure 2. The fish yield exceeded the MSY of Pakistan’s marine fisheries during the period 1992–2002, indicating an overfished status. The yield declined in recent years yet remained near the MSY (Fig. 2A). There was a significant negative correlation between the intrinsic rate of increase r and the environmental capacity k (Fig. 2B), while a distinct linear relationship was found between ln(r) and ln(k) (Fig. 2C). The posterior probability density distribution of MSY was narrower than the relative ranges of parameters r and k; namely, the coefficient of variation was lower for the MSY (Fig. 2D–F). The MSY values of marine fisheries in Pakistan assessed using the four different prior distributions for the intrinsic rate of increase were 40.88 × 10⁴ t, 40.30 × 10⁴ t, 40.13 × 10⁴ t, and 40.80 × 10⁴ t, respectively (Table II). There were minor differences between these values, with a mean of 40.53 × 10⁴ t. The TAC of marine fisheries was estimated to be 36.47 × 10⁴ t. In 2015, the yield of marine fisheries in Pakistan was 36.10 × 10⁴ t, which indicated a stock that was not overfished.
Table II.- The estimated vales of MSY and allowable catch under four prior levels of intrinsic rate of increase, for marine fisheries in Pakistani waters.
| Prior intrinsic rate of increase | Assessment results | ||
| r | MSY (104 t) | Allowable catch (104 t) | |
| [0.6, 1.5] | 0.976 (CV=0.31) | 40.88 (CV=0.023) | 36.79 |
| [0.4, 1.5] | 0.637 (CV=0.37) | 40.30 (CV=0.027) | 36.27 |
| [0.4, 1.7] | 0.654 (CV=0.39) | 40.13 (CV=0.026) | 36.11 |
| [0.6, 1.7] | 0.905 (CV=0.28) | 40.80 (CV=0.022) | 36.72 |
CV is coefficient of variation.
MSY values for 24 fish groups
The assessment results for 24 important commercial marine fish groups in Pakistani waters are summarised in Table III. The intrinsic rate of increase ranged between 0.11 and 0.85 across all groups, while higher trophic groups, such as rays, mangrove red snapper, pike congers and groupers, had relatively low intrinsic rates of increase (<0.2). The yields of eight groups (cobia, barracudas, groupers, butterfishes, common dolphinfish, dorab wolf-herring, crevalle jack and largehead hairtail) exceeded the MSY in 2015, indicating these groups were overfished.
Table III.- Assessment results for 24 commercial marine fish groups in Pakistani waters.
| Fish group | Intrinsic rate of increase r | MSY (104 t) | Allowable catch (104 t) | Catch in 2015 (104 t) |
| Anchovies | 0.73 | 14.37 (0.09) | 12.93 | 6.45 |
| Barracudas | 0.26 | 4.46 (0.12) | 4.01 | 6.69 |
| Black pomfret | 0.26 | 2.91 (0.13) | 2.62 | 2.29 |
| Butterfishes | 0.54 | 4.37 (0.08) | 3.93 | 4.93 |
| Carangids | 0.28 | 10.09 (0.06) | 9.08 | 2.61 |
| Cobia | 0.22 | 2.31 (0.03) | 2.08 | 3.89 |
| Common dolphinfish | 0.85 | 3.58 (0.07) | 3.22 | 4.61 |
| Croakers | 0.41 | 18.77 (0.11) | 16.89 | 16.16 |
| Dorab wolf-herring | 0.26 | 2.68 (0.13) | 2.41 | 2.78 |
| Groupers | 0.20 | 11.46 (0.17) | 10.31 | 15.98 |
| Grunts | 0.30 | 4.84 (0.09) | 4.36 | 4.01 |
| Indian oil sardine | 0.38 | 35.98 (0.13) | 32.38 | 27.78 |
| Crevalle jack | 0.32 | 6.70 (0.05) | 6.03 | 7.32 |
| Largehead hairtail | 0.26 | 12.46 (0.06) | 11.21 | 12.66 |
| Mangrove red snapper | 0.13 | 1.56 (0.03) | 1.40 | 1.26 |
| Mullets | 0.29 | 9.82 (0.09) | 8.84 | 9.53 |
| Narrow-barred Spanish mackerel | 0.52 | 9.89 (0.18) | 8.90 | 9.79 |
| Pike congers | 0.14 | 3.16 (0.21) | 2.84 | 2.76 |
| Porgies | 0.29 | 2.90 (0.14) | 2.61 | 1.96 |
| Rays | 0.11 | 13.92 (0.03) | 12.53 | 4.72 |
| Sea catfishes | 0.33 | 21.57 (0.22) | 19.41 | 19.29 |
| Threadfin breams | 0.35 | 5.06 (0.08) | 4.55 | 2.89 |
| Tonguefishes | 0.30 | 1.42 (0.09) | 1.28 | 1.12 |
| Torpedo scad | 0.47 | 3.75 (0.10) | 3.38 | 3.63 |
Numbers in parenthesis represent the coefficient of variation.
In particular, the yields of cobia, barracudas, groupers and common dolphinfish were >20% higher than the MSY, indicating these groups were severely overfished (Fig. 3). The yields of the remaining 16 groups were lower than the MSY in 2015, indicating these groups were not overfished. In particular, the yields of threadfin breams, anchovies, rays and carangids were >40% lower than the MSY in 2015. Among the 24 groups, the allowable catches of anchovies, croakers, groupers, long-headed sardines, largehead hairtail, rays and sea catfishes were higher than 10 × 104 t (Table III).
Discussion
Assessment model and uncertainty
Stock assessments are only available for less than 1% of fish species worldwide . As most fishery resources lack survey data, it is difficult to assess the MSY and allowable catch using conventional methods . Catch-based assessment models can assess the MSY by using statistical catch data and the life history characteristics of fish populations, without the need for survey data. The commonly used catch-based models are DCAC, DB-SRA, the only-reliable-catch-stocks approach (ORCS), and production models based on the Bayesian method ; . However, these methods have limitations concerning the life-history parameters for populations of the assessment object . In Pakistan, fish yield is estimated mostly for groups, and the natural death coefficient of many species is higher than 0.2, making it impossible to make assessments using the above-mentioned methods. By contrast, the Catch–MSY model used in the present study is not selective for the biological characteristics of fish populations. The statistical yield data required for the model can be given for fish groups, which is presently most suitable for stock assessments in Pakistani waters. The setting of prior distribution for the intrinsic rate of increase is an important source of uncertainties in the model assessment process. FishBase (used in the current study) assigns intrinsic rate of increase for main species in each fish group, and this is dependent mainly on the growth parameter, age at sexual maturity, maximum age, and fecundity according to the von Bertalanffy growth equation. However, there remains a dearth of studies on the comprehensive intrinsic rate of increase in fish populations for marine fishery resources in Pakistan. Therefore, we referred to assessment results for fisheries in offshore waters of the South China Sea, which shares similar latitudes with Pakistani waters , and we set four different prior distributions for the intrinsic rate of increase to assess model uncertainties. We found that the MSY values assessed using the four different prior distributions for the intrinsic rate of increase were 40.88 × 10⁴ t, 40.30 × 10⁴ t, 40.13 × 10⁴ t, and 40.80 × 10⁴ t, respectively, with less than 2% variation. This result indicates that the prior distributions for the intrinsic rate of increase had little effect on the assessment results of MSY, in agreement with the assessment results from the South China Sea . Therefore, when using the Catch–MSY model for stock assessments, the results are more constrained by the accuracy of the statistical yield data. The statistical yield data used in the present study were obtained from the FAO statistical database, which were relatively credible and reliable.
Current status of marine fishery development in Pakistan
The MSY of the marine fisheries in Pakistan assessed by the model was 40.53 × 10⁴ t, with a TAC of 36.47 × 10⁴. In 2015, the yield of marine fisheries in Pakistan was 36.10 × 10⁴ t. Although the current fishing yield has not exceeded the MSY, it has reached the TAC and thus requires appropriate management controls. The assessment results for the 24 important commercial fish groups showed that eight groups had been overfished, while the remaining 16 groups appeared not to be overfished. In particular, the yields of narrow-barred Spanish mackerel, mullets and torpedo scad in 2015 exceeded the allowable catch, and thus these fisheries require management controls. Moreover, although yields for threadfin breams, anchovies, rays and carangids in 2015 were >40% lower than the MSY, the time-series of catch data (Fig. 4) showed that the fishing yields of these four groups remained higher than the MSY over the past period. Thus, the collapse of fish stocks after overfishing had led to the currently low yields. Therefore, although the yields of these four groups were lower than the MSY, their stocks have not yet recovered and measures prohibiting fishing of those groups are required for stock recovery.
The Catch–MSY model was previously used to assess fish stocks in offshore waters of the South China Sea, and obtained the TAC and allowable catches for 11 important fish groups . Those results showed that fish groups with a low intrinsic rate of increase and high trophic level, such as groupers, were seriously overfished. Similar results were obtained for some of the fish groups in Pakistani waters, such as groupers, cobia and barracudas, which all had a relatively low intrinsic rate of increase. Fish populations with a low intrinsic rate of increase correspond to species with a slow growth rate and low fecundity, along with high resistance and low resilience. Once collapsed, such populations are difficult to recover ; . Our assessment results indicate that the current marine fishery resources in Pakistan have been fully developed. Most of the commercial fish groups have been overfished or are recovering after collapse, and thus have little development potential. Similar to the resources found in deep waters of the South China Sea, the Arabian Sea is now rich in fish stocks such as purpleback flying squid Sthenototeuthis oualaniensis, bluefin tuna Thunnus thynnus and skipjack tuna Katsuwonus pelamis, among which S. oualaniensis has the greatest potential for fishery development . China has implemented exploratory fishing for S. oualaniensis in the Arabian Sea several times , while a fishing fleet of vessels equipped with a light trap and falling nets has been established in the South China Sea . Therefore, with S. oualaniensis fisheries in the Arabian Sea as an entry point, we should strengthen the cooperation by taking full advantage of the China–Pakistan All-Weather Strategic Cooperative Partnership and collaborate to jointly develop the high-seas fishery resources in the Indian Ocean. This would have great implications for promotion of China’s One Belt, One Road Initiative for sustainable fisheries development.
Acknowledgments
This research was supported by Central Public-Interest Scientific Institution Basal Research Fund, CAFS (2018GH03), National Natural Science Foundation of China (31602157), and Key Special Project for Introduced Talents Team of Southern Marine Science and Engineering Guangdong Laboratory (Guangzhou, GML2019ZD0605).
Statement of conflict of interest
The authors have declared no conflict of interests.
Figures
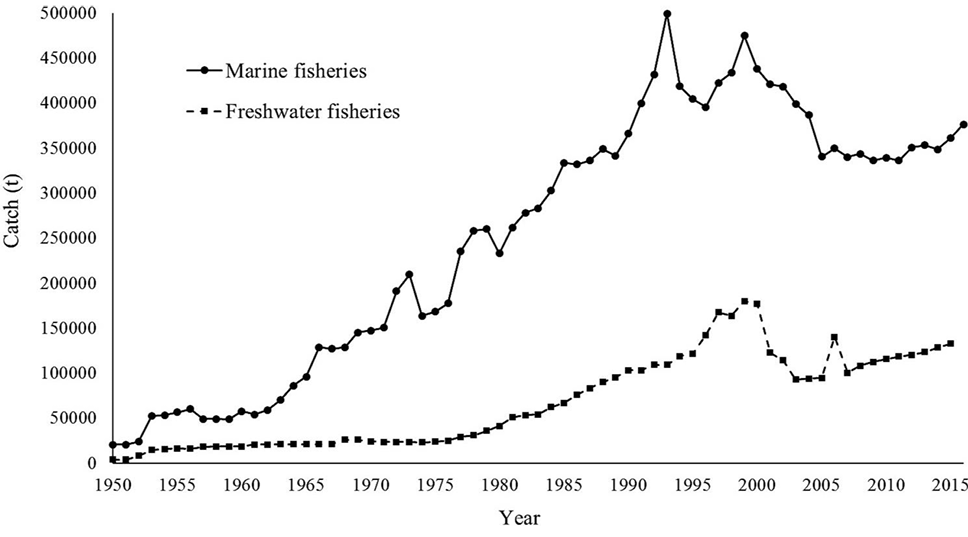
Statistical catch data for the marine fisheries and freshwater fisheries in Pakistan, from 1950 to 2015.
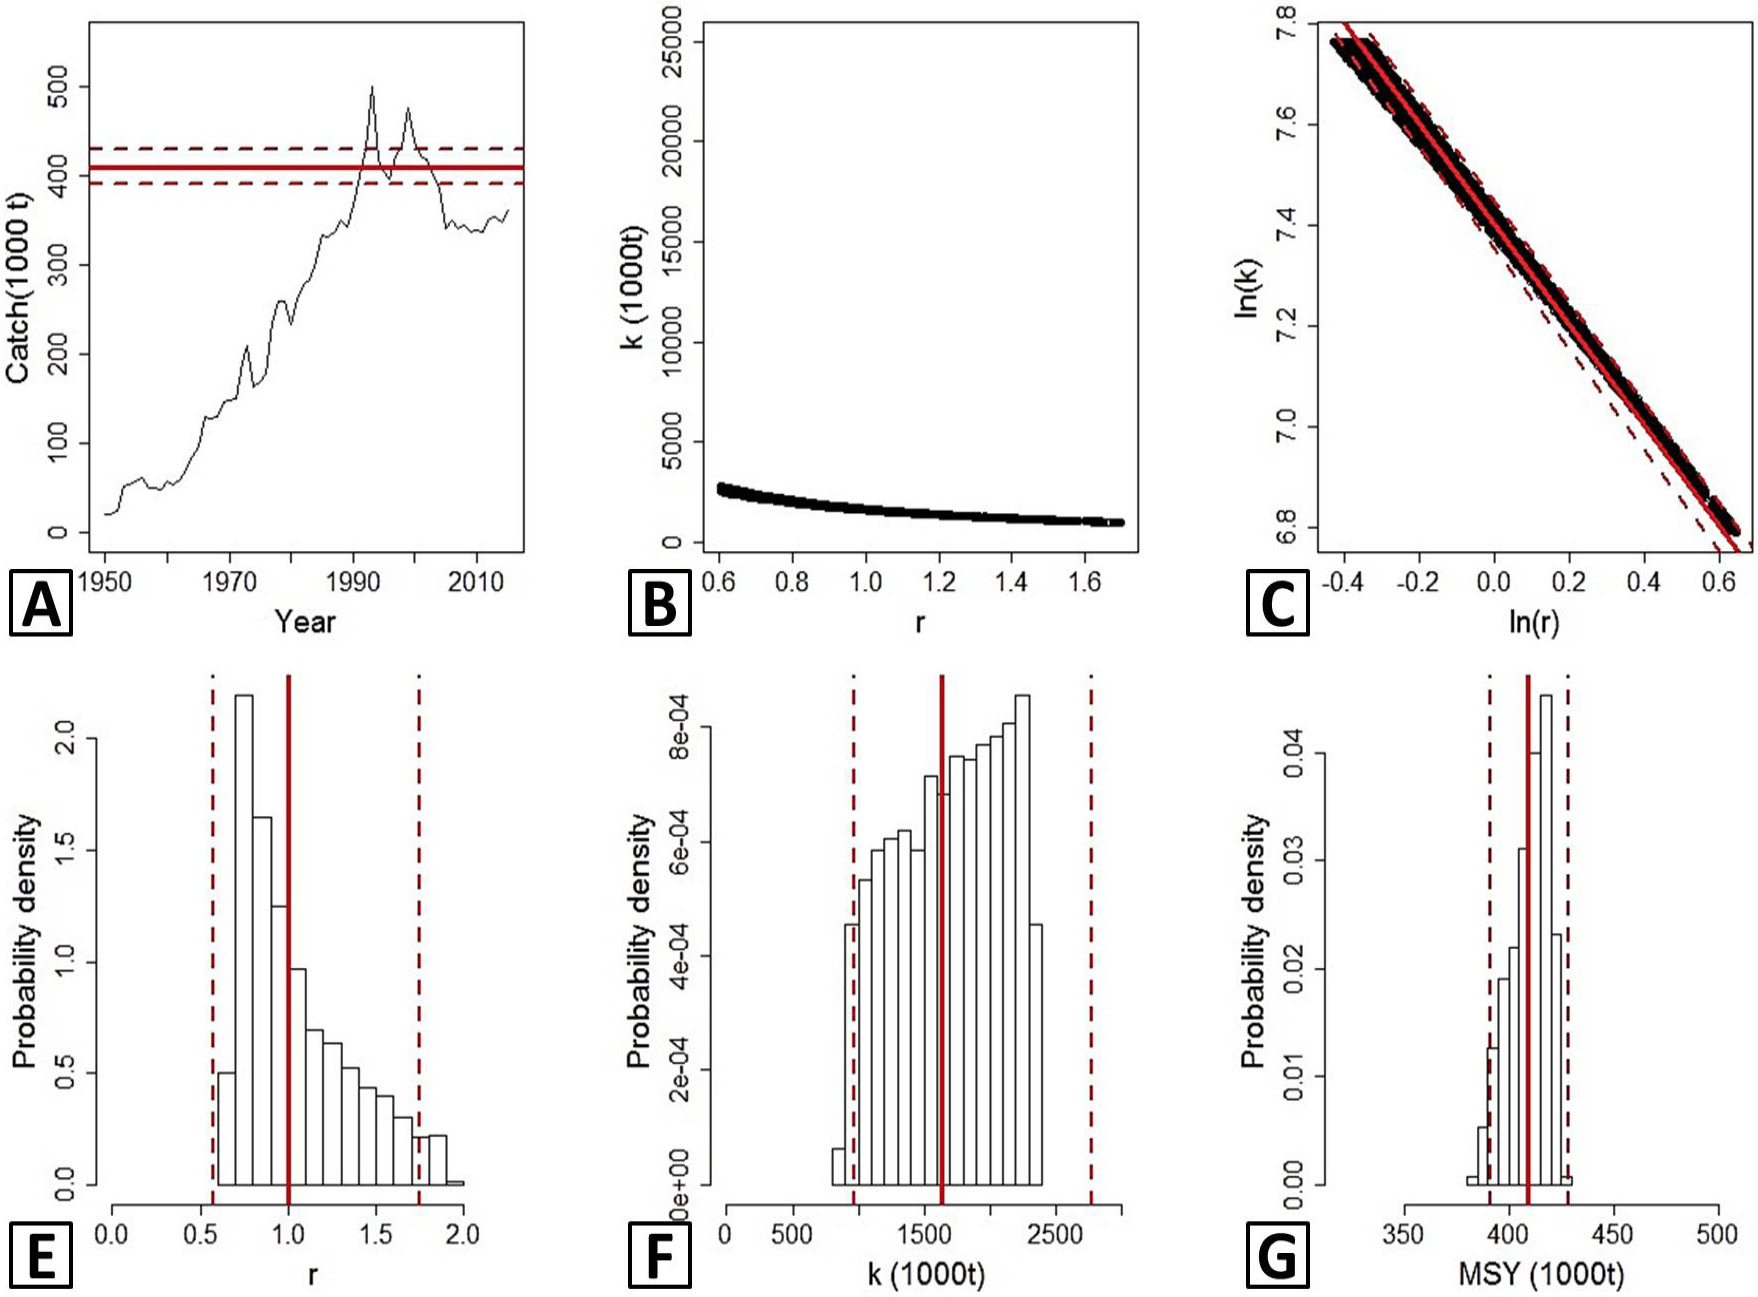
Model outputs for marine fisheries in Pakistani waters with r [0.6, 1.5].
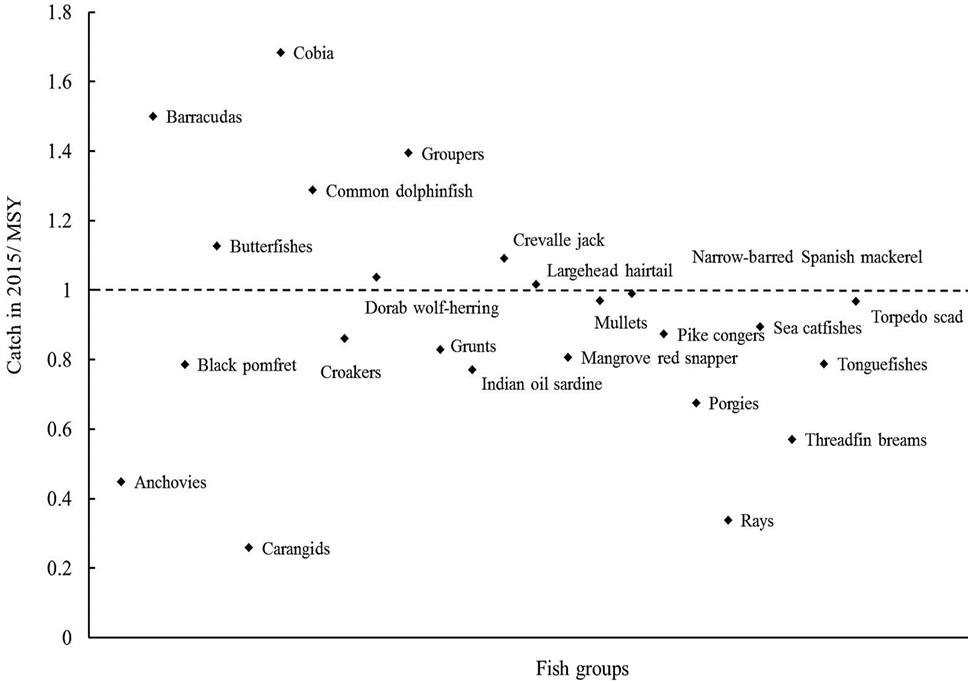
Ratios of the catch in 2015 to the value of MSY, for 24 important commercial marine fish groups in Pakistani waters.
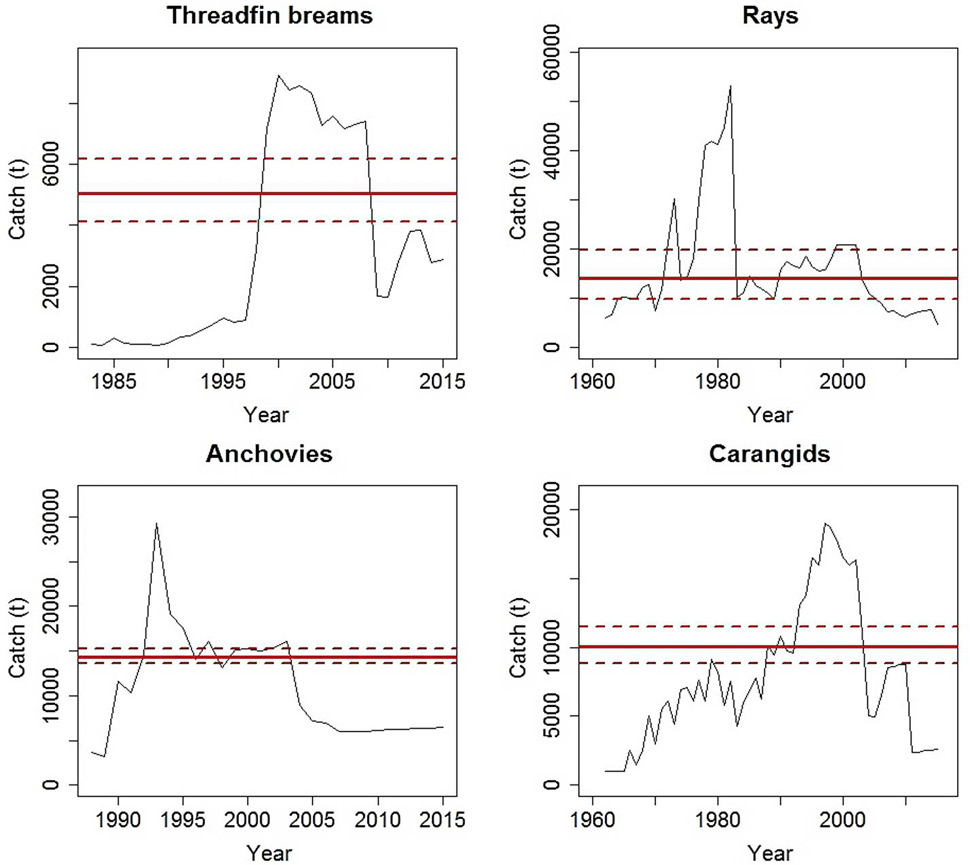
Statistical catch data and estimated values of MSY for fisheries for the groups threadfin breams, rays, anchovies and carangids in Pakistani waters.
References
- Allison, G., 2004. The influence of species diversity and stress intensity on community resistance and resilience. Ecol. Monogr., 74: 117-134. https://doi.org/10.1890/02-0681[CrossRef]
- Berkson, J. and Thorson, J.T., 2015. The determination of data-poor catch limits in the United States: Is there a better way? ICES J. mar. Sci., 72: 237-242. https://doi.org/10.1093/icesjms/fsu085[CrossRef]
- Carruthers, T.R., Punt, A.E., Walters, C.J., Maccall, A., Mcallister, M.K., Dick, E.J. and Cope, J., 2014. Evaluating methods for setting catch limits in data-limited fisheries. Fish. Res., 153: 48-68. https://doi.org/10.1016/j.fishres.2013.12.014[CrossRef]
- Chen, X., Guo, W. and Tian, S., 2006. Resource density and distributions of Symlectoteuthis oualaniensis in open seas of northern Arabian Sea. Adv. Mar. Biol., 24: 360-364.
- Costello, C., Ovando, D., Hilborn, R., Gaines, S.D., Deschenes, O. and Lester, S.E., 2012. Status and solutions for the world’s unassessed fisheries. Science, 338: 517-520. https://doi.org/10.1126/science.1223389[CrossRef]
- Dick, E.J. and Maccall, A.D., 2011. Depletion-based stock reduction analysis: A catch-based method for determining sustainable yields for data-poor fish stocks. Fish. Res., 110: 331-341. https://doi.org/10.1016/j.fishres.2011.05.007[CrossRef]
- FAO, 2009. Fishery and aquaculture country profiles: The Islamic Republic of Pakistan. Available at: http://www.fao.org/fishery/facp/PAK/en (accessed 12 Jan, 2019).
- FAO, 2016. The state of world fisheries and aquaculture 2016: Contributing to food security and nutrition for all. Available at: http://www.fao.org/3/a-i5555e.pdf (accessed 12 Jan, 2019).
- Froese, R. and Pauly, D., 2000. Estimation of life history key facts. In: FishBase 2000: Concepts, design and data sources (eds. R. Froese and D. Pauly). ICLARM, Philippines.
- Guo, W. and Huang, S., 2001. Comparative analysis of different implementary manners of the total allowable catch measure. Trans. Oceanol. Limnol., 4: 61-69.
- Haddon, M., 2001. Modelling and quantitative methods in fisheries, Second Edition. Chapman and Hall, New York, United States.
- Jiao, Y., Enric, C., Kate, A. and Guo, F., 2011. Poor-data and data-poor species stock assessment using a Bayesian hierarchical approach. Ecol. Appl., 21: 2691-2708. https://doi.org/10.1890/10-0526.1[CrossRef]
- Kalhoro, M.A., Liu, Q., Memon, K.H., Waryani, B. and Soomro, S.H., 2015. Maximum sustainable yield of greater lizardfish saurida tumbil fishery in Pakistan using the CEDA and ASPIC packages. Acta Oceanol. Sin., 34: 68-73. https://doi.org/10.1007/s13131-014-0463-0[CrossRef]
- Kleisner, K., Zeller, D., Froese, R., and Pauly, D., 2013. Using global catch data for inferences on the world’s marine fisheries. Fish Fish., 14: 293-311. https://doi.org/10.1111/j.1467-2979.2012.00469.x[CrossRef]
- MacCall, A.D., 2009. Depletion-corrected average catch: A simple formula for estimating sustainable yields in data-poor situations. ICES J. mar. Sci., 66: 2267-2271. https://doi.org/10.1093/icesjms/fsp209[CrossRef]
- Martell, S. and Froese, R., 2013. A simple method for estimating msy from catch and resilience. Fish Fish., 14: 504-514. https://doi.org/10.1111/j.1467-2979.2012.00485.x[CrossRef]
- Memon, K.H., Liu, Q., Kalhoro, M.A., Nabi, A. and Zhang, K., 2015. Maximum sustainable yield estimates of barramundi Lates calcarifer fishery from Pakistani waters. Indian J. Geo-Mar. Sci., 44: 825-832.
- Mu, Y., 2006. Fishery management: Focusing on right-based regime. China Ocean University Press, Qingdao, China.
- Panhwar, S.K., Liu, Q., Amir, S.A. and Kalhoro, M.A., 2012. Performance comparison between logistic and generalized surplus-production models applied to the sillago sihama fishery in Pakistan. J. Ocean Univ. China, 11: 401-407. https://doi.org/10.1007/s11802-012-1930-x[CrossRef]
- Pauly, D. and Zeller, D., 2016. Catch reconstructions reveal that global marine fisheries catches are higher than reported and declining. Nat. Commun., 7: 10244. https://doi.org/10.1038/ncomms10244[CrossRef]
- Ricard, D., Minto, C., Jensen, O.P. and Baum, J.K., 2012. Examining the knowledge base and status of commercially exploited marine species with the ram legacy stock assessment database. Fish Fish., 13: 380-398. https://doi.org/10.1111/j.1467-2979.2011.00435.x[CrossRef]
- Zhang, P., Zhang, J., Li, Y., Zhang, R., Lin, L., Yan, L., Qiu, Y., Sun, D. and Chen, S., 2016. An exploratory fishing survey of light falling-net fisheries in the central and southern South China Sea in autumn. South China Fish. Sci., 12: 67-74.
- Zhang, K., Liao, B., Xu, Y., Sun, M., Qiu, Y. and Chen, Z., 2017. Assessment for allowable catch of fishery resources in the South China Sea based on statistical data. Haiyang Xuebao, 39: 25-33.
- Zhang, K., Liu, Q., Liao, B., Xu, Y., Sun, M., Geng, P. and Chen, Z., 2018. Comparative effects of distorted fishery data on assessment results of two non-equilibrium surplus production models. J. Fish. China, 42: 1378-1389.
- Zhu, X., Fang, Y., Yan, L., Zhang, G. and Huang, L., 2009. The ecological strategy evolution of marine fishes under high-intensity fishing environment. Bull. Sci. Technol. Soc., 25: 51-55.
Cited by 1 article
In journals published by ResearchersLinks.
Services
Article usage statistics
Loading…