
Kalij pheasant Lophura leucomelanos is habitat indicator and the information about its habitat characteristics and suitability is lacking. In the current study, presence of kalij pheasant was recorded from 166 sites of Mirpur Division Azad Jammu and Kashmir, Pakistan. The maximum abundance was recorded at Gaian site (2.33/ha). Estimation of Habitat Suitability Index (HSI) from 166 sites revealed that ten sites fell under the category of highly suitable habitat based on parameters including water, food, vegetation, disturbance, hunting and predation pressure. Kalij pheasant was distributed between 381-1689m (asl) elevation. Species presence data along with GIS database were used to model the habitat suitability of kalij pheasant through MaxEnt software, version 3.4.4. The model showed an average Area Under the Curve value (AUC) (0.802), showing the model precision for suitable habitat mapping. The analysis for the contribution of environmental variables through Jackknife test showed that temperature was the prime environmental variable. Results revealed that out of total, 4388 km2, 406.03 km2 area was calculated to be highly suitable for kalij pheasant. Identification of hotspots and potential habitats for kalij pheasant can be considered as an important initiative to conserve the species.
Research Article · Volume 56, Issue 1, 16 December 2023 · Open Access
Habitat Suitability Modelling of Kalij Pheasant (Lophura leucomelanos) in Mirpur Division, Azad Jammu and Kashmir, Pakistan
· · · · ·
Affiliations & Notes ⌄
- 1Environmental Health and Wildlife Laboratory, Institute of Zoology, University of the Punjab, Lahore, Pakistan 2Department of Zoology, Division of Science and Technology, University of Education Lahore, Pakistan 3Department of Zoology, University of Kotli, Kotli, Azad Jammu and Kashmir, Pakistan 4Department of Wildlife Management, Pir Mehar Ali Shah, Arid Agriculture University Rawalpindi, Pakistan * Corresponding author: furqanzoologist@gmail.com
Article Info ⌄
- Journal:
- Pakistan Journal of Zoology
- Published:
- 16 December 2023

From the article
- Kalij pheasants were found mostly near to forest because they need food, dense cover and more sloping areas to hide from predators.
- An area of 9.25% was found to be highly suitable habitat for kalij pheasant as per the model.
- Their suitable habitat was associated with food, water availability, dense cover, sloping areas, elevation, precipitation and temperature in the study area.
- The current study can be considered as an initiative for the conservation and management of kalij pheasant in the identified hotspots of kalij pheasant.
Selected from the article's own text.
Abstract
Introduction
Galliformes are an important avian group and are useful indicators of environmental quality due to living in forests . Kalij pheasants are native to South Asia, distributed from the Indus River of Pakistan in the Western Himalayas, Northern India, Nepal, Bhutan, Sikkim, Assam, South through Burma to Western Thailand and introduced to United States (Robert, 1991; ; ; . Mostly they are sedentary from 400-3600m elevation in forested foothills and mountainous areas along with woodland roads, at the edges of forest clearings and brushy ravines, but during winter may move to lower elevations travelling to large distances ; .
The information about the distribution of species is vital for ecologists . Density and abundance data are necessary for monitoring the population and implementation for conservation management . Habitat Suitability Modelling techniques are helpful in locational records of species that predict the potential distribution to manage conservation issues . Mapping of potentially suitable habitat is vital for monitoring and restoration of species whose native population is declining . Furthermore, management of species native habitat and their conservation is also important . Sometimes important data related to species distribution and their status are insufficient that leads to the difficulty in habitat modelling . Therefore, accurate modelling of geographic distribution of species is fundamental in ecology and conservation ; .
The geographic distribution is obtained by mapping the particular area where all necessary requirements for species are met . These models can help in identifying previously existed populations, determining their sites for reintroduction, selection, and management of protected areas depending on data quality . These models statistically relate field observation to produce spatial prediction which indicates the suitability of different locations of species for exploring the required resources, assessing the ecological impact of different factors, human-wildlife conflict, threats, conservation planning, and priorities of species ; ; ; ; . MaxEnt estimates uniform distribution of an area in which the expected value of each environmental variable under this distribution matches its empirical average .
Kalij pheasant Lophura leucomelanos is Least Concern and falls under Appendix III of CITES. Azad Jammu and Kashmir Wildlife Act (2015) kept kalij under schedule III and protected species (AJ and K Wildlife Act, 2015). In Pakistan, due to the limited habitat, population of kalij pheasant is plummeting alarmingly . Kalij pheasant has not been extensively studied in their natural habitat and their population is decreasing ; ; . There is a lack of in-depth research about their habitat, geographical distribution, hence scientific efforts were needed to elaborate the ecological data of kalij pheasant.
Materials and Methods
Study area
The current research was conducted in Mirpur Division having three districts i.e., Mirpur, Bhimber, and Kotli (Fig. 1). Mirpur Division is situated in the South-eastern part of the State of Azad Jammu and Kashmir (AJ and K), Pakistan. It is bordered by Rawlakot District in the North, Jhelum in the South, Indian Administered Kashmir in the East and Rawalpindi in its West. The study area covers an area of 4,388 km2, elevation ranges between 270 m –2000 m above sea level (asl). Mirpur district is located (33o1480’N, 73o7437’ E) in the southern part of AJ and K covers an area of 1010 km2. Topographically this region is plain, with scattered small hills and nullahs.
District Kotli has an area of 1862 km², located (33o5008’N, 73o9007’ E) and mostly hilly areas with small, scattered plains. Protected areas Pir Lasura and Poonch River Mahsheer National Parks are located in this territory having the diversity of animals and plants. District Bhimber is located (32°9753’N, 74°0858’E) and covers an area of 1516 km². This region is plain with cultivated land, hills and nullahs also present.
Distribution
Distribution of kalij was determined by conducting 254 extensive surveys, data on direct (sightings and camera trapping) and indirect (calls, fecal pellets, feathers, local knowledge) evidence of species occurrence were gathered based on the systematic trail, sampling and opportunistic searches carried in the study area from April 2020 to March 2021. Data were collected on the following parameters during the monitoring: starting time, end time, habitat type, total distance covered. Geographical coordinates and elevation were recorded using the Garmin e-Trex GPS navigator. Secondary data were also collected through interviews with local people in the villages and surrounding areas.
Distance sampling
Line transect method was used following distance sampling technique to estimate the population density .
Ecogeographical variables
During field visit different ecogeographical variables were also recorded, that included distance to the water source, distance to human settlement, distance to agricultural land, distance to road and distance to forest. The distance was measured using Google Earth Pro software.
Habitat suitability index HSI of each locality was calculated by adding the score of each variable of a specific locality by using the following formula:
HSI=(SI1+SI2+SI3+SI4+SI5+SI6+SI7+SI8)/8
While Suitability Index (SI) values indicate the availability, accessibility and impact of different habitat variables including water, food, vegetation cover, cultivation, human settlement, as compared to the actual requirements of kalij pheasant as per literature. SI values of disturbance, hunting pressure, predation pressure were based on the primary and secondary data of each locality, and HSI score ranged from 0.0–1.0 (least suitable to highly suitable habitat) (Table I).
Table I. Habitat suitability index score.
| HSI Score | Category | Suitability |
| < 0.50 | Poor | Least Suitable |
| 0.50 - 0.59 | Below average | |
| 0.60 - 0.69 | Average | Less Suitable |
| 0.70 - 0.79 | Good | Moderately suitable |
| > 0.8 | Excellent | Highly suitable |
MaxEnt modelling
Species presence data along with GIS (geographical information system) database was used to model the habitat suitability of kalij pheasant through MaxEnt (Maximum Entropy Modelling) software, version 3.4.4. By using presence data environmental layers were formed and calculated the probability of occurrence of species . Furthermore, area based on habitat suitability was also calculated using MaxEnt output.
Elevation data were obtained from Earth Resources Observation and Science through Shuttle Radar Topography Mission (SRTM) 1 Arc-Second Global data set and land cover from Global Land Cover Characterization (GLCC) US geological survey (EROS, 2017). A slope dataset was developed using spatial analyst of ArcGIS using SRTM one Arc Second global DEM. Precipitation and temperature data of 1km spatial resolution from world climate surface for global land area . The importance of the environmental variables was evaluated by Jackknife test .
Results
Species presence data
Kalij pheasant was distributed in different areas of Mirpur Division and their presence was recorded from 166 sites of the study area. We have directly observed 104 kalij pheasant including (Juvenile (15), Male (48), Female (41)) from 51 sites. Maximum (7) kalij pheasants were sighted at Gaian (Male (4), Female (3)) and Pona Knad (Juvenile (4), Male (1), female (2)) while minimum (1) in Kathar, Jair dhara. Pir Klinger, Pir Lasura, Glater palian, Sair mandi, Burjan, Sahar, Chowki mong, Dabsi, and Sohana. Indirect evidence (Fecal (262), Calls (51), Feathers (325) and Footprints (2)). Four kalij pheasants (Male (02), Female (02)) were captured in camera traps from Durjan District Mirpur. The distribution of kalij pheasant was maximum (68.95%) in the range of 501m-1000m (Table II).
Table II. Percent occurrence frequency of Kalij pheasant related to environmental variables.
| Environmental variables | Description | Categories | Direct sighted | Indirect evidence | Total indirect | Total | PO (%) | |||
| Fecal | Calls | Feathers | Foot-print | |||||||
| Topographic | Elevation | Below 500m | 7 | 21 | 1 | 26 | 0 | 48 | 55 | 7.39 |
| 501m-1000m | 69 | 195 | 34 | 213 | 2 | 444 | 513 | 68.95 | ||
| 1001m and above | 28 | 46 | 16 | 86 | 0 | 148 | 176 | 23.65 | ||
| Slope | Below 30 | 6 | 16 | 3 | 21 | 0 | 40 | 46 | 6.18 | |
| 30-45 | 95 | 232 | 47 | 290 | 2 | 571 | 666 | 89.51 | ||
| Above 45 | 3 | 14 | 1 | 14 | 0 | 29 | 32 | 4.3 | ||
| Land Cover | Distance from agriculture land | 0m-200m | 74 | 133 | 27 | 171 | 2 | 333 | 407 | 54.70 |
| 201m-400m | 8 | 80 | 9 | 78 | 0 | 167 | 175 | 23.52 | ||
| 400m and above | 22 | 49 | 15 | 76 | 0 | 140 | 162 | 21.77 | ||
| Distance from forest | 0m-50m | 69 | 209 | 42 | 261 | 2 | 514 | 583 | 78.36 | |
| 51m-100m | 17 | 26 | 6 | 17 | 0 | 49 | 66 | 8.87 | ||
| 101m and above | 18 | 27 | 3 | 47 | 0 | 77 | 95 | 12.77 | ||
| Distance from water source | 0m-200m | 69 | 128 | 26 | 184 | 2 | 340 | 409 | 54.97 | |
| 201m-400m | 32 | 113 | 22 | 118 | 0 | 253 | 285 | 38.31 | ||
| 401m and above | 3 | 21 | 3 | 23 | 0 | 47 | 50 | 6.72 | ||
| Anthropogenic | Distance from road | 0m-200m | 42 | 117 | 26 | 128 | 0 | 271 | 313 | 42.07 |
| 201m-400m | 29 | 66 | 14 | 101 | 2 | 183 | 212 | 28.49 | ||
| 401m and above | 33 | 79 | 11 | 96 | 0 | 186 | 219 | 29.43 | ||
| Distance from human settlement | 0m-200m | 60 | 115 | 28 | 142 | 2 | 287 | 347 | 46.64 | |
| 201m-400m | 33 | 99 | 14 | 106 | 0 | 219 | 252 | 33.87 | ||
| 401m and above | 11 | 48 | 9 | 77 | 0 | 134 | 145 | 19.48 | ||
Population density
The maximum population density (2.33/ha) of kalij pheasant was recorded from Gaian followed by Glater palian (1.67/ha), Kanad (1.33/ha), Jair (0.89/ha, 0.86/ha), while minimum (0.1/ha) from Maskeen Pur and Gwand localities respectively.
Ecogeographical variables
Evidence from the field showed that 89.51% kalij pheasants preferred 30o-45o slope while 6.18% were found below 30o. Only 4.3% were found at steep slopes above 45o. About 54.70% kalij were recorded near 0-200m the agriculture land followed by areas 201m-400m away from agriculture land (23.52%) and the lowest (21.77%) occurrence recorded in areas 401m and above (Table II).
Kalij pheasants were documented mostly (78.36%) near (0-50m) the forest and 8.87% (51-100m) and 12.76% away (101m and above) from forest, respectively. The activities of kalij pheasant were recorded highest (54.97%) nearest water source (0-200m), followed by sites (201-400m, 38.31%) (401m and above 6.72%) away from water source respectively. The occurrence of kalij was recorded highest (42.069%) near to road (0-200m), followed by 28.49% (201m-400m) and 29.43% (401m and above) respectively. The direct and indirect evidence showed that kalij pheasant occurs mostly (46.64%) near (0-200m) human settlements followed by (33.87%) at a distance of 201-400m and the lowest (19.49%) was recorded at 401m and above (Table II).
Kalij pheasant were sighted mostly (n=38) at 7am-8am, followed by (n=17, n=16, n=14) at 3pm-4pm, 4pm-5pm and 5pm-6pm respectively. Direct sighting was average (n=7) at 5am-6am and 8am-9am while minimum (n=3) at 6pm-7pm (Fig. 2).
Habitat suitability index
The habitat suitability index based upon availability of water, food, vegetation cover, cultivation, human settlement, hunting, predation pressure, disturbance from 166 study sites showed that ten sites fell into the criteria of highly suitable (Table III) followed by moderately suitable (n=63), less suitable (n=75) and least suitable (n=18) was recorded (Fig. 3). Highly suitable sites included Gaian (02 sites), Pir Lasura (02 sites), Sohana, Majhan, Dabsi, Chapar, Chameri, and Thalarajwali.
Table III. Habitat Suitability Index value of highly suitable sites.
| Study site | Elevation(m) | Direct sighting | Indirect evidence | Camera trapping | HSI |
| Gaian | 621 | - | + | + | 0.8181 |
| Gaian 1 | 565 | + | + | - | 0.8171 |
| Pir Lasura | 1435 | - | + | - | 0.8095 |
| Pir Lasura 1 | 1689 | + | + | + | 0.8095 |
| Sohana | 1137 | + | + | + | 0.8076 |
| Majhan | 1483 | + | + | - | 0.8062 |
| Dabsi | 1484 | - | + | - | 0.8033 |
| Chapar | 981 | - | + | - | 0.8021 |
| Chameri | 913 | - | + | + | 0.8021 |
| Thalarajwali | 558 | + | + | - | 0.8007 |
Environmental variables and MaxEnt modelling
Elevation of study area varies from Mirpur to Bhimber lower altitude towards higher altitude of district Kotli. Land cover is shown by low and high values of land cover. Precipitation and temperature also fluctuated throughout the areas (Fig. 4). The AUC value obtained from MaxEnt modelling was 0.802 which was predicted for the suitable habitat of kalij pheasant for an altitudinal range of 381m to 1689m from Mirpur Division AJ and K as shown in Receiver Operating Curve (ROC) (Fig. 3). A high value of AUC validates the model accuracy. The model generated for the predicted distribution of kalij pheasant reveals that warmer colours show areas with better predicted conditions. White dots show the presence locations used for training, while violet dots show test locations (Fig. 4). Analysis of each environmental variable’s contribution during modelling revealed that temperature emerged as a significant contributor with 82.3% (Fig. 5) that influenced the spatial distribution of kalij pheasant in Mirpur Division AJandK. Similarly, in the Jackknife test, temperature was found to be the prime environmental variable (Fig. 6).
Suitable area for the kalij pheasant
The area predicted for the suitability of kalij pheasant can be divided into three categories i.e., highly suitable (>85%), moderately suitable (71–85%), least suitable (51–70%). The model identified the highly suitable (406.03km2), moderately suitable (626.13 km2) and least suitable (1302.18Km2) area, respectively from the total area (4388Km2) for kalij pheasant .
Discussion
Pheasants are considered bioindicators of the quality of an environment. Kalij pheasant are distributed in Pakistan in the eastern Himalayas, Northern India, Nepal, Bhutan, Sikkim, Assam, South through Burma to Western Thailand. Kalij pheasant was confirmed in protected areas of Mizoram, India by Lalthanzara et al. (2011) and suggested that they are resident and present in many parts of the state. Sailo et al. (2013) also carried out a study in Mizoram, India to find out the spatial distribution of pheasants and reported kalij pheasant from all study sites. Sathyakumar et al. (1993) studied the habitat use and density estimate by kalij in the Kedarnath Wildlife Sanctuary. They found that kalij was present commonly in eastern Himalaya in low canopy and grass cover, while tree density and cover of shrubs was high. They preferred mostly moderate grass, shrub and tree cover in the western Himalayas. Yadav et al. (2019) reported the first time kalij pheasant from Banke National Park south-west Nepal and suggested that the density of kalij pheasant was low and localized to specific areas. Shafiq and Saqib (2011) reported the distribution of kalij pheasant from Kaghan Valley, Pakistan from Battagram Khyber Pakhtun Khwa, Chandio et al. (2019) from Margalla Hills National Park. Previous study reported the distribution of kalij pheasant from different areas of AJandK including Awan et al. (2012) from Salkhala Game Reserve Neelum valley, Faiz et al. (2015) from Tolipir National Park, Khalid et al. (2017) from Rawlakot city and its surrounding. Akrim et al. (2018) reported kalij pheasant from Pir Lasura National Park district Kotli AJ and K and we also confirmed their distribution from other districts of Mirpur Division by camera trapping, direct and indirect evidence.
During the study, it was noted that kalij pheasant was distributed at an elevation range of 381-1689m asl from different patches of the study area. Kalij pheasant is mostly sedentary from 600-3400 m elevation in forested foothills and mountainous areas along with woodland roads ; . The altitudinal range recorded from Nepal was 245-3700m . Delacour (1977) found kalij in evergreen and deciduous forests up to 3,300 m elevation. Our results are in line with Kukreti (2015) who studied the distribution, habitat ecology of Kalij in Garhwal, Himalayas, India and sighted the kalij between 700m-2000m altitude and habitat of subtropical deciduous forest, mixed pine and broad leaved temperate forest.
Kalij pheasants were often seen in the vicinity of water, which they correspondingly visit recurrently. Dohling and Sathyakumar (2011) reported the presence of kalij pheasant in Nongkhyllem Wildlife Sanctuary, Meghalaya, India nearby water and moist habitat. They feed in dense grounds at dawn and again at later evening. They take rest during the day, routinely on the ground under dense bushes. The activity of kalij pheasant at night was also noted which is in line with the study of Bump and Bohl (1961) who stated that they roosted on trees of 20-40 feet of height at night for rest and used same tree except when they were disturbed.
Although these pheasants are shy but still, we sighted 104 kalij pheasants directly and maximum abundance (2.33/ha) was recorded from the Gaian locality. Pheasant habitat depends on vegetation and forested area which may differ from open to closed cover with rise of shrub cover. Kalij pheasants were scattered in the closed cover forest with small fractions of shrub, grass and herb density. Similar findings were reported by Hussain and Sultana (2013) who studied the ecological habitat variables among pheasant species of the Himalayas and noted that altitude was an important factor that distinguished the segregation of species. Kukreti (2015) observed 685 kalij pheasants in 228 sightings. Selvan et al. (2013) recorded the density (6.7/km2) of kalij pheasant from eastern Himalayas of Arunachal Pradesh, India. Hussain et al. (2001) sighted 67 groups of kalij in Kumaon Himalayas, India and described that kalij pheasants were linked with plant cover having medium tree cover and tall shrub layer of the forested area at lower altitude. Dohling and Sathyakumar (2011) observed 2.85 birds/km2 from Nongkhyllem Wildlife Sanctuary, Meghalaya, India. Habitat provides basic necessities to all animals which include food, shelter and water depends on particular habitat where species have existed and fulfil its needs .
During the study camera trapping and direct sighting showed that kalij pheasant were active mostly 4am-9am and 3pm-7pm in different seasons. Similar findings were reported by Selvan et al. (2013) from Arunachal Pradesh, India that the estimated activity pattern of kalij pheasant was 8.29hrs ± 0.18hrs starting before dawn till the evening. The highest number of kalij were seen between 7am-8am and 4pm-5pm which proved their activity pattern during the day.
The presence of pheasants is associated with suitable vegetation because they select small patches with regular edges. Herbaceous and bushy cover supply food and protection from predators and severe weather . Kalij pheasant is adapted to different habitats like deciduous, evergreen, thickest forest, cultivated areas near to forest and water source . The kalij pheasant was recorded highest (54.97%) nearest water source (0-200m), near (0-50m) to forest (78.36%), preferred (89.516%) slope (30o-45o) areas. It was also noted by Shuai et al. (2007) at Taihe Nature Reserve in China that habitat variables like vegetation cover, distance to roads and slope played important role in the selection of proper habitat and nests by common pheasant (Phasianus colchicus). Li et al. (2009) found that these variables affect the foraging habitat selection of common pheasants in Huanglong Mountains, China. Kalij pheasants were found mostly near to forest because they need food, dense cover and more sloping areas to hide from predators. Water availability was a key component of the habitat as they needed regularly as they were present nearest to water source.
The predicted omission rate is a straight line while our results are near to the predicted omission rate. The omission line lies below because training and test data are not independent. The Maxent model predicted that environmental variables affected the distribution of kalij pheasant. According to study areas, defined by environmental data AUC values were higher for species with narrow ranges. If AUC values of the model over 0.8 or 0.9, then model, is good or very good and our results showed the value of AUC (0.802) showing the model well. Song et al. (2020) also studied the habitat suitability of brown eared pheasant from two nature reserve of Beijing and Hebei, China. Both HSI score and MaxEnt model revealed that Gaian, Pir Lasura, Majhan, Dabsi, Chapar, Chameri and Thalarajwali are highly suitable sites for species providing all requirements. There is food and water scarcity in some seasons of the year and they migrate to other areas and even come to near human settlements in agriculture land which exposes them. Habitat destruction, hunting and forest fire were recorded from different sites which affect badly their population and even remove them from some areas.
The study area has a large potential for suitable habitat of kalij pheasant. Due to population in patches, they should be introduced in other areas fulfilling the requirement of kalij and proper monitoring can increase their numbers. The protection of kalij from local communities and natural predators especially, during the breeding season is also vital for their survival. It was experienced from field visits many people were unaware about the ecological importance of the species.
Conclusion
Kalij pheasants have a patchy distribution in the study area. MaxEnt model was used to predict the species distribution by using species presence data and five environmental variables (slope, elevation, temperature, precipitation and land cover). The AUC value of model was 0.802 showing the good model performance. An area of 9.25% was found to be highly suitable habitat for kalij pheasant as per the model. Their suitable habitat was associated with food, water availability, dense cover, sloping areas, elevation, precipitation and temperature in the study area. The sites identified as highly suitable (Gaian, Pir Lasura, Majhan, Dabsi, Chapar, Chameri, and Thalarajwali) must be protected for conservation of kalij pheasant at present as well as in future. The current study can be considered as an initiative for the conservation and management of kalij pheasant in the identified hotspots of kalij pheasant.
Acknowledgements
The authors are grateful to Haq Nawaz Yousaf, Abdul Ghaffar, Zahoor Arif, Waqar Ahmed, Zakir Hussain, Naqeeb Ullah Farooq Khan, Atiq ur Rehman, Waseem Riaz, Afzal Hussain and Muhammad Ansar for their help during the field work. We are thankful to IDEA WILD, USA for providing equipment to conduct this research study.
Statement of conflict of interest
The authors have declared no conflict of interest.
Figures
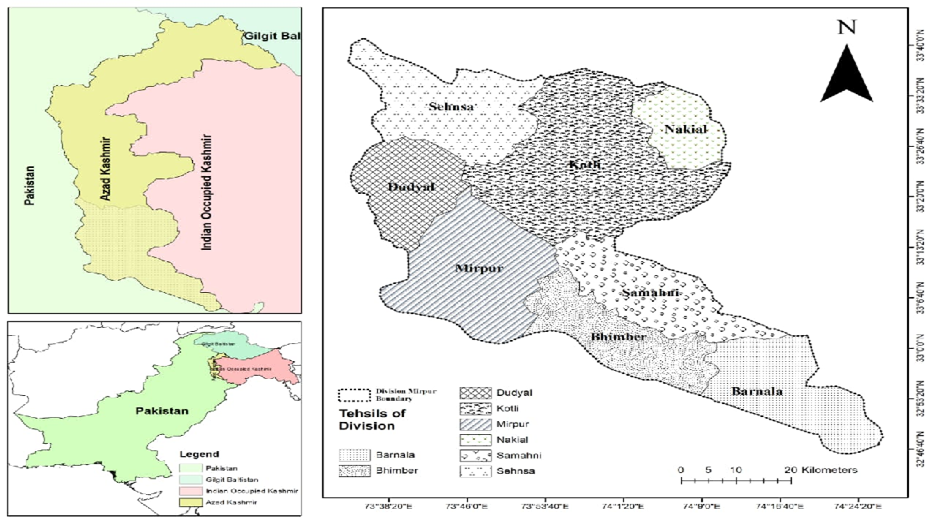
Map of Mirpur Division Azad Jammu and Kashmir.
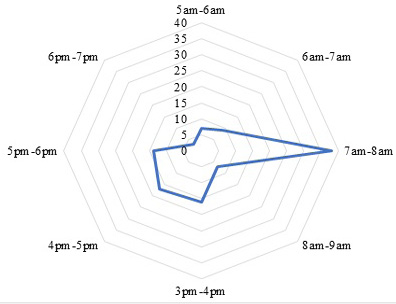
Activity pattern of kalij pheasant in study area.
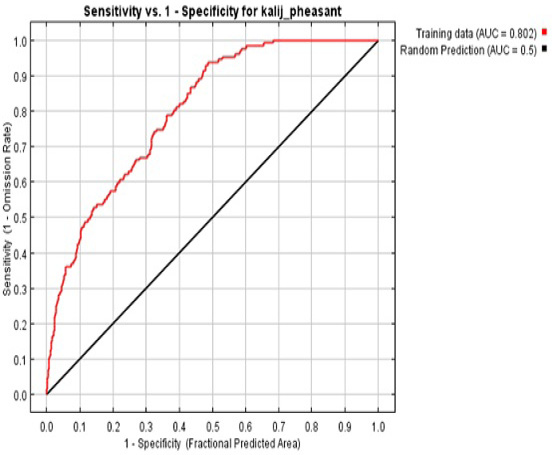
AUC sensitivity and specificity for kalij pheasant.
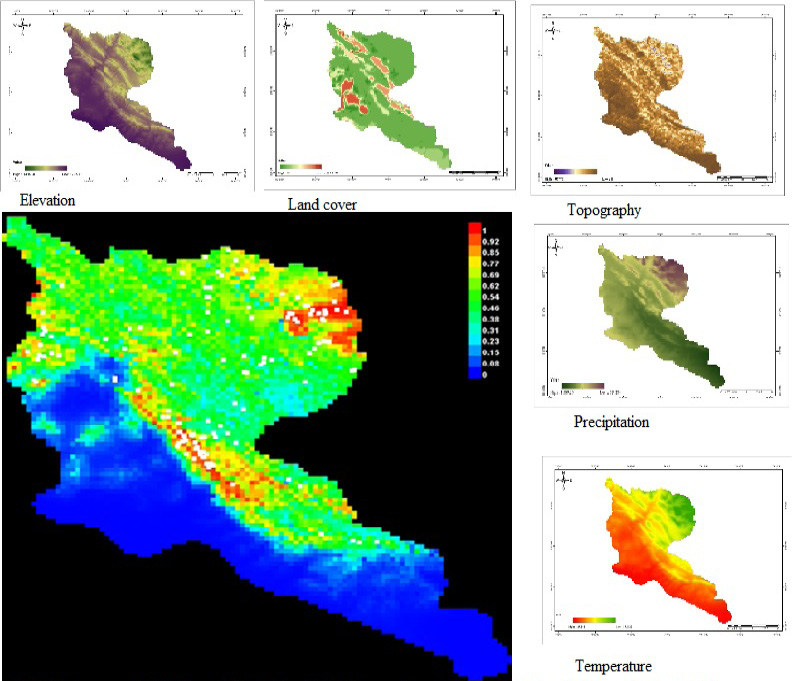
Environment variables and distribution of pheasant through MaxEnt Modelling in Mirpur division AJ and K.
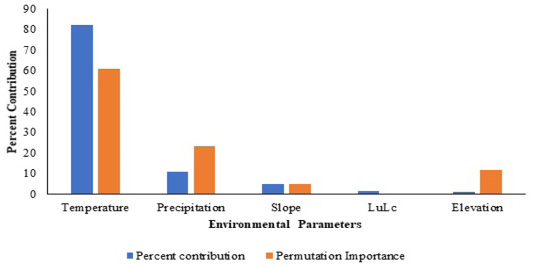
Environmental variables contribution in habitat suitability.
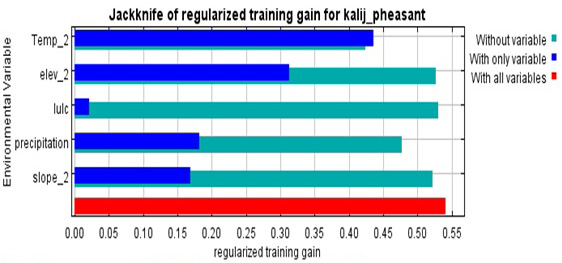
Importance of variable through Jackknife for kalij pheasant.
References
- Ali, S. and Ripley, S.D., 1983. Handbook of birds of India and Pakistan. Oxford University Press. pp. 93-96.
- Akrim, F., Mahmood, T., Nadeem, M.S., Andleeb, S., and Qasim, S., 2018. Spatial distribution and dietary niche breath of common leopard Panthera pardus in north-eastern Himalayan region of Pakistan. Turk. J. Zool., 42: 585-595. https://doi.org/10.3906/zoo-1803-2[CrossRef]
- Andleeb, S., Shamim, S., Awan, M.N., and Minhas, R.A., 2012. Modified protocol for genomic extraction of newly plucked feathers of Lophura leucomelana hamiltoni Galliformes for genetic studies and its Endo-restriction analysis. Pak. J. Sci. Ind. Res. Ser. B. Biol. Sci., 55: 108-113. https://doi.org/10.52763/PJSIR.BIOL.SCI.55.2.2012.108.113[CrossRef]
- Araujo, M.B., Pearson, R., Thuiller, W., and Erhard, M., 2005. Validation of species climate impact models under climate change. Glob. Change Biol., 11: 1504–1513. https://doi.org/10.1111/j.1365-2486.2005.01000.x[CrossRef]
- Awan, M.N., Ali, H., and Li, D.C., 2012. An annotated checklist of birds and conservation issues in Salkhala Game Reserve, an isolated Important Bird Area in Azad Kashmir, Pakistan. Forktail, 28: 38–43.
- Azad Jammu and Kashmir Wildlife (Protection, Preservation, Conservation and Management) Act, 2015.
- Bohl, W.H., 1971. The Kalij Pheasants. U.S. Fish and Wildlife Service, Foreign Game Investigations Rept. pp. 18.
- Buckland, S.T., Anderson, D.R., Burnham, K.P., Laake, J.L., Borchers, D.L., and Thomas, L., 2001. Introduction to distance sampling: Estimating abundance of biological populations. Oxford University Press, Oxford. pp. 432.
- BirdLife International, 2016. Lophura leucomelanos. IUCN Red List of threatened species. http://www.birdlife.org.
- BirdLife International, 2021. Lophura leucomelanos. IUCN Red List of threatened species. http://www.birdlife.org.
- Bump, G. and Bohl, W.H., 1961. Red Junglefowl and Kalij pheasant. US Fish and Wildlife Service, Special Scientific report, Wildlife No. 62.
- Chandio, S.M., Ahmed, S.M., Bhutto S.A., Sanjrani, M.A., Khaskheli, N.A., 2019. Impact of natural events and anthropogenic activities on the biodiversity of Margallah Hills National Park Islamabad. N. Am. Acad. Res., 2: 20-32.
- Conroy, M.J. and Noon, B.R., 1996. Mapping of species richness for conservation of biological diversity: Conceptual and methodological issues. Ecol. Appl., 6: 763–773. https://doi.org/10.2307/2269481[CrossRef]
- Delacour, J., 1977. The pheasants of the world. Saiga Publishing Company Ltd. Surrey England.
- Dohling, L.M. and Sathyakumar, S., 2011. Relative Abundance of Galliformes in Nongkhyllem Wildlife Sanctuary, Meghalaya. NeBIO. 2: 4-8.
- Earth Resources Observation and Science (EROS) Center, 2017. Shuttle Radar Topography Mission (SRTM) 1 Arc-Second Global (Data set). U.S. Geological Survey.
- Earth Resources Observation and Science (EROS) Center, 2017. Global Land Cover Characterization (GLCC) (Data set). U.S. Geological Survey.
- Elith, J., Graham, C.H., Anderson, R.P., Dudik, M., Ferrier, S., Guisan, A., Hijmans, R.J., Huettmann, F., Leathwick, J.R., Lehmann, A., 2006. Novel methods improve prediction of species’ distributions from occurrence data. Ecography, 29: 129–151. https://doi.org/10.1111/j.2006.0906-7590.04596.x[CrossRef]
- Elith, J., and Leathwick, J.R., 2009. Species distribution models: Ecological explanation and prediction across space and time. Ann. Rev. Ecol. Evol. Syst., 40: 677-697. https://doi.org/10.1146/annurev.ecolsys.110308.120159[CrossRef]
- Elith, J., Phillips, S.J., Hastie, T., Dudik, M., Chee, Y.E., Yates, C.J., 2011. A statistical explanation of MaxEnt for ecologists. Divers. Distrib. 17: 43-57. https://doi.org/10.1111/j.1472-4642.2010.00725.x[CrossRef]
- Faiz, A.H., Abbas, F.I., Ali, Z., Zahra, L., 2015. Avifaunal diversity of Tolipir National Park Azad Jammu and Kashmir Pakistan. J. Anim. Pl. Sci., 25: 404-409.
- Furqan, M. and Ali, Z., 2022. Feeding ecology, threats and Conservation Management of Kalij Pheasant (Lophura leucomelanos) in Azad Jammu and Kashmir, Pakistan. Pakistan J. Zool., 54: 2543-2551. https://doi.org/10.17582/journal.pjz/20200816170856[Full text][CrossRef]
- Fick, S.E. and Hijmans, R.J., 2017. Worldclim 2: New 1-km spatial resolution climate surfaces for global land areas. Int. J. Clim. 37: 4302-4315. https://doi.org/10.1002/joc.5086[CrossRef]
- Fuller, R.A. and Garson, P.J., 2000. Pheasants. Status Survey and Conservation Action Plan 2000–2004. WPA/ BirdLife/SSC Pheasant Specialist Group. IUCN.
- Graham, C.H., Ferrier, S., Huettman, F., Moritz, C., and Peterson, A.T., 2004. New developments in museum‐based informatics and application in biodiversity analysis. Trends Ecol. Evol., 19: 497–503. https://doi.org/10.1016/j.tree.2004.07.006[CrossRef]
- Guisan, A. and Thuiller, W., 2005. Predicting species distribution: Offering more than simple habitat models. Ecol. Lett., 8: 993–1009. https://doi.org/10.1111/j.1461-0248.2005.00792.x[CrossRef]
- Guisan, A. and Zimmermann, N.E., 2000. Predictive habitat distribution models in ecology. Ecol. Model., 135: 147–186. https://doi.org/10.1016/S0304-3800(00)00354-9[CrossRef]
- Haq, F., 2012. The Critically Endangered Flora and Fauna of District Battagram Pakistan. Adv. Life Sci., 2: 118-123. https://doi.org/10.5923/j.als.20120204.07[CrossRef]
- Hirzel, A.H., Helfer, V., and Metral, F., 2001. Assessing habitat-suitability models with a virtual species. Ecol. Model., 145: 111–121. https://doi.org/10.1016/S0304-3800(01)00396-9[CrossRef]
- Hirzel, A.H., Hausser, J., Chessel, D., Perrin, N., 2002. Ecological niche factor analysis: how to compute habitat suitability maps without absence data. Ecological, 83: 2027-2036. https://doi.org/10.1890/0012-9658(2002)083[2027:ENFAHT]2.0.CO;2[CrossRef]
- Hussain, S.H., Khan, J.A., Kaul, R., 2001. Aspects of ecology and conservation of Kalij Lophura leucomelana and Koklas Pucrasia macrolopha in the Kumaon Himalaya, India. Trop. Ecol., 42: 59-68.
- Hussain, M.S. and Sultana, A., 2013. Ecological separation of habitat variables among five rare pheasant species of the Himalayas, India. Zoo. Ecol., 23: 97-103. https://doi.org/10.1080/21658005.2013.795041[CrossRef]
- Inskipp, C., Baral, H.S., Phyuyal, S., Bhatt, T.R., Khatiwada, M., Inskipp, T., Khatiwada, A., Gurung, S., Singh, P.B., Murray, L., Poudyal, L., Amin, R., 2016. The status of Nepal’s birds: The national red list series. Zoological Society of London, UK.
- Johnsgard, P.A., 1999. Pheasants of the world. Biology and Natural History. Swan Hill Press, London.
- Khalid, S., Awan, M.S., Minhas, R.A., Ashraf, N., Ahmed, K.B., Shafi, N., and Abbasi, S., 2017. Distribution and habitat use of avian fauna of Rawlakot city and its surrounding, Azad Jammu and Kashmir Pakistan. Pakistan J. Zool., 49: 2331-2334. https://doi.org/10.17582/journal.pjz/2017.49.6.sc4[CrossRef]
- Kinnaird, M.F., Sanderson, E.W., O’Brien, T.G., Wibisono, H.T., and Woolmer, G., 2003. Deforestation trends in a tropical landscape and implications for endangered large mammals. Consv. Biol., 17: 245–257. https://doi.org/10.1046/j.1523-1739.2003.02040.x[CrossRef]
- Kukreti, M., 2015. Ecology of widespread white crested kalij pheasant (Lophura leucomalano hamiltoni) in Garhwal Himalaya India. J. Glob. Sci., 4: 1245-1249.
- Lalthanzara, H., Vanramliana, and Lalramliana, 2011. Pheasants of Mizoram (India): Present status of diversity and distribution. Sci, Vis., 11: 218-223.
- Le Lay, G., Clergeau, P., Hubert-Moy, L., 2001. Computerized map of risk to manage wildlife species in urban areas. Environ. Manage., 27: 451–461. https://doi.org/10.1007/s002670010161[CrossRef]
- Li, H.Q., Zhen, L., Chen, C.G., 2009. Winter foraging habitat selection of brown-eared pheasant (Crossoptilon mantchuricum) and the common pheasant (Phasianus colchicus) in Huanglong mountains, Shaanxi province. Acta Ecol. Sin., 29: 335–340. https://doi.org/10.1016/j.chnaes.2009.09.013[CrossRef]
- McGowan, P.J.K. and Panchen, A.L., 1994. Plumage variation and geographical distribution in the Kalij and Silver pheasants. Bull. Br. Ornith. Club. 114: 113-123.
- Nawaz, R., Garson, P.J., and Malik, M., 2000. Monitoring pheasant populations in montane forest: some lessons learnt from the Pakistan Galliformes project. Proc. 2nd Int. Gallifo Symp W Pheas Assoc. Reading. pp. 196-209.
- Nelli, L., Meriggi, A., and Vidus, R.A., 2012. Effects of habitat improvement actions (HIAs) and reforestations on pheasants Phasianus colchicus in northern Italy. Wildl. Biol., 18: 121–130. https://doi.org/10.2981/11-022[CrossRef]
- Ortigosa, G.R., Leo, G.A.D., and Gatto, M., 2000. VVF: Integrating modelling and GIS in a software tool for habitat suitability assessment. Environ. Model Softw., 15: 1–12. https://doi.org/10.1016/S1364-8152(99)00029-8[CrossRef]
- Phillips, S.J., Anderson, R.P., and Schapire, R.E., 2006. Maximum entropy modeling of species geographic distributions. Ecol. Model., 190: 231–259. https://doi.org/10.1016/j.ecolmodel.2005.03.026[CrossRef]
- Roberts, T.J., 1991. The birds of Pakistan, Non-Passeriformes. Oxford University Press, Oxford, UK. pp. 243-245.
- Sailo, L., Solnaki, G.S., Ramanujam, S.N., and Lalthanzara, H., 2013. Survey on distribution of pheasants (Galliformes) in Mizoram, India. Sci. Vision, 13: 90-95.
- Sathyakumar, S., Prasad, S.N., and Rawat, G.S., 1993. Ecology of Kalij and Monal pheasants in Kedharnath Wildlife Sanctuary, Western Himalaya. In: Jenkins, D. Ed. Pheasants in Asia 1992. World Pheasant Association, UK.
- Sathyakumar, S. and Sivakumar, K.E., 2007. Galliformes of India. ENVIS Bulletin. Wildl. Prot. Areas, Wildl. Inst. India, Dehradun, India, 10: 252.
- Scott, J.M., Heglund, P.J., Morrison, M.L., Haufler, J.B., Raphael, M.G., Wall, W.A., and Samson, F.B., 2002. Predicting Species Occurences. Issues of Scale and Accuracy. Island Press, Washington.
- Selvan, K.M., Lyngdoh, S., Veeraswami, G.G., and Habib, B., 2013. An assessment of abundance, habitat use and activity pattern of three sympatric pheasants in an eastern Himalayan Lowland tropical forest of Arunachal Pradesh, India. Asian J. Consv. Biol., 2: 52-60.
- Shuai, L., Zhou, C.Q., Wang, W.K., Wei, W., and Hu, J.C., 2007. The habitat and nest-site selection of common pheasants in spring and summer in Nanchong, China. Zool. Res., 28: 249–254.
- Shafiq, M.M. and Saqib, M., 2011. Status and conservation of pheasants in Kaghan Valley. Pak. J. For., 61: 29-41.
- Singh, H., Kumar, N., Kumar, M., and Singh, R., 2020. Modelling habitat suitability of western tragopan (Tragopan melanocephalus) a range-restricted vulnerable bird species of the Himalayan region, in response to climate change. Clim. Risk Manage., 29: 100241. https://doi.org/10.1016/j.crm.2020.100241[CrossRef]
- Song, k., Mi, C.R., Yang, N., Sun, L., Sun, Y.H., and Xu, J.L., 2020. Improve the roles of nature reserves in conservation of endangered pheasant in a highly urbanized region. Sci. Rep., 10: 1-7. https://doi.org/10.1038/s41598-020-74724-3[CrossRef]
- Smeraldo, S., Febbraro, M.D., Cirovic, D., Bosso, L., Trbojevic, I., Russo, D., 2017. Species distribution models as a tool to predict range expansion after reintroduction: A case study on Eurasian beavers (Castor fiber). J. Nat. Consv., 37: 12–20. https://doi.org/10.1016/j.jnc.2017.02.008[CrossRef]
- White, G.C. and Garrott, R.A., 1990. Analysis of wildlife radio tracking data. Academic press. London.
- Yadav, S.K., Subedi, A., and Baral, R., 2019. First evidence of kalij pheasant (Lophura leucomelanos) in the Banke National Park, South-West Nepal. Birding Asia, 32: 124-125.
- Zaniewski, A.E., Lehmann, A., and Overton, J.M., 2002. Predicting species spatial distributions using presence-only data: A case study of native New Zealand ferns. Ecol. Model., 157: 261-280. https://doi.org/10.1016/S0304-3800(02)00199-0[CrossRef]
Cited by 1 article
In journals published by ResearchersLinks.
Services
Article usage statistics
Loading…