
Genetic variation occurring naturally in germplasm is highly valuable resource of alleles that can be deployed for genetic improvement of a species. Screening of available genetic stock for detection of most diverse and high yielding genotypes is a pre requisite for a successful crop breeding program. For this purpose, a research experiment comprising of sixty-eight elite chickpea germplasm genotypes along with two commercial varieties were sown under tri-replicate randomized complete block design during the winter season of 2020-21. D2 statistics, principle component analysis and cluster analysis were employed to detect the most genetically variable and high yielding chickpea genotypes. D2 statistics extracted higher values for standard deviation and coefficient of variation indicating that the studied genotypes possess considerable amount of genetic variation in performance of studied different traits. Principle component analysis distinguished the traits into eight components. Results revealed that PC1 and 2 extracted >1 Eigen values explaining that these components have major contribution in genetic variability. Cluster analysis distributed the genotypes into four distinguished clusters. Agglomerative dendrogram of genotypes was constructed by Ward’s method. On the basis of Euclidean distance it was observed that members of cluster 3 (G.P-110, G.P-111, G.P-115, G.P-116, G.P-121, G.P-125, G.P-138, G.P-139, G.P-150, G.P-151, G.P-164, G.P-165) and cluster 4 (G.P-112, G.P-126, G.P-140, G.P-152, G.P-166) were most diverse. Results also showed that the genotypes of cluster 3 were high yielding and genetically diverse as well. Therefore, they may be preferred while making selections for chickpea genetic improvement program.
Research Article · Volume 35, Issue 1, 24 February 2022 · Open Access
Genetic Studies for Detection of Most Diverse and High Yielding Genotypes among Chickpea (Cicer arientinum L.) Germplasm
· · · · · ·
Affiliations & Notes ⌄
- 1Gram Breeding Research Station, Kallurkot, Pakistan
- 2Pulses Research Institute, AARI, Faisalabad, Pakistan
- 3Arid Zone Research Institute, AZRI, Bhakkar, Pakistan
- 4Regional Agricultural Research Institute, RARI, Bahawalpur, Pakistan
- 5Plant physiology program, Crop Sciences Institute, NARC, Islamabad, Pakistan. Muhammad Tariq Mahmood, Gram Breeding Research Station, Kallurkot, Pakistan
- 6Email: taqaisrani@gmail.com
Article Info ⌄
- Journal:
- Pakistan Journal of Agricultural Research
- Published:
- 24 February 2022
From the article
- D2 statistics revealed higher values for standard deviation, coefficient of variation and wide ranges values indicating that the studied genotypes varied significantly in performance of different traits (Table 1).
- PCA revealed that sufficient amount of genetic diversity exists among studied traits.
- Cluster analysis distributed the genotypes into four distinguished clusters.
- Results indicate that the members of cluster-3 (G.P-110, G.P-111, G.P-115, G.P-116, G.P-121, G.P-125, G.P-138, G.P-139, G.P-150, G.P-151, G.P-164, and G.P-165) are more diverse in performance of different traits and high yielding as well.
Selected from the article's own text.
Abstract
Introduction
Chickpea (Cicer arientinum L.), is third most grown pulse legume crop across the globe. It is an important food legume crop of tropical and subtropical climates of world Domestication of chickpea by humans dates back to 10,000 years ago . About 6000 years ago, its cultivation spread from Fertile Crescent of southeastern Anatolia, Turkey . Besides its nutritional value, chickpea improves the soil fertility through symbiotic nitrogen fixation. Recently chickpea is being grown in more than 50 countries of the world . Pakistan ranks 3rd in chickpea producing countries but far below than world’s average chickpea productivity per unit area . Its yield potential has been seriously hampered due to narrow genetic base and several biotic and abiotic stresses. Narrow genetic base and lack of high yielding commercial cultivars are the most important factors for declining chickpea yields per unit area. Most of the commercial varieties of chickpea are vulnerable to climatic changes and have limited adaptability to diversified environments . Existence of variability among individuals guarantees the survival of species in nature and pre requisite for a successful crop genetic advancement program ; .
Genetic variation among individuals of a species is highly useful for breeders to identify and select the most desirable genotypes for the breeding programs ; . Estimation of genetic variation and its exploitation in hybridization programs is highly valuable for a successful crop breeding program . Among germplasm, each genotype has a specific genetic makeup differing from other genotypes therefore, provide more options to researchers for selection of desirable genotypes ; .
Exploration of genetic variability of germplasm and assessment of patterns of genetic diversity assists the breeders to identify and select the most appropriate parental types from a mixed population. . D2 statistics, principal component and cluster analysis have been found very important series statistical methods for variability assessment of large scale crop data and widely utilized by several crop breeders ; ; .
Limited scientific progress has been made so far in Pakistan for screening and characterization of available chickpea germplasm ; . Therefore, the current study was planned for detection of the most diverse and high yielding genotypes among chickpea germplasm.
Materials and Methods
The present study for screening of genetic variability among sixty-eight elite chickpea germplasm lines along with two standard varieties was carried out at 71.165 0E and 32.920 0N (Gram Breeding Research, Station, Kallurkot, Pakistan) during 2020-21 crop season. Experimental material was laid down under tri-replicate RCBD design, keeping 4 rows each 30 cm apart and 10 cm distance between plants. Dibbler was used for sowing of entries by dropping two seeds in each hole and thinning was done after two weeks to ensure proper plant population. Repeated chemical spray of Emamectin Benzoate @ 800 ml per hectare was done to protect the crop from Helicoverpa armigera attack. Hoeing, weeding and irrigation were performed as per requirement of crop.
Data were recorded for wilt percentage, days required for 50 percent flowering, secondary branches, height of plants, number of pods, maturity days, hundred grain weight and yield kg ha-1. D2 statistics was employed following the method proposed by Mahalanobis (1928, 1936). For Cluster analysis and Principal component analysis STAR version 2.0.1 (Statistical Tool for Agricultural Research) was employed.
Table 1: Mean performance of different traits of chickpea germplasm.
| Traits | Range | Mean (µ) | Standard Deviation (σ) | CV values |
| Wilt percentage | 1-13 | 5.79 | 8.28 | 13.3 |
| Days to 50 % flowering | 94-114 | 105.3 | 9.24 | 16.5 |
| Secondary branches | 7-19 | 12 | 12.5 | 18.7 |
| Plant height (cm) | 50-89 | 62.5 | 9.48 | 19.5 |
| Number of pods | 36-106 | 66.9 | 20.56 | 26.5 |
| Maturity days | 141-165 | 151.2 | 8.86 | 15.4 |
| 100 Grains weight (g) | 22.2-28.4 | 24.9 | 2.62 | 5.8 |
| Yield kg ha-1 | 850-1650 | 1204 | 230.98 | 28.3 |
Results and Discussion
D2 statistics revealed higher values for standard deviation, coefficient of variation and wide ranges values indicating that the studied genotypes varied significantly in performance of different traits (Table 1). From the results it was obvious that sufficient amount of variation exists among the studied genotypes. Our results were in line to ; who also reported wide dispersion of data for range and coefficient of variation.
Principal component analysis (PCA) distributed the data into eight different components. Results showed
Table 2: Eigen values of variables in Principal Components.
| PC1 | PC2 | PC3 | PC4 | PC5 | PC6 | PC7 | PC8 | |
| Eigen values | 2.2997 | 1.0161 | 0.8333 | 0.7039 | 0.4973 | 0.3818 | 0.2368 | 0.1990 |
| Percentage of variance | 66.11 | 12.91 | 8.68 | 6.19 | 3.09 | 1.82 | 0.70 | 0.50 |
| Cumulative percentage | 66.11 | 79.02 | 87.70 | 93.89 | 96.98 | 98.80 | 99.5 | 100 |
Table 3: Extraction of variance in PCA.
| Variables | PC1 | PC2 | PC3 | PC4 | PC5 | PC6 | PC7 | PC8 |
| Wilt % | -0.3770 | 0.1047 | -0.3957 | 0.1686 | -0.6367 | 0.1593 | -0.2565 | 0.4066 |
| DF | -0.3279 | 0.0125 | 0.2002 | -0.8996 | -0.0046 | 0.0424 | -0.1326 | 0.1532 |
| SB | 0.3984 | 0.0346 | -0.1116 | -0.2601 | -0.6543 | 0.1851 | 0.3992 | -0.3881 |
| PH | 0.1042 | -0.9408 | -0.1464 | -0.684 | -0.1163 | -0.2272 | -0.0738 | 0.0852 |
| NPP | 0.4234 | -0.0089 | 0.0476 | -0.0514 | 0.1295 | 0.3208 | 0.3471 | 0.7586 |
| MD | -0.2845 | -0.2176 | 0.8111 | 0.2931 | 0.2270 | 0.2711 | 0.0467 | 0.0280 |
| GW | 0.3814 | 0.2306 | 0.3470 | -0.003 | -0.2866 | -0.6627 | -0.3175 | 0.2425 |
| YLD | 0.4184 | -0.0437 | 0.0350 | -0.0369 | 0.0505 | 0.5209 | -0.7269 | -0.1351 |
DF: Days to flowering; SB: Secondary branches; PH: Plant height; NPP: Number of pods plant-1; MD: Maturity days; GW: 100 grains weight; YLD: Yield kg ha-1.
that PC1 and 2 extracted > 1 Eigen values (2.299 and 1.0161 respectively) with a cumulative share of 79 percent in variation (Table 2). Highest percentage of variance was shared by PC1 (66.11 %) followed by PC2 (12.91 %), PC3 (8.68%) and PC4 (6.19%). A Scree plot was constructed for illustration of Eigen values of all components (Figure 1). Our results agree to Arora et al. (2018) and Mahmood et al. (2018). PCs presenting > 1 Eigen values have significant contribution towards variability the PCs having <1 values have non-considerable contributions towards genetic variability .
Data also revealed that in PC1 number of pods, yield kg ha-1, secondary branches and 100 grain weight extracted higher positive loadings indicating that maximum amounts of genetic variability was shared by these traits while wilt percentage, days to flowering and days taken to maturity contributed negatively (Table 3). Similarly, in PC2, grain weight, secondary branches wilt percentage and days to flowering showed positive loadings while negative contributions were exhibited by plant height, maturity days, yield kg ha-1 and number of pods plant-1. Our findings were in line to Lal et al. (2001) and Bisht et al. (2005).
Table 4: Mean and range values of various traits in different clusters.
| Traits | Cluster-1 | Cluster-2 | Cluster-3 | Cluster-4 | ||||
| Range | Mean | Range | Mean | Range | Mean | Range | Mean | |
| Wilt | 7-13 | 10.4 | 3-8 | 5.5 | 1-2 | 1.62 | 3-4 | 3.4 |
| DF | 103-113 | 108.8 | 101-114 | 106.7 | 94-104 | 97.6 | 101-104 | 103 |
| SB | 7-11 | 8.5 | 9-18 | 11.5 | 16-19 | 17.1 | 13-16 | 14.6 |
| PH | 52-60 | 54.9 | 50-74 | 63.7 | 52-70 | 59.9 | 83-89 | 86 |
| NPP | 36-48 | 41.2 | 52-78 | 64.7 | 96-106 | 100.5 | 80-84 | 82.4 |
| MD | 150-156 | 153.4 | 144-165 | 153.1 | 141-152 | 144.9 | 142-149 | 146.9 |
| GW | 22.2-24.6 | 23.6 | 22.8-26.8 | 24.5 | 26.4-28.4 | 27.3 | 25.4-25.9 | 25.7 |
| YLD | 850-1060 | 918 | 970-1380 | 1184 | 1460-1650 | 1554 | 1340-1460 | 1398 |
DF: Days to flowering; SB: Secondary branches; PH: Plant height; NPP: Number of pods plant-1; MD: Maturity days; GW: 100 grains weight; YLD: Yield kg ha-1.
Biplot was also constructed among PC1 and 2 (Figure 2). Biplot illustrated that the vectors for number of pods, yield kg ha-1, secondary branches and 100 grain weight were superimposed on plots indicating that these traits are most influential variable in construction of PC1. In PC2 grain weight, secondary branches wilt percentage and days to flowering exhibited positive contributions while all other traits contributed negatively. Our findings agree to the previous finding of Zubair et al. (2017), Sharifi et al. (2018) and Singh et al. (2021).
Cluster analysis distributed the genotypes into four distinguished clusters. Data revealed that the genotypes with maximum yield mean (1554 kg ha-1) and high values of other yield contributory traits i.e. maximum grain weight (27.3 g), number of pods (100), secondary branches (17) were grouped under cluster-3 followed by cluster-4 (Table 4). Likewise, maximum wilt (10.4 %), days to flowering (109) were recorded in cluster-1. Our findings agree to Upadhyaya et al. (2007), Pavan et al. (2017) and Singh et al. (2021).
Table 5: Cluster Membership of different genotypes.
| Clusters | No of members | Membership |
| Cluster-1 | 17 | G.P-101, G.P-102, G.P-103, G.P-104, G.P-117, G.P-118, G.P-129, G.P-130, G.P-131, G.P-132, G.P-143, G.P, 144, G.P-155, G.P-156, G.P-157, G.P-158, Punjab-2008. |
| Cluster-2 | 35 | G.P-105, G.P-106, G.P-107, G.P-108, G.P-109, G.P-113, G.P-114, G.P-119, G.P-120, G.P-122, G.P-123, G.P-27, G.P-128, G.P-133, G.P-134, G.P-135, G.P-136, G.P-137, G.P-141, G.P-142, G.P-147, G.P-148, G.P-149, G.P-153, G.P-154, G.P-159, G.P-160, G.P-161, G.P-162, G.P-163, G.P-167, G.P-168, Bittle-2016 |
| Cluster-3 | 13 | G.P-110, G.P-111, G.P-115, G.P-116, G.P-121, G.P-125, G.P-138, G.P-139, G.P-150, G.P-151, G.P-164, G.P-165 |
| Cluster-4 | 5 | G.P-112, G.P-126, G.P-140, G.P-152, G.P-166 |
Ward’s dendrogram of agglomerative clustering was also constructed on the basis of Euclidean distance (Figure 3). Germplasm entries were distributed among four distinguished clusters. Data also showed that 17 genotypes were grouped in cluster-1, 35 were gathered under cluster-2, 13 genotypes in cluster-3 and 5 in cluster-4 (Table 5). Dendrogram showed that maximum Euclidean distance was observed in cluster-3 and 4. Therefore the members of the cluster 3 (G.P-110, G.P-111, G.P-115, G.P-116, G.P-121, G.P-125, G.P-138, G.P-139, G.P-150, G.P-151, G.P-164, G.P-165) and cluster 4 (G.P-112, G.P-126, G.P-140, G.P-152, G.P-166) are most diverse in performance of different studied traits. On the other hand it was also found that the members of cluster 3 were diverse and high yielding as well, therefore they may be favored while making selections for chickpea genetic improvement program. Our results relate to the previous findings of Talebi and Rokhzadi (2013); Zubair et al. (2017) and Mahmood et al. (2018).
Conclusions and Recommendations
From the study following conclusions may be derived;
- Wide dispersion of data for standard deviation, range and coefficient of variation were evident that the germplasm entries varied significantly in performance of different traits.
- PCA revealed that sufficient amount of genetic diversity exists among studied traits. Results also revealed that the vectors for number of pods, yield kg ha-1, secondary branches and 100 grain weight extracted higher positive loadings and were superimposed on plots demonstrating that these traits are most influential in creation of genetic variability.
- Cluster analysis distributed the genotypes into four distinguished clusters. Results indicate that the members of cluster-3 (G.P-110, G.P-111, G.P-115, G.P-116, G.P-121, G.P-125, G.P-138, G.P-139, G.P-150, G.P-151, G.P-164, and G.P-165) are more diverse in performance of different traits and high yielding as well. Therefore, these genotypes may be favored while making selections for chickpea genetic advancement program.
Novelty Statement
Detection of most diverse and better performing genetic material from gene pool of land races is novel study and will be helpful for researchers and chickpea breeders.
Author’s Contribution
Muhammad Tariq Mahmood: Conceived idea and wrote manuscript.
Muhammad Akhtar: Technical inputs, superved and overall management of research study.
Kaiser Latif Cheema: Wrote results and discussion section.
Abdul Ghaffar: Did statistical analysis and interpretation of results.
Muhammad Jahanzaib Khalid: Recorded research data
Imtiaz Ali: Checked Plagiarism and necessary corrections.
Zeshan Ali: Did revision, citation and references section of the article.
Conflict of interest
The authors have declared no conflict of interest.
Figures
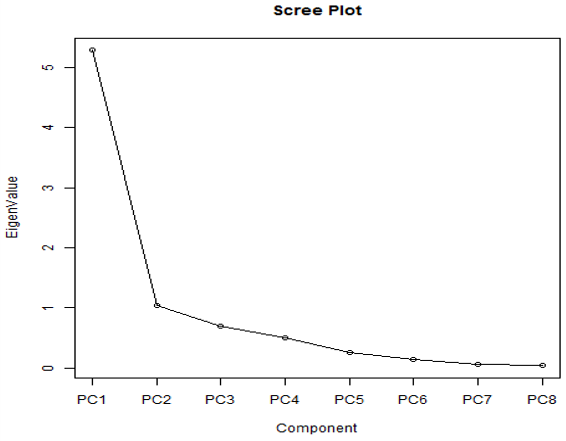
Scree plot showing Eigen values of principle components.
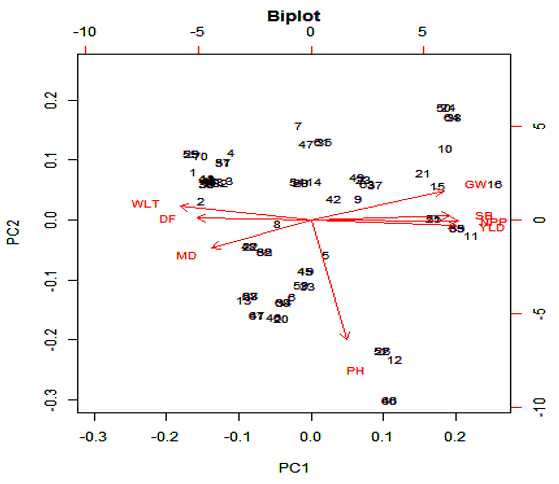
Biplot among PC1 and 2.
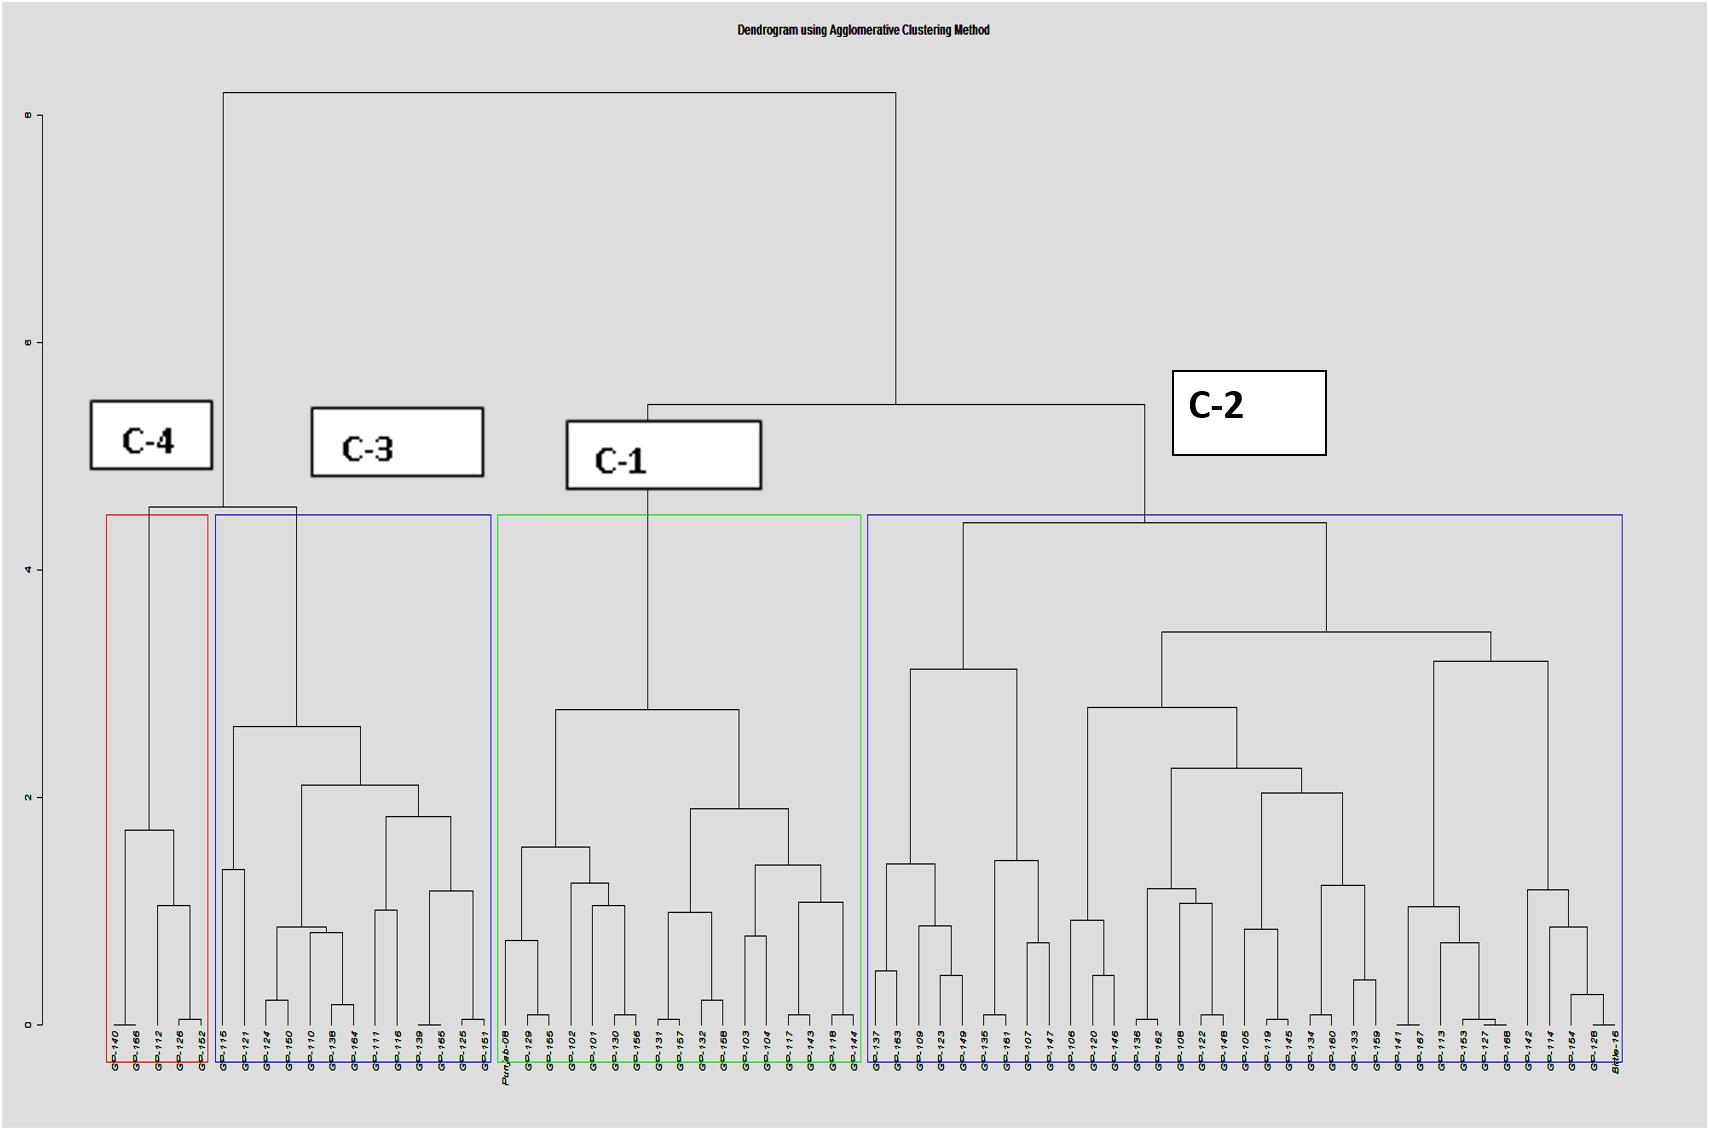
Ward’s Dendrogram of Agglomerative clustering.
References
- Abbo, S., R.J. Redden and S.S. Yadav. 2007. Utilization of wild relatives. In: S.S. Yadav, R.J. Redden, W. Chen, and B. Sharma, editors, Chickpea breeding and management. CAB International, Wallingford, UK. pp. 338–354. https://doi.org/10.1079/9781845932138.016[CrossRef]
- Abdi, H. and L.J. Williams. 2010. Principal component analysis. Wiley Interdiscip. Rev. Comput. Stat., 2(4): 433-459. https://doi.org/10.1002/wics.101[CrossRef]
- Agrawal, T., A. Kumar, S. Kumar, A. Kumar, M. Kumar, Satyendra and S. Perween. 2018. Assessment of genetic diversity in chickpea (Cicer arietinum L.) Germplasm under normal sown condition of Bihar. Int. J. Curr. Microbiol. Appl. Sci., 7(4): 3552-3560. https://doi.org/10.20546/ijcmas.2018.704.400[CrossRef]
- Arora, R.N., Kumar, K. and Manav. 2018. Principal component analysis in Kabuli chickpea (Cicer arietinum L.). Int. J. Chem. Stud., 6: 2767-2768.
- Bisht, I.S., K.V. Bhat, S. Lakhanpaul, M. Latha, P.K. Jayan, B.K. Biswas and A.K. Singh, 2005. Diversity and genetic resources of wild vigna species in India. Genet. Resour. Crop. Evol., 52: 53- 68. https://doi.org/10.1007/s10722-005-0286-0[CrossRef]
- Bulti, Y. and J. Haji. 2019. Economic importance of chickpea: Production, value, and world trade. Cogent Food Agric., 5: 1615718. https://doi.org/10.1080/23311932.2019.1615718[CrossRef]
- Chen, Y., M.E. Ghanem and K.H.M. Siddique. 2017. Characterising root trait variability in chickpea (Cicer arietinum L.) germplasm. J. Exp. Bot., 68(8): 1987-1999.
- Farshadfar, M. and Farshadfar, E. 2008. Genetic Variability and Path Analysis of Chickpea (Cicer arientinum L.) Landraces and Lines. J. Appl. Sci., 8: 3951-3956. https://doi.org/10.3923/jas.2008.3951.3956[CrossRef]
- Gautam, A., Panwar, R.K., Verma, S.K., Arora, A., Gaur, A.K. and Chauhan, C. 2021. Assessment of Genetic Variability Parameters for Yield and its Components in Chickpea (Cicer arietinum L.). Biol. Forum-An Int. J., 13(2): 651-655.
- Govindaraj, M., M. Vetriventhan and M. Srinivasan. 2015. Importance of genetic diversity assessment in crop plants and its recent advances: An overview of its analytical perspectives. Genet. Res. Int., 14. https://doi.org/10.1155/2015/431487[CrossRef]
- Johnson P.L., Sharma R.N. and Nanda H.C. 2015. Genetic diversity and association analysis for yield traits chickpea (Cicer arietinum L.) under rice based cropping system. The Bioscan, 10(2): 879-884.
- Lal, D., Ram Krishna and S. Gurpreet. 2001. Genetic divergence in chickpea. Ind. J. Pulses Res. 14(1): 63-64.
- Mahalanobis, P.C. 1928. A statistical study at Chinese head moaurement. Man in India, 8: 32-64.
- Mahalanobis, P.C. 1936. On the generalized distance in statistics. Proc. Nat. Inst. Sci. India, 2: 49-55.
- Mahmood, M.T., M. Ahmad, I. Ali, M. Hussain, A. Latif and M. Zubrair. 2018. Evaluation of chickpea genotypes for genetic diversity through multivariate analysis. J. Environ. Agric. Sci., 15: 11-17.
- Malik, S.R., G. Shabbir, M. Zubir, S.M. Iqbal and A. Ali. 2014. Genetic diversity analysis of morphogenetictraits in Desi chickpea (Cicer arietinum L.). Int. J. Agric. Biol., 16: 956‒960.
- Pavan, S., Lotti, C., Marcotrigiano, A.R., Mazzeo, R., Bardaro, N., Bracuto, V., Ricciardi, F., Taranto, F., D’Agostino, N., Schiavulli, A., De Giovanni, C., Montemurro, C., Sonnante, G. and Ricciardi, L. 2017. A Distinct Genetic Cluster in Cultivated Chickpea as Revealed by Genome-wide Marker Discovery and Genotyping. Plant Genome, 10(2). https://doi.org/10.3835/plantgenome2016.11.0115[CrossRef]
- Rafiq, M., M.T. Mahmood, M. Ahmad, I. Ali, M. Saleem, I. Rasool and Z. Ali. 2020. Differential response of elite chickpea genotypes under moisture stress conditions. Pak. J. Agric. Res., 33(3): 422-428.
- Rajeev, K., Varshney, R.K., Thudi, M. and Roorkiwal, M. 2019. Resequencing of 429 chickpea accessions from 45 countries provides insights into genome diversity, domestication and agronomic traits. Nat. Genet., 51: 857–864. https://doi.org/10.1038/s41588-019-0401-3[CrossRef]
- Sani, S.G.A.S., Chang, P.L., Zubair, A., Carrasquilla-Garcia, N., Cordeiro, M., Penmetsa, R.V., Munis, M.F.H., Nuzhdin, S.V., Cook, D.R., von Wettberg, E.J. 2018. Genetic diversity, population structure, and genetic correlation with climatic variation in chickpea (Cicer arietinum) Landraces from Pakistan. Plant Genome., 11(1). https://doi.org/10.3835/plantgenome2017.08.0067[CrossRef]
- Shah, T.M., Imran, M., Atta, B.M., Ashraf, M.Y., Hameed, A., Waqar, I., Shafiq, M., Hussain, K., Naveed, M., Aslam, M., Maqbool, M.A. 2020. Selection and screening of drought tolerant high yielding chickpea genotypes based on physio-biochemical indices and multi-environmental yield trials. BMC Plant Biol., 20(1): 171. https://doi.org/10.1186/s12870-020-02381-9[CrossRef]
- Sharifi, P., H. Astereki and M. Pouresmael. 2018. Evaluation of variations in chickpea (Cicer arietinum L.) yield and yield components by multivariate technique. Ann. Agric. Sci., 16(2): 136-142. https://doi.org/10.1016/j.aasci.2018.02.003[CrossRef]
- Singh, B., Kumar, V. and Mishra, S.P. 2021. Genetic variability, path analysis and relationship among quantitative traits in chickpea (Cicer arietinum L.) genotypes. Pharma Innovate. J., 10(5): 1564-1568.
- Syed, M.A., M.R. Islam, M.S. Hossain, M.M. Alamand and M.N. Amin. 2012. Genetic Divergence in Chickpea (Cicer arietinum L.). Bangladesh J. Agric. Res., 37(1): 129-136. https://doi.org/10.3329/bjar.v37i1.11184[CrossRef]
- Talebi, R. and A. Rokhzadi. 2013. Genetic diversity and interrelationships between agronomic traits in landrace chickpea accessions collected from Kurdistan province, north-west of Iran. Int. J. Agric. Crop Sci., 5: 2203-2209.
- Tsehaye, A., Fikre, A. and Bantayhu, M. 2020. Genetic variability and association analysis of Desi-type chickpea (Cicer arietinum L.) advanced lines under potential environment in North Gondar, Ethiopia. Cogent Food Agric., 6(1): 1806668. https://doi.org/10.1080/23311932.2020.1806668[CrossRef]
- Upadhyaya, H.D., S.L. Dwivedi, C.L.L. Gowda and S. Singh. 2007. Identification of diverse germplasm lines for agronomic traits in a chickpea (Cicer arietinum L.) core collection for use in crop improvement. Field Crops Res., 100: 320‒326. https://doi.org/10.1016/j.fcr.2006.08.008[CrossRef]
- Zubair, M., Akhtar, L.H., Minhas, R., Bukhari, M.S., Ali, I., Sadiq, A. and Hussain, S. 2017. Performance of guar genotypes under irrigated and drought stress conditions as evaluated through PCA and Cluster analysis. Int. J. Biol. Biotech., 14(4): 623-628.
Services
Article usage statistics
Loading…