Research Article · Volume 13, Issue 4, 2 December 2025 · Open Access
Genetic Polymorphism of Local Goat Gorontalo Indonesian Based on Microsatellite Markers
· · · · · ·
Affiliations & Notes ⌄
1Department of Animal Science, Faculty of Agriculture, Universitas Negeri Gorontalo. Jl. Jend. Sudirman No. 6, Gorontalo City, Indonesia
2Faculty of Animal Science, University of Brawijaya, Jl. Veteran, Malang 65145, Indonesia
3Research Center for Animal Husbandry, National Research and Innovation Agency Republic of Indonesia (BRIN), Bogor 16911, Indonesia
4Research Center for Applied Zoology, Research Organization for Life Science, National Research and Innovation Agency (BRIN), Bogor 16911, Indonesia. *Correspondence | Suyadi Suyadi, Faculty of Animal Science, University of Brawijaya, Jl. Veteran, Malang 65145, Indonesia
The Local Gorontalo goat showed closer genetic proximity to the Kacang goat than to the Etawah Crossbreed.
These findings provide valuable insights for genetic conservation and selection strategies of local goats in Indonesia.
Selected from the article's own text.
Abstract
This research aims to analyze polymorphism and genetic distance of three local goat breeds in Gorontalo, Indonesia. The analysis was carried out using 128 blood samples collected for DNA sampling, consisting of Etawah Crossbreed (n=19), local Gorontalo (n=87), Kacang (n=22) breeds. The Deoxyribonucleic Acid (DNA) was extracted using the Wizard Genomic DNA Purification Kit protocols for analyzing fragments in the microsatellite DNA region with specific primers recommended by the ISAG/FAO. The statistical software program PopGene 3.2 was used to determine the polymorphism and genetic distance. The results obtained average observed allele (Na) of Etawah Crossbreed, local Gorontalo, Kacang goats being 6.00±2.65, 7.67±3.06, 4.33±2.31, and ratio of observed Heterozygosity (Ho) to expected Heterozygosity (He) was 0.40:0.71, 0.48:0.63, 0.42:0.43, respectively. The Polymorphism Information Content (PIC) for MCM527, ILSTS011, OarFCB20 loci was 0.73, 0.57, 0.45, while the average values of Fis, Fit, and Fst were 0.291, 0.360, 0.102, respectively. The genetic distance between local Gorontalo and Kacang goats was 0.078, local Gorontalo and Etawah Crossbreed goats were 0.164, while Etawah Crossbreed and Kacang goats were 0.452. These results showed the three local breeds in Gorontalo are polymorphic, and the local Gorontalo goat are genetically closer to Kacang compared to Etawah Crossbreed.
The goat population in Southeast Asia in 2019 was 37,844,420 heads, and 50.14% (18,975,955 heads) came from Indonesia . Local goats in Indonesia exhibit varying characteristics due to differences in geographic location and nurture systems among farmers. Gorontalo, located on Sulawesi Island in central Indonesia, is home to local goats i.e. local Gorontalo goat that have thrived in the environment and farming culture ; . Gorontalo, along with five other provinces on the island of Sulawesi, have the potential to become an area producing animal products because, apart from being located in the middle of Indonesia, it is also close to the Philippines for livestock marketing purposes. Based on data from Badan Pusat Statistik (BPS) (2025), the total goat population in Gorontalo in 2024 was recorded at 17,780 heads, representing approximately 0.11% of Indonesia’s total goat population of 15,710,055. Furthermore, Gorontalo province is inhabited by two other goat breeds, namely Kacang and Etawah Crossbreed, with the local Gorontalo goats believed to be a crossbreed between the two. The Kacang goat is a native breed of Indonesia, similar to local goats in Malaysia, Thailand, Myanmar, and the Philippines ; , while the Etawah Crossbreed is the result of crossbreeding the Etawah goat and the Kacang goat . Based on body weight, shoulder height, body length, ear length, and ear width, local Gorontalo goat are different from Peranakan Etawah goat and Kacang goat , but it needs to be confirmed through molecular approaches.
Examinations on the potential and genetic polymorphism of local goats across several Indonesian islands, including local Gorontalo goat are very limited . Genetic polymorphism of the Growth Hormone (GH) gene and the IGF-1 gene on Kacang goat in Gorontalo were polymorphic but the heterozygosity value was low. This low value of heterozygosity can affect the genes that controls the immune system as well as increasing the inbreeding pressure in certain population. Consequently, it decreases individual adaptability and survival to environmental changes, which can increase the risk of extinction . Genetic polymorphism and distance in goats can be determined using genetic markers such as Simple Sequence Repeats (SSR)/Short Tandem Repeats (STR)/Simple Sequence Length Polymorphisms (SSLP)/Variable Number Tandem Repeats (VNTR)/ Microsatellite ; ; . Genetic markers measure genetic diversity and distance within and between populations. The greater the genetic distance, the higher the population’s genetic diversity.
A microsatellite is a DNA sequence consisting of 4 DNA bases (A, G, T, C) with short repeat motifs, found in many eukaryotic chromosomes . Microsatellite DNA offers several advantages which include its abundance in the genome, naturally co-dominant, and high polymorphism, with low DNA template requirements (10-100 ng) ; . The use of microsatellite DNA as a genetic marker in local livestock in Indonesia has been widely applied in local cattle , goats ; , and buffalo .
The identification of genetic polymorphism using genetic markers is more accurate compared to phenotype markers, as they are not affected by environmental variations . Furthermore, genetic characterization using molecular approaches can complement research results based on morphometrics . Research on phenotype diversity based on qualitative and quantitative traits and genetic diversity based on PCR-RFLP in local goats in Gorontalo started in 2012, but research using microsatellite markers has never been done. This research aims to determine the variaton and genetic distance of three local goat breeds in Gorontalo, Indonesia, based on microsatellite DNA. The novelty of this study is the discovery of genetic variation in 3 microsatellite loci of local Gorontalo goats. This information is additional information on the genetic diversity of local goats in several regions in Indonesia for molecular basis selection. The results of this research are expected to enrich knowledge about the genetic polymorphism of local goats in Indonesia, support the conservation of local livestock diversity, and enhance the effective use of genetic resources.
MATERIALS AND METHODS
Location and sample collection
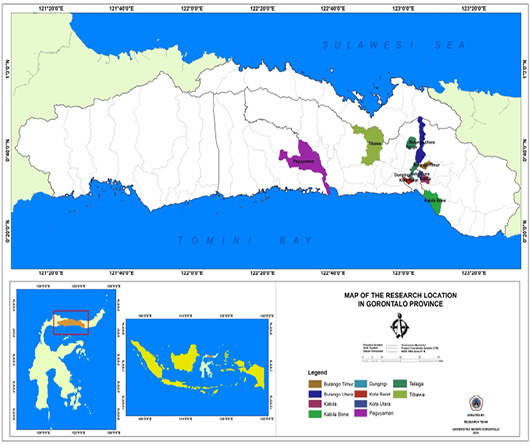
The blood samples were collected from Gorontalo Province in Indonesia, covering 10 District, namely Dungingi, Kota Barat, Kota Utara, Bulango Timur, Bulango Utara, Kabila, Kabila Bone, Tibawa, Telaga, and Paguyaman (Figure 1). Genomic DNA extraction and targeted DNA amplification were performed at the Animal Biotechnology Laboratory, Brawijaya University (UB) Malang.
A total of 128 blood samples of different goat breeds were used, including 19 Etawah Crossbreed, 87 local goats Gorontalo, and 22 Kacang goats. The blood was collected using venoject needles in vacutainer tubes containing Ethylenediaminetetraacetic acid (EDTA) from the jugular vein, yielding approximately 4 ml, which were stored in -20°C before genomic DNA extraction.
Genomic DNA extraction and DNA amplification
Genomic DNA was extracted from the blood using Cell lysis, Nuclei Lysis, Protein Precipitation, DNA Precipitation, and Rehydration steps based on the protocol of the Wizard Genomic DNA Purification Kit (Promega, USA). The quality of the extracted DNA was checked using agarose gel electrophoresis. The amplification of the three microsatellite DNA loci (Table 1), as recommended by the International Society for Animal Genetics/Food and Agriculture Organization (ISAG/FAO) for goats, was performed using the Polymerase Chain Reaction (PCR) method. The three microsatellite loci in this research to detect the genetic diversity of local Indonesian goats, and the results obtained were highly polymorphic .
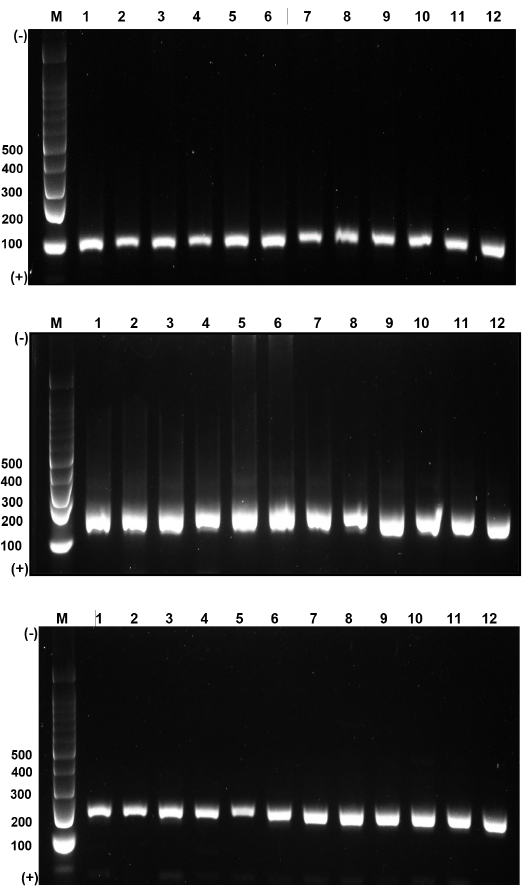
The initial step of amplification involved adding 1 μL of the DNA sample into the first tube and temporarily storing it in the refrigerator. Taq DNA Polymerase used is Gotaq green master mix by Promega. The primer concentration used is 10 micromolar, and the DNA template concentration is <250 ng. To prepare the PCR premix, 15 μL of Taq DNA polymerase was mixed with 14.4 μL of distilled water (DW), 0.3 μL of forward primer, and 0.3 μL of reverse primer into the second tube, and vortexed for approximately ±10 seconds. The PCR premix was added to the first tube containing 1 μL of DNA and spun down for approximately ±10 seconds to ensure homogeneity. The mixture was transferred into the thermocycler and the machine was set for the PCR process, starting with an initial denaturation at 95ºC for 5 minutes, followed by 35 cycles of denaturation at 95ºC for 10 seconds, primer annealing for 20 seconds, extension at 72ºC for 60 seconds, and a final extension at 72ºC for 5 minutes. The PCR product (3 μL) was visualized by electrophoresis (Mupid-exU, Japan) for 40 minutes at 100 volts in a 1% agarose gel with Nucleic Acid Dye (Diamond, Promega). The size of the target DNA product was determined using a 100 bp DNA size standard (Promega). Subsequently, the PCR product bands were visualized using a GelDoc (Glite 965 GW, Taiwan), and confirmed microsatellite DNA PCR products were sent to 1Base Laboratory, Selangor, Malaysia for fragment analysis.
Data analysis
Genetic polymorphism analysis after fragmentation involved several steps, namely calculating the number and frequency of alleles, heterozygosity, Polymorphism Information Content (PIC), and fixation indices (Fis, Fit, and Fst) . Meanwhile, the genetic similarity and distance were calculated based on microsatellite allele frequencies in each population. The phylogenetic reconstruction among local Gorontalo, Etawah Crossbreed, and Kacang was performed using the Unweighted Pair Group Method with the Arithmetic (UPGMA) method, assuming equal evolutionary rates among goat strains/groups. The number and frequency of alleles, heterozygosity, fixation indices, genetic similarity, distance, and the phylogenetic tree were determined using the statistical tool PopGene 1.32. The phylogenetic tree reconstruction was performed using MEGA software version X .
RESULTS AND DISCUSSION
Genetic polymorphism
Alleles and Allele Frequency
The analysis of the three microsatellite DNA loci in local goats in Gorontalo showed that the number of alleles at the OarFCB20, MCM527, and ILSTS011 loci was 5, 11, and 8, respectively, as presented in Table 2 and Figure 3. Based on breed, the average observed allele (Na) in local Gorontalo goats was higher at 7.67±3.06 compared to Etawah Crossbreed at 6.00±2.65 and Kacang at 4.33±2.31, as shown in Table 3. The allele frequency were slightly higher in local Gorontalo goats compared to Etawah Crossbreed and Kacang goats. This is not much different from previous phenotype research, namely that the phenotype of local Gorontalo goats is more varied than that of Etawah Crossbreed and Kacang goats . The number of alleles in this research was not significantly different from other research in Indonesia, such as Etawah Crossbreed (4.17±0.72), Kacang (5.67±1.67), Senduro (5.75±1.36) ,
Table 1: Three Microsatellite loci, primer sequences, base pair range, annealing temperature, and fluorescent label recommended by ISAG/FAO for assessing genetic polymorphism in the three local goat breeds in Gorontalo, Indonesia
No
Locus Name
Chromosome
Primer sequences
Base range (bp)
Annealing temperature (oC)
Coloring labels
1
OarFCB20
OAR2
F: “GGAAAACCCCCA-TATATACCTATAC”
R: ”AAATGTGTTTAAG-ATTCCATACATGTG”
93-112
58
FAM
2
MCM527
OAR5
F: ”GTCCATTGCCT-CAAATCAATTC”
R: ”AAACCACTTGA-CTACTCCCCAA”
165-187
58
FAM
3
ILSTS011
BTA14
F: ”GCTTGCTAC-ATGGAAAGTGC”
R: ”CTAAAATGCA-GAGCCCTACC”
250-300
58
FAM
Tzable 2: Alleles and allele frequencies of 3 microsatellite loci in 3 local goat breeds in Gorontalo, Indonesia.
Locus
Base length (ISAG/FAO)
Alleles
Allele frequency
Overall allele frequency
Etawah crossbreed
Local gorontalo
Kacang
n (goat)
19
87
22
OarFCB20
93-112
96
0.211
0.060
0.114
0.092
98
0.342
0.151
0.023
0.157
100
0.395
0.747
0.864
0,713
101
0.053
0.024
-
0.024
107
-
0.018
-
0.012
PIC
0.68
0.41
0.24
Overall PIC
0.45
MCM527
165-187
153
0.079
0.103
-
0,082
154
0.026
0.052
0.045
0.046
155
0.342
0.241
0.091
0.230
156
0.132
0.282
0.636
0.320
164
0.026
0.011
-
0.011
166
0.053
0.057
0.023
0.050
167
0.053
0.006
-
0.011
168
0.184
0.155
0.136
0.156
169
0.105
0.052
0.023
0.054
170
-
0.017
-
0.011
171
-
0.023
0.045
0.023
PIC
0.81
0.82
0.56
Overall PIC
0.73
ILSTS011
250-300
265
0.029
-
-
0.004
269
-
0.006
0.068
0.016
271
0.176
0.440
0.682
0.447
275
-
0.083
-
0.056
276
-
0.012
-
0.008
277
0.588
0.399
0.250
0.398
279
0.059
0.012
-
0.016
281
0.147
0.048
-
0.052
PIC
0.60
0.64
0.47
Overall PIC
0.57
Noted: n: number of samples; PIC: Polymorphism Information Content
Table 3: Heterozygosity based on microsatellite DNA in Etawah Crossbreed, local Gorontalo, and Kacang goats at Gorontalo, Indonesia
Goat type
n (goat)
Locus
Na
Ne
Ho
He
X2-HW
Etawah crossbreed
19
OarFCB20
4
3.13
0.05
0.70
73.68*
MCM527
9
5.19
0.74
0.83
85.17*
ILSTS011
5
2.48
0.41
0.62
44.44*
Average
6.00±2.65
3.60±1.42
0.40±0.34
0.71±0.11
Local Gorontalo
87
OarFCB20
5
1.71
0.17
0.42
166.05*
MCM527
11
5.49
0.74
0.82
147.26*
ILSTS011
7
2.76
0.54
0.64
315.86*
Average
7.67±3.06
3.32±1.95
0.48±0.29
0.63±0.20
Kacang
22
OarFCB20
3
1.32
0.27
0.25
0.45
MCM527
7
2.29
0.45
0.58
63.09*
ILSTS011
3
1.88
0.55
0.48
16.58*
Average
4.33±2.31
1.83±0.49
0.42±0.14
0.43±0.17
Noted: n: number of samples; Na: number of observed alleles; Ne: number of effective alleles; Ho: observed heterozygosity; He: expected heterozygosity; X2: chi-square test; HW: Hardy-Weinberg; *P<0.05 (significantly different at 0.05)
Jawarandu (4.9±2.2), Kosta (2.5±1.3), Gembrong (2.2±1.1) . These allele numbers were slightly lower than the Girgentana Siria goat at 8.36±2.69 and the Yunnan China goat at 11.4 .
The more alleles in a population indicate the higher diversity. More alleles in local Gorontalo goats indicate higher diversity due to crossbreeding between Peranakan Etawah and Kacang goats. Polymorphism is lower in Kacang goats because the selection process is strict, and breeders do not carry out crossbreeding, so only certain alleles appear to dominate. The proportion of homozygous alleles will increase, the proportion of heterozygotes will decrease, and inbreeding depression will occur if family marriages last long in a population .
As shown in Table 2, the highest-frequency alleles at the OarFCB20, MCM527, and ILSTS011 are alleles 100, 156, and 271, with respective frequencies of 0.713, 0.320, and 0.447. Among the different breeds, the Kacang goats exhibited the highest allele frequencies for each observed locus are found in Kacang goats, with values of 0.864 (allele 100), 0.636 (allele 156), and 0.682 (allele 271). Meanwhile, the local Gorontalo goats showed the lowest allele frequencies observed at 0.018 (allele 107), 0.011 (allele 164), and 0.006 (allele 269). A locus can be considered polymorphic when the number of alleles in the population at that locus is more than one or the allele frequency is less than or equal to 0.95 . Therefore, the polymorphism indication in the local Gorontalo goat population suggested that it can be considered for selection purposes to improve and enhance genetic quality. Selection for traits of high economic value in goats can maximize birth weight and avoid dystocia due to high birth weights .
Four (4) unique/specific alleles in local Gorontalo goats that were not found in Etawah Crossbreed and Kacang goats, namely allele 107, allele 170, and allele 275 and 276 at the OarFCB20, MCM527 and ILSTS011 loci, respectively (Table 2). These unique alleles have the potential to be used as genetic markers to differentiate between two local goats in Gorontalo, Indonesia. Specific or unique alleles can be used for breeding purposes and predicting or distinguishing specific genotypes ; .
Polymorphism information content (PIC)
The three observed microsatellite loci in Table 2 were considered polymorphic because they had more than 2 alleles. The highest Polymorphism Information Content (PIC) value of 0.73 was found at the MCM527 locus, followed by the ILSTS011 locus at 0.57, and the OarFCB20 locus at 0.45, which was the lowest. The MCM527 locus had the highest average value because the PIC values of each breed were also high (>0.5), which were 0.81, 0.82, and 0.56 for Etawah Crossbreed, local Gorontalo, and Kacang goats, respectively. Microsatellite loci with PIC values >0.5, 0.25-0.5, and <0.25 were considered highly, moderately, and low informative ; .
The moderate PIC value at the OarFCB20 locus was due to the lower number of alleles ranging from 3 to 5 in each breed compared to the MCM527 and ILSTS011 loci. The PIC value depends on the number of alleles and their frequency distribution, therefore, the value will be higher when there are more than two alleles or lower allele frequencies . Research on five local goat breeds in East Java showed that the PIC values for the OarFCB20, MCM527, and ILSTS011 loci were 0.662, 0.681, and 0.667, respectively . The PIC value for the ILSTS011 locus in Yunnan China goats was 0.505, and for the OarFCB20 locus was 0.636 . In Beetal goats from Pakistan, the PIC values for the OarFCB20, MCM527, and ILSTS011 loci were 0.709, 0.668, and 0.38, respectively . PIC measures the ability of a marker to detect polymorphisms; therefore, the selection of markers for genetic studies is essential . Meanwhile, the high average PIC values in this research indicated that the MCM527 and ILSTS011 loci can be recommended as markers of selection for Etawah Crossbreed, local Gorontalo, and Kacang goats in Indonesia. Using selection methods based on molecular information can shorten the selection period and achieve genetic improvement more quickly .
Heterozygosity and hardy-weinberg
As shown in Table 3, the average observed heterozygosity (Ho) in local Gorontalo, Kacang, and Etawah Crossbreed goats, was 0.48, 0.42, and 0.40, respectively. The highest heterozygosity in Etawah Crossbreed and local Gorontalo goats was found at the MCM527 locus, with values of 0.74 for both breeds, while the ILSTS011 locus had 0.55 in Kacang goats. Meanwhile, the lowest heterozygosity in Etawah Crossbreed, local Gorontalo, and Kacang goats were observed at the OarFCB20 locus, with values of 0.05, 0.17, and 0.27, respectively. The lower observed heterozygosity at the OarFCB20 locus was due to the lower number of alleles. Previous research had shown that the observed heterozygosity in Etawah Crossbreed, Kacang, and Senduro was 0.592±0.211, 0.470±0.135, and 0.479±0.178 , while in Jawarandu, Gembrong, and Kosta had values of 0.463 ± 0.207, 0.372 ± 0.173, and 0.395 ± 0.214 . The observed heterozygosity (Ho) in native Brazilian goats was 0.672 , while in Baladi, Zaraibi, Demusces, and Farafra goats in Egypt, the values were 0.155, 0.211, 0.100, and 0.222, respectively . Heterozygosity is a measure of genetic diversity within animal populations, where a higher number of detected alleles in a locus leads to greater heterozygosity values. A heterozygosity value approaching one indicates increasing genetic diversity in the population, while a value approaching zero indicates reduced genetic variation .
The average observed heterozygosity (Ho) in Etawah Crossbreed goats was lower than the expected heterozygosity (He) (0.40<0.71), as well as in local Gorontalo goats (0.48<0.63). In Kacang goats, the Ho was higher than the He, with a value of 0.42>0.43, however, there was no significant difference between the values, as presented in Table 3. The imbalance between observed and expected heterozygosity indicated the occurrence of random mating among individuals within the population. When the observed heterozygosity was lower, it indicated that the inbreeding occurred within the population, while higher values suggested a relatively large diversity . Moreover, mating patterns and migration had been established as factors that can affect the level of heterozygosity in a population. Low genetic diversity can occur in a livestock group due to the limited introduction of new males into the population, while high diversity indicated the absence of intensive selection programs or inbreeding pressure .
Except for the OarFCjB20 locus in Kacang goats, all microsatellite loci in the three local goat breeds observed did not show the Hardy-Weinberg equilibrium condition (Table 3). Genetic imbalance in each local goat population illustrates low heterozygosity and unequal distribution of alleles. Factors thought to influence are selection by breeders and inbreeding. Randomly combining gametes through the mating process causes genotype and allele frequencies to remain constant from generation to generation. Hardy-Weinberg equilibrium can be achieved if the assumptions are met that mating occurs randomly, there is no natural selection, the population size is very large, no genetic drift, no mutations occur, and the locus is autosomal . It will always be difficult for a livestock population to achieve a condition of genetic balance in the real world because breeders are always involved in selecting and mating their livestock.
Fixation index
The average values of Fis at 0.291 for the three observed loci were lower compared to the value of Fit at 0.360 but higher than Fst at 0.102, as shown in Table 4. The locus that contributed the most to the average fixation index components (Fis, Fit, Fst) was OarFCB20, followed by ILSTS011 and MCM527. The values of the fixation index in this research indicated higher genetic polymorphism among individuals within the population (Fit) in the three local goat breeds in Gorontalo compared to within breed/subpopulation (Fis) and among breed/subpopulation (Fst). Furthermore, the fixation index of the three local goat breeds in Gorontalo is higher than that of the five local goat breeds in East Java, where Fis, Fit, and Fst was 0.258, 0.324, and 0.088 , and in seven indigenous Vietnamese goats with Fst, Fit, Fis of 0.083, 0.178, and 0.104, respectively .
Table 4: Values of fis, fit, and fst (fixation index) for the three microsatellite DNA loci in Etawah crossbreed, local Gorontalo, and Kacang goats at Gorontalo, Indonesia
Locus
Sample size
Fis
Fit
Fst
OarFCB20
248
0.630
0.675
0.121
MCM527
256
0.120
0.187
0.077
ILSTS011
246
0.123
0.218
0.108
Mean
250
0.240
0.314
0.097
The F-statistic or fixation index reflected selection and mating patterns, as well as their relationship to polymorphic alleles. A negative Fis value indicated relatively high heterozygosity, while a positive value showed high homozygosity ; . Moreover, populations with low genetic diversity were more likely to consist of closely related individuals, leading to a higher chance of inbreeding within the group. Based on previous research, Fis values indicated inbreeding within the population, Fit showed inbreeding within a subpopulation, and Fst indicated genetic differentiation between populations . An inbreeding coefficient above 12.5% indicated significant inbreeding pressure within the population. The Fis values in Table 4 showed the presence of inbreeding within the subpopulations of Etawah Crossbreed, local Gorontalo, and Kacang goats. The high inbreeding values were attributed to small population size, a limited number of males, and a restricted distribution area ; . Inbreeding causes reduced reproductive quality, increased susceptibility to pathogens , and decreased survival ability in the wild . Goats quality and reproductive efficiency can be evaluated based on the aspects of fertility, conception, kidding, productivity, and twinning rates .
Genetic distance
The genetic distance between local Gorontalo and Kacang goats was 0.078, which was closer than the distance between Etawah Crossbreed at 0.164 as well as Etawah Crossbreed and Kacang goats at 0.452, as illustrated in Table 5. The genetic distance indicated the genetic difference between species or populations within a specific species. Therefore, smaller genetic distance values approaching zero indicated a closer genetic relationship between two or more individuals, while larger values approaching one indicate a more distant relationship . The genetic distance between the three local goats in Gorontalo was higher compared to the distance between Etawah Crossbreed and Kacang goats in East Java, Indonesia at 0.077, Etawah Crossbreed and Senduro goats at 0.037, as well as Kacang and Senduro goats at 0.055 . Proximity in the genetic distance indicated a high genetic similarity due to shared ancestry .
Table 5: Nei’s genetic identity (above diagonal) and genetic distance (below diagonal) between Etawah crossbreed, local Gorontalo, and Kacang goats
Goat breed
Etawah crossbreed
Local gorontalo
Kacang
Etawah crossbreed
-
0.848
0.637
Local Gorontalo
0.164
-
0.925
Kacang
0.452
0.078
-
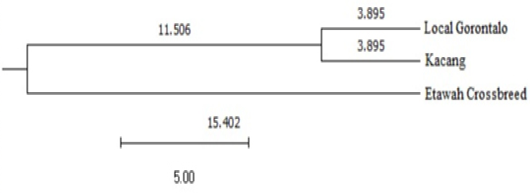
The genetic distance values used to construct the phylogeny of the three breeds as shown in Figure 2, indicated that local Gorontalo goats were grouped in the same cluster as Kacang, while Etawah Crossbreed formed a separate cluster. This phylogeny also showed that local Gorontalo goats were more similar to Kacang goats compared to Etawah Crossbreed. Even though microsatellite DNA is genetically closer, research on average body weight and several body measurements by Ilham et al. (2023) on local Gorontalo goats previously showed higher values than Kacang goats. This closeness was due to the higher frequency of mating between local Gorontalo and Kacang goats compared to Etawah Crossbreed, resulting in the genetic proportion of Kacang becoming more dominant in local Gorontalo goats. Pakpahan et al. (2016) stated that most local goats in Indonesia showed a closer relationship with Capra aegagrus than Capra falconeri. The genetic distance between the local goats and Capra hircus was 0.003-0.004, which was closer compared to Capra falconeri and Capra aegagrus . Furthermore, local Indonesian goats based on Kacang goats showed a closer genetic distance and formed a single cluster compared to Gembrong goats . This research also supported previous research that Kacang goats were the main genetic source of all current local goat breeds in Indonesia .
The results of this study are important in practical applications in the field of animal husbandry, including providing a clear direction in conservation and breeding efforts based on genetic data. Strengthening the position of the Local Gorontalo goat as a unique plasma nutfah that needs to be maintained. Supporting national policies in protecting local livestock genetic resources.
CONCLUSION
This study confirmed that the three goat breeds in Gorontalo (Etawah Crossbreed, Local Gorontalo, and Kacang goat) are genetically diverse and polymorphic based on microsatellite markers. The Local Gorontalo goat showed closer genetic proximity to the Kacang goat than to the Etawah Crossbreed. The microsatellite loci OarFCB20, MCM527, and ILSTS011 proved to be informative markers for assessing genetic diversity. These findings provide valuable insights for genetic conservation and selection strategies of local goats in Indonesia.
ACKNOWLEDGEMENT
This research fund is supported by the Indonesia Endowment Fund for Education Agency (LPDP) of the Ministry of Finance of the Republic of Indonesia.
NOVELTY STATEMENT
Research on phenotype diversity based on qualitative and quantitative traits and genetic diversity based on PCR-RFLP in local goats in Gorontalo has been conducted since 2012. Still, with microsatellite markers, it has never been done. The novelty of this study is the discovery of genetic variation in 3 microsatellite loci of local Gorontalo goats, namely locus OarFCB20, MCM527, and ILSTS011. Apart from diversity, information was also obtained that local Gorontalo goats are closer to the Kacang goat compared to the Etawah Crossbreed goats. This information is additional information about the genetic diversity of local goats in several regions in Indonesia in the context of selection based on molecular information.
AUTHOR’S CONTRIBUTION
FI: Collecting data, doing the research and preparing the manuscript.
GC, TES: Supervision and review the manuscript.
AA: Data analysis.
CDN, PPA: Data analysis, preparing the manuscript.
SS: Conceptualization, supervision, review the manuscript, correspondence.
All authors contributed to the article and approved the submitted version.
Ethics approval
The protocol of this study was approved by the Gorontalo State University Health Research Ethics Commission (KEPK) Number 44B/UN47.B7/KE/2023 approved the procedure for using animals in this study.
Generative AI and AI-assisted technology statement
The authors declare that no Genrative AI was used in the creation of this manuscript.
Conflict of interest
The authors have declared no conflict of interest.
Figures
Figure 1:.
Research location of local goats in Gorontalo, Indonesia.
Figure 2:.
Genetic Tree of Etawah crossbred goats, local Gorontalo, and Kacang, obtained using PopGene 1.32 software and MEGA software version X. Based on the image, it can be seen that the kinship value of Kacang goats is closer to local Gorontalo goats (3.895) compared to Etawah crossbred goats (11.506).
Figure 3:.
Visualization of PCR product bands of microsatellite DNA of OarFCB20 (left), MCM527 (center), ILSTS011 (right) loci that have been amplified using FAM dye forward primer in 1.5% agarose gel (M: Marker, 1-12: Sample Number).
References
Agung PP, Saputra F, Zein MSA, Wulandari AS, Putra WPB, Said S, Jakaria J (2019). Genetic diversity of Indonesian cattle breeds based on microsatellite markers. Asian-Australas. J. Anim. Sci., 32: 467–476. https://doi.org/10.5713/ajas.18.0283[CrossRef]
Alkass JE, Hermiz HN, Baper MI, Akreyi IA, Rashid FM (2021). Productivity traits of local mountain goat and some factors affecting them. Iraqi J. Agric. Sci., 52: 913–917. https://doi.org/10.36103/ijas.v52i4.1399[CrossRef]
Al-khalaf K, Lawand S, Al-mahasneh H (2022). Genetic relationship between some barley genotypes (Hordeum vulgare L.) using ssr technique (microsatellite). Iraqi J. Agric. Sci., 53: 890–900. https://doi.org/10.36103/ijas.v53i4.1601[CrossRef]
Asroush F, Mirhoseini SZ, Badbarin N, Seidavi A, Tufarelli V, Laudadio V, Dario C, Selvaggi M (2018). Genetic characterization of Markhoz goat breed using microsatellite markers. Arch. Anim. Breed., 61: 469–473. https://doi.org/10.5194/aab-61-469-2018[CrossRef]
Badan Pusat Statistik (BPS) (2025). Statistical Yearbook of Indonesia 2025. BPS-Statistics Indonesia
Behera L, Patra BC, Sahu RK, Nanda A, Sahu SC, Patnaik A, Rao GJN, Singh ON (2012). Assessment of genetic diversity in medicinal rices using microsatellite markers. Aust. J. Crop Sci., 6: 1369–1376.
Bennett P (2000). Microsatellites. J. Clin. Pathol. Mol. Pathol., 53: 177–183. https://www.researchgate.net/publication/298936559_Microsatellites https://doi.org/10.1136/mp.53.4.177[CrossRef]
Brito LF, Kijas JW, Ventura RV, Sargolzaei M, Porto-Neto LR, Cánovas A, Feng Z, Jafarikia M, Schenkel FS (2017). Genetic diversity and signatures of selection in various goat breeds revealed by genome-wide SNP markers. BMC Genom., 18: 1–20. https://doi.org/10.1186/s12864-017-3610-0[CrossRef]
Ciptadi G, Putri ARI, Rahayu S, Wahjuningsih S, Nasich M, Rokhman F, Mudawamah M, Sarastina S, Herwijanti E, Karima HN, Budiarto A (2018). Phenotypic and genetic character variations of a new breed of genetic resource of Senduro goat, Indonesia. AIP Conf. Proc., 060007. https://doi.org/10.1063/1.5061916[CrossRef]
Dixit SP, Aggarwal RAK, Dangi PS, Verma NK, Vyas MK, Rana J, Sharma A, Kharadi VB, Sabapara GP, Deshpande SB (2013). Phenotypic characteristics, management, performance and genetic variability in Surti breed of goat. Indian J. Anim. Sci., 83: 423–427. https://epubs.icar.org.in/index.php/IJAnS/article/view/28934
El-Sayed MA, El-Hamamsy SM, Abdelhamed W, El-Danasoury MM (2017). Genetic diversity in egyptian goats based on microsatellite markers. Curr. Appl. Sci. Technol., 17: 130–139.
Food and Agriculture (2020). FAOSTAT: Live Animals. Food and Agriculture (FAO). http://www.fao.org/faostat/es/
Guang-Xin E, Hong QH, Zhao YJ, Ma YH, Chu MX, Zhu L, Huang YF (2019). Genetic diversity estimation of Yunnan indigenous goat breeds using microsatellite markers. Ecol. Evol., 9: 5916–5924. https://doi.org/10.1002/ece3.5174[CrossRef]
Guichoux E, Lagache L, Wagner S, Chaumeil P, Léger P, Lepais O, Lepoittevin C, Malausa T, Revardel E, Salin F, Petit R (2011). Current trends in microsatellite genotyping. Mol. Ecol. Resour., 11: 591–611. https://doi.org/10.1111/j.1755-0998.2011.03014.x[CrossRef]
Hadi YA, Mnati AA, Abdulfattah SY (2020). Study of genetic diversity using microsatellite markers in Iraqi sheep breeds. Iraqi J. Agric. Sci., 51: 1367–1374. https://doi.org/10.36103/ijas.v51i5.1146[CrossRef]
Halverson MA, Skelly DK, Caccone A (2006). Inbreeding linked to amphibian survival in the wild but not in the laboratory. J. Hered., 97: 499–507. https://doi.org/10.1093/jhered/esl019[CrossRef]
Ilham F, Ciptadi G, Susilorini TE, Putra WPB, Suyadi (2023). Morphology and morphometric diversity of three local goats in Gorontalo, Indonesia. Biodiversitas, 24: 1366–1375. https://doi.org/10.13057/biodiv/d240305[CrossRef]
Ilham F, Dako S, Rachman AB, Dagong MIA, Rahim L (2016). Diversity of Insulin Growth Factor-1 ( Igf-1) gene of Kacang Goat in Kota Gorontalo and Regency of Bone Bolango Province of Gorontalo. Proceeding 3rd Animal Production International Seminar (3rd APIS) and 3rd ASEAN Regional Conference Animal Production (3rd ARCAP), Universitas Brawijaya, Malang, Indonesia., 342–345.
Ilham F, Dako S, Rachman AB, Dagong MIA, Rahim L, Yulianty (2016). Genetic polymorphisms of Growth Hormone (GH) Gene in Kacang Goat population based on olymerase chain reaction-restriction fragment length polymorphism (PCR-RFLP) identification. Livest. Res. Rural Dev., 28: Article #167. https://www.lrrd.org/lrrd28/9/ilha28167.html
Jakaria, Zein MSA, Sulandari S, Subandriyo, Muladno (2012). The use of microsatellite markers to study genetic diversity in Indonesian sheep. J. Indones. Trop. Anim. Agric., 37: 1–9. https://doi.org/10.14710/jitaa.37.1.1-9[CrossRef]
Jawasreh KIZ, Al-Kass JE (2023). Restricted selection index for growth traits of Shami kids. Iraqi J. Agric. Sci., 54: 124–133. https://doi.org/10.36103/ijas.v54i1.1683[CrossRef]
Jiyanto, Sutopo, Kurnianto E (2014). The genetic diversity of kejobong goat based on cytochrome b gene. J. Indones. trop. anim. agric., 39: 75–82. https://doi.org/10.14710/jitaa.39.2.75-82[CrossRef]
Khdir SA, Ahmad N, Hama-Ali E, Abdullah S (2023). Genetic diversity and population structure of common bean genotypes using morphological traits and SSR. Iraqi J. Agric. Sci., 54: 792–805. https://doi.org/10.36103/ijas.v54i3.1762[CrossRef]
Knapp LA (2018). Heterozygosity. The international encyclopedia of biological anthropology. pp. 1–2. https://doi.org/10.1002/9781118584538.ieba0235[CrossRef]
Kumar S, Stecher G, Li M, Knyaz C, Tamura K (2018). MEGA X: Molecular evolutionary genetics analysis across computing platforms. Mol. Biol. Evol., 35: 1547–1549. https://doi.org/10.1093/molbev/msy096[CrossRef]
Kunuti S, Ilham F, Dako S (2021). Keragaman fenotip dan gen sifat kualitatif pada ayam kampung. Jambura J. Anim. Sci., 3: 87–95. https://doi.org/10.35900/jjas.v3i2.9959[CrossRef]
Lachance J (2016). Hardy-weinberg equilibrium and random mating. In: Kliman, RM Editors. Encyclopedia of evolutionary biology. Academic Press, Amsterdam. https://doi.org/10.1016/B978-0-12-800049-6.00022-6[CrossRef]
Menezes MPC, Martinez AM, Ribeiro MN, Pimenta Filho EC, Bermejo JVD (2006). Genetic characterization of Brazilian native breeds of goats using 27 markers microsatellites. R. Bras. Zootec., 35: 1336–1341. https://doi.org/10.1590/S1516-35982006000500012[CrossRef]
Naqvi AN, Bukhari JF, Vahidi SMF, Utsunomiya YT, Garcia JF, Babar ME, Han JL, Pichler R, Periasamy K (2017). Microsatellite based genetic diversity and mitochondrial DNA D-Loop variation in economically important goat breeds of Pakistan. Small Rumin. Res., 148: 62–71. https://doi.org/10.1016/j.smallrumres.2016.12.031[CrossRef]
Nei M, Kumar S (2000). Molecular evolution and phylogenetics. Oxford University Press, Inc, USA. https://doi.org/10.1093/oso/9780195135848.001.0001[CrossRef]
Ofori SA, Hagan JK, Kyei F, Etim NN (2021). Phenotypic and genetic characterization of qualitative traits in the West African Dwarf goat of Ghana. Sci. Afr., 13: e00857. https://doi.org/10.1016/j.sciaf.2021.e00857[CrossRef]
Pakpahan S, Artama WT, Widayanti R, Gede Suparta I (2016). Genetic characteristics and relationship in different goat populations of indonesia based on cytochrome B gene sequences. Asian J. Anim. Sci., 10: 29–38. https://scialert.net/abstract/?doi=ajas.2016.29.38 https://doi.org/10.3923/ajas.2016.29.38[CrossRef]
Pralomkarn W, Supakorn C, Boonsanit D (2012). Knowledge in goats in Thailand. Walailak J. Sci. and Tech., 9: 93–105. https://wjst.wu.ac.th/index.php/wjst/article/view/29
Radwan J, Biedrzycka A, Babik W (2010). Does reduced MHC diversity decrease viability of vertebrate populations?. Biol. Conserv., 143: 537–544. https://doi.org/10.1016/j.biocon.2009.07.026[CrossRef]
Rafter P, McHugh N, Pabiou T, Berry DP (2022). Inbreeding trends and genetic diversity in purebred sheep populations. Animal, 16: 100604. https://doi.org/10.1016/j.animal.2022.100604[CrossRef]
Raza S, Shoaib MW, Mubeen H (2016). Genetic Markers: Importance, uses and applications. Int. J. Sci. Res. Publ., 6: 221–223. http://www.ijsrp.org/research-paper-0316.php?rp=P515169
Saputra F, Jakaria, Anggraeni A, Sumantri C (2020). Genetic diversity of Indonesian Swamp Buffalo based on microsatellite markers. Trop. Anim. Sci. J., 43: 191–196. https://doi.org/10.5398/tasj.2020.43.3.191[CrossRef]
Sardina MT, Tortorici L, Mastrangelo S, Di Gerlando R, Tolone M, Portolano B (2015). Application of microsatellite markers as potential tools for traceability of Girgentana goat breed dairy products. Food Res. Int., 74: 115–122. https://doi.org/10.1016/j.foodres.2015.04.038[CrossRef]
Serrote CML, Reiniger LRS, Silva KB, Rabaiolli SM dos S, Stefanel CM (2020). Determining the polymorphism information content of a molecular marker. Gene, 726: 144175. https://doi.org/10.1016/j.gene.2019.144175[CrossRef]
Singh KV, Dixit SP, Sharma A, Vohra V, Kant N, Dangi PS, Kumar R (2019). Differentiating characteristics among three new goat populations from northern India. Indian J. Anim. Sci., 89: 746–751. https://doi.org/10.56093/ijans.v89i7.92036[CrossRef]
Susilorini TE, Wulandari D, Furqon A, Septian WA, Saputra F, Suyadi S (2022). Genetic diversity of various goats in East Java based on DNA microsatellite markers. Trop. Anim. Sci. J., 43: 247–254. https://doi.org/10.5398/tasj.2022.45.3.247[CrossRef]
Suyadi S, Murtika IL, Susilorini TE, Septian WA, Saputra F, Furqon A (2022). Genetic diversity of goats in East Java through analysis of the cytochrome B and cytochrome oxidase I genes in mitochondrial DNA. Small. Rumin. Res., 209: 106659. https://doi.org/10.1016/j.smallrumres.2022.106659[CrossRef]
Suyadi S, Septian WA, Furqon A, Susilorini TE, Nasich M (2019). Reproduction index of kacang goat dam reared under closed population in Buduran Sub-District, Sidoarjo Regency, East Java, Indonesia. IOP Conf. Ser. Earth Environ. Sci., 391: 012007. https://doi.org/10.1088/1755-1315/391/1/012007[CrossRef]
Suyadi S, Wahjuningsih S, Septian WA, Furqon A, Putri RF, Nugraha CD (2021). Reproductive performance and fertility index of Etawah-crossbred goats based on several parities at goat breeding station-Singosari, Malang, Indonesia. IOP Conf. Ser. Earth Environ. Sci., 788: 012136. https://doi.org/10.1088/1755-1315/788/1/012136[CrossRef]
Tefiel H, Ata N, Chahbar M, Benyarou M, Fantazi K, Yilmaz O, Cemal I, Karaca O, Boudouma D, Gaouar SBS (2018). Genetic characterization of four Algerian goat breeds assessed by microsatellite markers. Small. Rumin. Res., 160: 65–71. https://doi.org/10.1016/j.smallrumres.2018.01.021[CrossRef]
Thudi M, Fakrudin B (2011). Identification of unique alleles and assessment of genetic diversity of rabi sorghum accessions using simple sequence repeat markers. J. Plant Biochem. Biotechnol., 20: 74–83. https://doi.org/10.1007/s13562-010-0028-z[CrossRef]
Thuy LT, Binh DVan, Binh NT, Minh LQ, Thuy TTT, Ton ND, Ba NVa, Han JL, Periasamy K (2017). Evaluation of genetic diversity and structure of Vietnamese goat populations using multi locus microsatellite markers. Small. Rumin. Res., 148: 43–50. https://doi.org/10.1016/j.smallrumres.2016.12.029[CrossRef]
Tsukahara Y, Chomei Y, Oishi K, Kahi AK, Panandam JM, Mukherjee TK, Hirooka H (2008). Analysis of growth patterns in purebred Kambing Katjang goat and its crosses with the German Fawn. Small. Rumin. Res., 80: 8–15. https://doi.org/10.1016/j.smallrumres.2008.07.030[CrossRef]
Vieira MLC, Santini L, Diniz AL, Munhoz CF (2016). Microsatellite markers: What they mean and why they are so useful. Genet. Mol. Biol., 39: 312–328. https://doi.org/10.1590/1678-4685-GMB-2016-0027[CrossRef]
Wright LI, Tregenza T, Hosken DJ (2008). Inbreeding, inbreeding depression and extinction. Conserv. Genet., 9: 833–843. https://doi.org/10.1007/s10592-007-9405-0[CrossRef]
Zein MS, Sulandari S, Muladno, Subandriyo, Riwantoro (2012). Diversitas genetik dan hubungan kekerabatan kambing lokal indonesia menggunakan marker DNA Mikrosatelit. J. Ilmu Ternak Vet., 17: 25–35. https://doi.org/10.14334/jitv.v17i1.709[CrossRef]