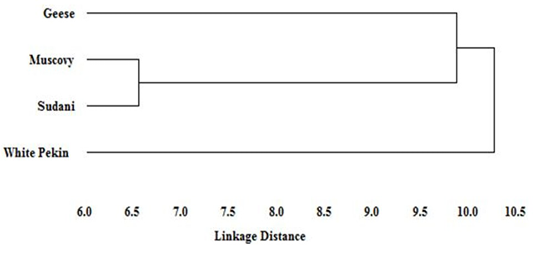
The banding profiles generated through RAPD assay in the present study were considered to differentiate between geese and three duck breeds in Egypt to clarify genetic diversity and relatedness. Sixteen primers out of nineteen have generated total of 189 positive and detectable DNA bands. The score varied from 3 bands, produced by OPA12 and OPA19, to 27 DNA bands produced by OPA04 with approximately size ranged from 160bp to above 1500bp.
From a total of 189 DNA bands, 169 DNA bands (89.41%) were polymorphic (Table 2). The percentage of polymorphism produced by each primer differed from one primer to another. It was ranged from 72.22% produced by primer OPA10 to 100% produced by OPA12, OPA17, OPA19, CH5, -127, -115 and -132. Seventy three DNA fragment bands were expressed as species specific bands, where 24 species specific bands were detected in Geese, 15, 12, 22 species specific bands were detected in Muscovy, Sudani and White pekin ducks, respectively (Table 2).
Primer OPA12 at approximately molecular weight of 250 bp produced only one unique band in Sudani breed (Figure 1). Thus, this primer can be used for characterization of this duck breed. Additionally, primer OPA19 and primer -127 generated only two DNA bands (390 bp and 1400 bp) and three monomorphic bands (500, 550 and 700bp) in White Pekin breed (Figure 1). While, Primer -115 gave three unique DNA bands (Table 2) with approximately molecular weight 320, 400 and 425bp for Muscovy breed (Figure 2).
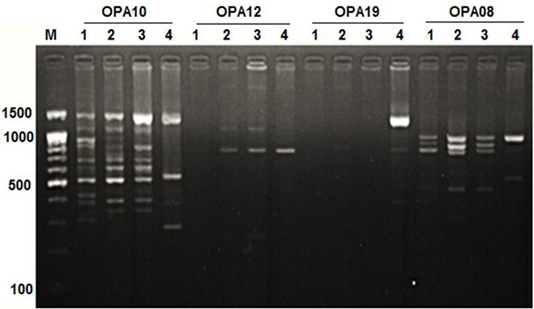
Figure 1: RAPD PCR patterns generated by primer OPA10, OPA12, OPA19 and OPA08. The fragment patterns are identified as; Lanes 1: Geese; Lanes 2: Muscovy; Lanes 3: Sudani; Lanes 4: White Pekin; Lane M: DNA marker (100 bp DNA ladder was loaded)
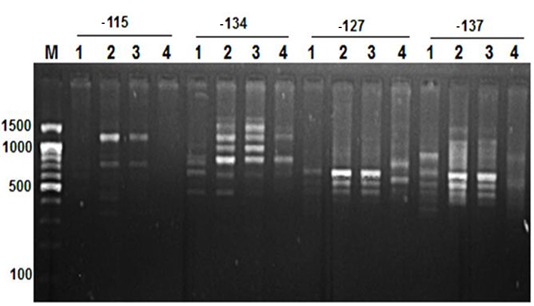
Figure 2: RAPD PCR patterns generated by primer -115, -134, -127 and -137. The fragment patterns are identified as; Lanes 1: Geese; Lanes 2: Muscovy; Lanes 3: Sudani; Lanes 4: White Pekin; Lane M: DNA marker (100 bp DNA ladder was loaded)
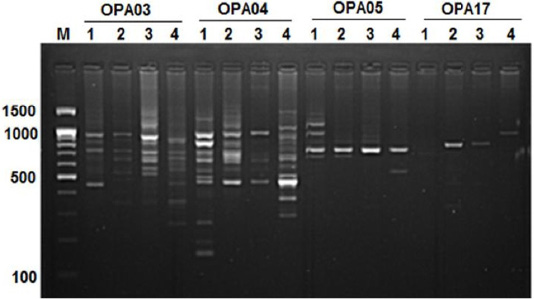
Figure 3:RAPD PCR patterns generated by primer OPA03, OPA04, OPA05 and OPA17. The fragment patterns are identified as; Lanes 1: Geese; Lanes 2: Muscovy; Lanes 3: Sudani; Lanes 4: White Pekin; Lane M: DNA marker (100 bp DNA ladder was loaded)
DNA fragment bands profile with primer OPA17 produced seven DNA bands, which were specified for Geese, Sudani and White pekin ducks and four DNA bands were specified for Muscovy ones (Figure 1).
The highest number of DNA fragments produced by primer OPA04 with polymorphic 88.88%. Results revealed the highest species-specific bands (11 DNA bands) among studied samples were generated by OPA04 primer with approximately molecular weight ranged from 160bp to 1250 bp (Figure 3). Here five monomorphic bands were detected in geese and 2, 1, 3 species specific bands showed for Muscovy, White Pekin and Sudani breed, respectively.
In geese, OPA05 primer revealed five monomorphic bands with approximate molecular weights of 600, 700, 1100, 1300 and 1490 bp (Figure 3). But for duck breeds, this primer produced two unique bands (1000 bp and 1400 bp) in Sudani breed and one unique band 510 bp in Whit Pekin breed. In addition, primers OPA12 and OPA19 didn’t show any band in geese (Figure 1).
On the other hand, primer CH4 and primer -134 generated nine and seven polymorphic DNA bands (Figure 2 and 4) in studied geese and duck breeds (Table 2) without any species-specific bands. Therefore, they revealed the highest similarity results among such species.
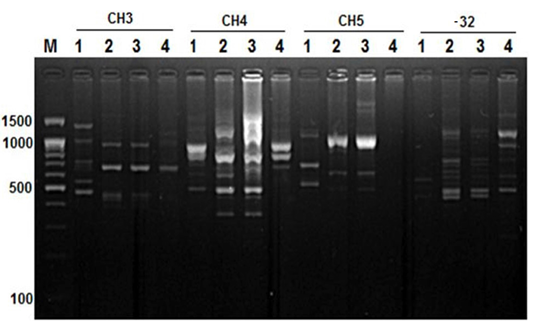
Figure 4: RAPD PCR patterns generated by primer CH3, CH4, CH5 and primer -32. The fragment patterns are identified as; Lanes 1: Geese; Lanes 2: Muscovy; Lanes 3: Sudani; Lanes 4: White Pekin; Lane M: DNA marker (100 bp DNA ladder was loaded)
Table 3: Similarity coefficients among geese and three duck breeds based on RAPD data