ResearchersLinks

Short Communication · Volume 4, Issue 4, Pages 200–204, 28 April 2016 · Open Access

Fecal Hormone Assay and Urinalysis of Pregnant Cattle

· · · · · · · ·

Article Info ⌄
Journal:
Advances in Animal and Veterinary Sciences
Published:
28 April 2016

From the article

  • Variation of T4, TSH and FSH concentrations in three trimesters of pregnancy was estimated in feces of cattle.
  • No significant variation (p>0.05) was found between variables for urine pH and specific gravity.
  • The concentration of fecal T4 was highest in 3rd trimester of pregnancy 165.2 ± 53.4 ng/ml. In trimester categories, no significant variation (p>0.05) for fecal T4 concentration was observed.
  • Here, highest percentage of urobilinogen was found in urine sample of cattle of 3rd trimester of pregnancy.

Selected from the article's own text.

Abstract


Shahir Bin Mokbul1, Tofazzal Md. Rakib2*, Amith Kumar Dash3, Sabuj Kanti Nath3, Dipon Kumar Bhowmik4, Shama Ranjan Barua2, Md. Shafiqul Islam2, Samun Sarker5, Amir Hossan Shaikat6


1Department of Dairy and Poultry Science, Chittagong Veterinary and Animal Sciences University, Khulshi, Chittagong; 2Department of Pathology and Parasitology, Chittagong Veterinary and Animal Sciences University, Khulshi, Chittagong; 3Department of Animal Science and Nutrition, Chittagong Veterinary and Animal Sciences University, Khulshi, Chittagong: 4Paragon Breeder and Hatchery Limited, Savar, Dhaka; 5 Department of Microbiology and Public Health, Chittagong Veterinary and Animal Sciences University, Khulshi, Chittagong; 6Department of Physiology, Biochemistry and Pharmacology, Chittagong Veterinary and Animal Sciences University, Khulshi, Chittagong, Bangladesh.

Abstract | Variation in concentrations of Thyroxin (T4), Thyroid stimulating hormone (TSH) and Follicle stimulating hormone (FSH) shed in feces may help to identify physiological states of animals, but the efficacy of the technique needs to be validated for each species. Therefore, a short term cross sectional study was performed in 120 pregnant cattle for fecal hormonal analysis and urine analysis. For this, Enzyme linked immune sorbent assay (ELISA) technique was used for TSH, T4, and FSH assay and dip strip with microscopic test for urinalysis. Variation of T4, TSH and FSH concentrations in three trimesters of pregnancy was estimated in feces of cattle. Highest T4 concentration was found in third trimester of pregnancy 165.2 ± 53.4ng/ml with TSH (µIU/ml) fluctuation of decreasing trends. TSH was highest in second trimester as 0.5 ±0.4 µIU/ml. There was no significant variation (p>0.05) for fecal T4 and TSH concentration. FSH level (mIU/ml) was sharply decreased (p< 0.01) with the advancement of pregnancy. Urinary pH turns acidic to alkaline in advance stage of pregnancy and specific gravity fluctuated among three trimesters of pregnancy. No significant variation (p>0.05) was found between variables for urine pH and specific gravity. The important identified deposits of urine were crystals, leucocytes, blood, casts, uric acid and calcium phosphate crystal in pregnant cattle. Crystalluria were a frequent finding of routine urine examination of cattle suggesting possible prone to urolithiasis, acute uric acid nephropathy induced by drugs such as sulphadiazine. 

Keywords | Fecal hormone, Urinary pH, Specific gravity, Crystalluria, ELISA
 

*Significant

Table 2: Association of specific gravity with corresponding urine PH and blood in urine

Specific Gravity

pH

Blood

Alkaline

Acidic

Trace

Nil

≤1.005 (n= 57)

57 (100%)

0 (0%)

0 (0%)

57 (100%)

≥1.005 (n= 63)

42 (66.7%)

21 (33.3%)

42 (66.7%)

21 (33.3%)

p-value

0.448

0.488

One hundred twenty urine samples were tested by dipstick. Level of leucocytes, nitrites, urobilinogen, pH, specific gravity, protein, blood, bilirubin, ketone and glucose was observed. Trace amount (15 Ca CELLS/µl) of leucocytes was found in seven samples (2nd trimester), urobilinogen was found positive in 116 samples (1mg/dl in 97 samples and 4mg/dl found in 19 samples). Here, highest percentage of urobilinogen was found in urine sample of cattle of 3rd trimester of pregnancy. 102 samples revealed the presence of trace amount (1mg/dl) protein in urine. The presence of ketone bodies found in all samples; among them 101 samples have 15 mg/dl and another 19 had 40 mg/dl of urine. Trace amount of glucose (<250 mg/dl) was found in 9 samples in 2nd trimester of pregnancy. We found no significant (P>0.05) association of specific gravity with corresponding urine pH and blood in urine (Table 2). No significant variation (p>0.05) was found between variables for urine PH and specific gravity. Uric acid crystal was found in majority of samples and calcium phosphate crystal was also abundant. Calcium oxalate was present in few samples.

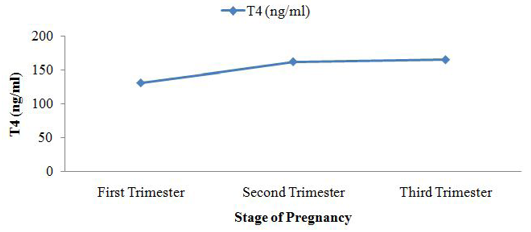
Figure 2: Fecal T4 level during course of pregnancy

Table 3: pH and specific gravity of urine in three trimesters of pregnant cattle

Trimester

pH (Mean ± SD)

Specific Gravity (Mean ± SD)

First (n=40)

5.5 ± 0.7

1.01 ± 0.007

Second (n=40)

7 ± 1.5

1.005 ± 0.002

Third (n=40)

7.6 ± 1.7

1.007 ± 0.003

p-value

0.3

0.31

The concentration of fecal T4 (ng/ml) was lowest in 1st trimester of cattle pregnancy 131.4 ± 17.6 and peak in 3rd trimester of cattle pregnancy 165.2 ± 53.4. There was no significant variation (p>0.05) for fecal T4 concentration. observed fecal T4 concentration in steller sea lion ((Eumetopias jubatus). The average fecal concentration of T4 was 2012 ng/g of feces and peak T4 concentration was 2842 ng/g feces of steller sea lion (Eumetopias jubatus).

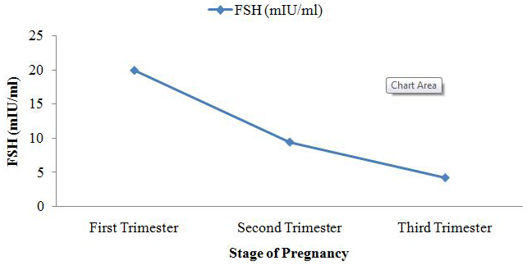
Figure 3: Fecal FSH level during course of pregnancy

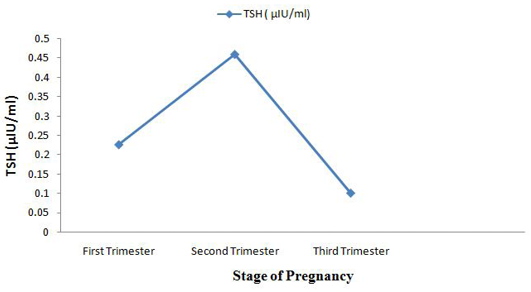
Fluctuating phenomena was seen in fecal TSH (µIU/ml) concentration. It was 0.2 ± 0.2 in 1st trimester and 0.1 ± 0.14 in third trimester but peak level of TSH was seen in 2nd trimester of pregnancy in cattle. Highly significant difference (p<0.01) between variables for fecal FSH concentration was observed. Sangeetha and Rameshkumar (2014) examined the fecal FSH concentration of sheep (Ovis aries). Fecal FSH average concentration in Sheep during pregnancy was 0.81 ± 0.01mIU/ml, highest concentration found during estrus was 3.12 ± 0.02 mIU/ml and lowest concentration during lactation was 0.03 ± 0.01 mIU/ml.

Figure 4: Fecal TSH level during course of pregnancy

Table 4: Microscopic examination of urine samples

Sample No.

Microscopic Findings (40X)

Concentration

1A1

Amorphous urate crystal

++

Uric acid crystals

+

1A2

Calcium phosphate crystal

++

Uric acid crystals

+

1B1

Calcium phosphate crystal

+

1B2

Fatty cast

+

2A1

Uric acid crystal

+++

2A2

Fatty cast

++

2B1

Calcium phosphate

+

2B2

Fatty cast

++

Uric acid crystals

+

3A1

Calcium phosphate crystal

+++

Calcium carbonate crystal

+

3A2

Fatty cast

+

3B1

Amorphous Urates

+++

Amorphous phosphates

+++

Uric acid Crystal

++

3B2

Fatty cast

+

Epithelial cells

+

Calcium oxalate crystals

+++

Specific gravity of cattle urine in 3rd trimester was 1.007 ± 0.003 but in 1st trimester it was 1.01 ± 0.007 and PH turns to acidic to alkaline in advance stage of pregnancy. It was 5.5 ± 0.7 in 1st trimester of pregnancy and 7.6 ± 1.7 in 3rd stage of pregnancy. Mavangira et al. (2010) had shown the urinary pH in normal cattle is usually on the alkaline side and may range from 7.4 to 8.4. Seifi et al. (2004) stated that pH value >8.25 in the 48 hours prior to calving accurately predict that those cows will get clinical milk fever. Kannan and Lawrence (2010) stated that the range of specific gravity of urine in normal cattle is 1.025-1.045 with an average of 1.035 and Braun (2005) also has shown in obstructive urolithiasis it ranges from 1.008 to 1.025. Among thirteen samples twelve samples had shown presence of urobilinogen, in twelve samples; where 1mg/dl in eight samples and 4mg/dl found in two samples. Hohenberger and Kimling (2008) stated that the colour fields of dip strip correspond to the following urobilinogen concentrations: normal (0 - 1), 2, 4, 8, 12 mg/dL or normal (0 - 17). Trace amount (1mg/dl) protein in urine showed by eleven samples. Leendertz et al. (2010) stated that low levels of protein in urine are normal. Small increases in protein in urine usually aren’t a cause for concern. The presence of ketone bodies found in all samples; among them eleven samples has 15 mg/dl and another two had 40 mg/dl of urine. Hohenberger and Kimling (2008) also found the colour fields of strip correspond to the following acetoacetic acid values: 0 (negative), 25 (+), 100 (++) and 300 (+++) mg/dL. Ketones in the urine are caused by an abnormal carbohydrate metabolism. Urine analysis is not often part of a veterinary surgeon’s diagnostic armory but recent advances in interpretation of urinary pH and macromineral content make it an available and interesting investigative tool . Maximum samples had shown the presence of calcium phosphate and uric acid crystals in urine. It may be due to, pathological conditions such as urolithiasis, acute uric acid nephropathy, ethylene glycol poisoning, and hypereosinophilic syndrome. Additionally, crystalluria can also be due to drugs such as sulphadiazine .

By evaluating T4, TSH, FSH, urinalysis (physical, chemical, microscopic) in pregnant cattle we found statistically significant alterations of FSH during three trimesters of cattle. Non-invasive method like hormone analysis and urinalysis may be used as tool for pregnancy diagnosis. Author recommends further research on fecal hormone analysis for monitoring reproductive status of animal as attractive, non invasive, inexpensive alternative tool compare to blood sampling.

Author’s Contribution

All authors contributed equally.

Conflict of interest

There exists no conflict of interest.

ACKNOWLEDGEMENTS

Authors would like to thank teachers and staff of Departmnt of Physiology, Parasitology and Pharmacology, Chittagong Veterinary and Animal Sciences University and farm owners for their support and suggestion throughout the study.

References

  1. Braun U (2005). Ultrasound as a decision-making tool in abdominal surgery in cows. Vet. Clin. N. Am. Food Anim. Pract. 21(1): 33-53. http://dx.doi.org/10.1016/j.cvfa.2004.11.001[CrossRef]
  2. Broaddus B, de Vries A (2005). A comparison of methods for early pregnancy diagnosis. Proceedings of 2nd Florida Dairy Road Show 22.
  3. Caraviello D, Weigel K, Fricke P, Wiltbank M, Florent M, Cook N, Nordlund K, Zwald N, Rawson C (2006). Survey of management practices on reproductive performance of dairy cattle on large US commercial farms. J. Dairy Sci. 89 (12): 4723-4735. http://dx.doi.org/10.3168/jds.S0022-0302(06)72522-X[CrossRef]
  4. Chelini M, Souza N, Rocha A, Felippe E, Oliveira C (2005). Quantification of fecal estradiol and progesterone metabolites in Syrian hamsters (Mesocricetus auratus). Brazil. J. med. Biol. Res. 38 (11): 1711-1717.
  5. De Vries A (2004). Economics of delayed replacement when cow performance is seasonal. J. Dairy Sci. 87 (9): 2947-2958. http://dx.doi.org/10.3168/jds.S0022-0302(04)73426-8[CrossRef]
  6. Hohenberger E, Kimling H (2008). Compendium urinalysis: urinalysis with test strips. Germany: Roche Diagnostics.
  7. Husband J ( 2010). Using urine analysis in dairy cows. Evidence Based Veterinary Consultancy. 12 (6): 33-35. http://ebvc.co.uk/our-services/dairy-consultancy/
  8. Kannan K, Lawrence K (2010). Obstructive urolithiasis in a Saanen goat in New Zealand, resulting in a ruptured bladder. New Zealand Vet. J. 58 (5): 269-271. http://dx.doi.org/10.1080/00480169.2010.69302[CrossRef]
  9. Keech A, Rosen D, Booth R, Trites A, Wasser S (2010). Fecal triiodothyronine and thyroxine concentrations change in response to thyroid stimulation in Steller sea lions (Eumetopias jubatus). Gen. Compar. Endocrinol. 166 (1): 180-185. http://dx.doi.org/10.1016/j.ygcen.2009.11.014[CrossRef]
  10. Leendertz SAJ, Metzger S, Skjerve E, Deschner T, Boesch C, Riedel J, Leendertz FH (2010). A longitudinal study of urinary dipstick parameters in wild chimpanzees (Pan troglodytes verus) in Cote d’Ivoire. Am. J. Primatol. 72 (8): 689-698. http://dx.doi.org/10.1002/ajp.20825[CrossRef]
  11. Mavangira V, Cornish JM, Angelos JA (2010). Effect of ammonium chloride supplementation on urine pH and urinary fractional excretion of electrolytes in goats. J. Am. Vet. Med. Assoc. 237 (11): 1299-1304. http://dx.doi.org/10.2460/javma.237.11.1299[CrossRef]
  12. Meadows C, Rajala-Schultz P, Frazer G (2005). A spreadsheet-based model demonstrating the nonuniform economic effects of varying reproductive performance in Ohio dairy herds. J. Dairy Sci. 88 (3): 1244-1254. http://dx.doi.org/10.3168/jds.S0022-0302(05)72791-0[CrossRef]
  13. Palme R, Möstl E, Brem G, Schellander K, Bamberg E (1997). Faecal Metabolites of Infused 14C‐Progesterone in Domestic Livestock. Reprod. Domest. Anim. 32 (4): 199-206. http://dx.doi.org/10.1111/j.1439-0531.1997.tb01282.x[CrossRef]
  14. Pereira RJG, Polegato BF, de Souza S, Negrão JA, Duarte JMB (2006). Monitoring ovarian cycles and pregnancy in brown brocket deer (Mazama gouazoubira) by measurement of fecal progesterone metabolites. Theriogenology. 65 (2): 387-399. http://dx.doi.org/10.1016/j.theriogenology.2005.02.019[CrossRef]
  15. Ropstad E, Johansen O, King C, Dahl E, Albon S, Langvatn R, Irvine R, Halvorsen O, Sasser G (1998). Comparison of plasma progesterone, transrectal ultrasound and pregnancy specific proteins (PSPB) used for pregnancy diagnosis in reindeer. Acta Veterinaria Scandinavica. 40 (2): 151-162.
  16. Rorie R, Bilby T, Lester T (2002). Application of electronic estrus detection technologies to reproductive management of cattle. Theriogenology. 57 (1): 137-148. http://dx.doi.org/10.1016/S0093-691X(01)00663-X[CrossRef]
  17. Sangeetha P, Rameshkumar K (2014). Observation of biochemical variations in sheep (ovis aries) feacesduring different reproductive phases. Res. J. Anim. Vet. Fish. Sci. 2 (2): 13-16.
  18. Schwarzenberger F, Möstl E, Palme R, Bamberg E (1996). Faecal steroid analysis for non-invasive monitoring of reproductive status in farm, wild and zoo animals. Anim. Reprod. Sci. 42 (1): 515-526. http://dx.doi.org/10.1016/0378-4320(96)01561-8[CrossRef]
  19. Seifi HA, Mohri M, Zadeh JK (2004). Use of pre-partum urine pH to predict the risk of milk fever in dairy cows. Vet. J. 167 (3): 281-285. http://dx.doi.org/10.1016/S1090-0233(03)00114-X[CrossRef]
  20. Souza A, Ayres H, Ferreira R, Wiltbank M (2008). A new presynchronization system (Double-Ovsynch) increases fertility at first postpartum timed AI in lactating dairy cows. Theriogenology. 70 (2): 208-215. http://dx.doi.org/10.1016/j.theriogenology.2008.03.014[CrossRef]
  21. Thamilselvan S, Khan SR (1997). Oxalate and calcium oxalate crystals are injurious to renal epithelial cells: results of in vivo and in vitro studies. J. Nephrol. 11 66-69.
  22. Thatcher W, Bilby T, Bartolome J, Silvestre F, Staples C, Santos J (2006). Strategies for improving fertility in the modern dairy cow. Theriogenology. 65 (1): 30-44. http://dx.doi.org/10.1016/j.theriogenology.2005.10.004[CrossRef]
  23. Torell R (2015). Biological Cycle of the Beef Cow. Cow Camp Chatter. University of Idaho, Moscow, Idaho, 2015.
  24. Wang Y, Wang H, Li P, Zhang Q, Kim HJ, Gee SJ, Hammock BD (2013). Phage-displayed peptide that mimics aflatoxins and its application in immunoassay. J. Agri. Food Chem. 61 (10): 2426-2433. http://dx.doi.org/10.1021/jf4004048[CrossRef]

Services

Article usage statistics

Loading…