As a result of the study, the age dynamics of specific antibodies to gB antigens of the Aujeszky disease pathogen was determined against the background of the use different vaccination schemes. It was found that 100% of animals in the control group from 63 to 70 days of life have specific antibodies whose level gradually decreases at the end of 11 weeks of birth (Table 1). In animals of the control group at the age of 84 days of life there is a decrease in S/N by more than 5.5 times compared with those obtained at 77 days of age. In the future, the level of antibodies to the gB antigen of ADV in the blood of 100% of piglets is maintained at a high level until 147 days of age. This is indicated by the low value of S/N, which fluctuated in the piglets of the control group in the range of 5-15%. From 154 days of life in piglets found high values of S/N.
Considering the results of the experimental groups, it was found that at 77 days of age the level of S/N in the piglets of the I and II experimental groups significantly (p≤0.05) differs from the control group. Forwards, the animals of the experimental groups showed a gradual decrease in S/N to 98 days of age. It should be noted that the S/N rate is higher at the age of 84 and 91 days of life in animals of the experimental group I by 48% and 46%, and in pigs of the experimental group II by 56% and 49% compared to the values of animals in the control group.
In piglets of experimental groups I and II from 98 to 147 days of life, a significant difference between the values of S/N with animals of the control group was not detected. A probable decrease in S/N in animals of the experimental groups I and II at the age of 154 days of life by 60% and 59% (p≤0.05) compared with the values of the control group of pigs are detected.
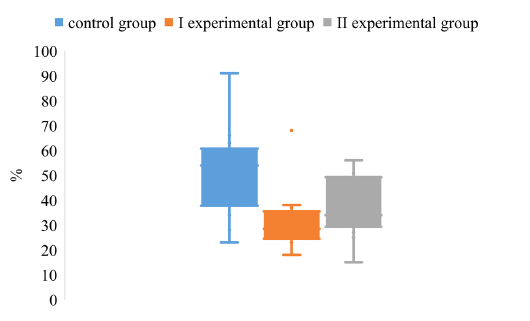
The degree of dispersion of the S/N index, in the study of IgG to gB antigens in pigs of the control and experimental groups, indicates the absence of a significant difference between the groups (Figure 1).
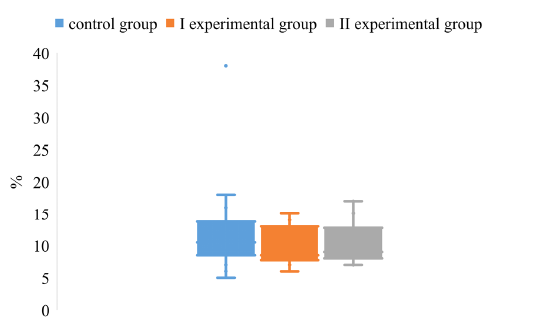
Figure 1: The dispersion of the S/N index for the determination of IgG to the antigen gB in the blood of pigs on the background of different vaccination schemes against the pseudorabies virus
It was found that the upper quartile of the control group is within 14%, and the lower - 8%. The maximum value of the control group reaches 19%, while the minimum value is 5%. The above data indicate a low level of S/N values swing in animals of the control group. The values obtained from pigs in the experimental groups did not differ significantly from the values of animals in the control group.
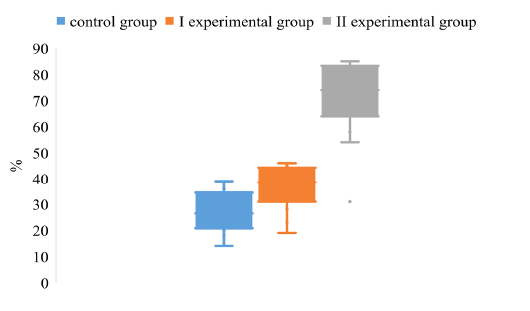
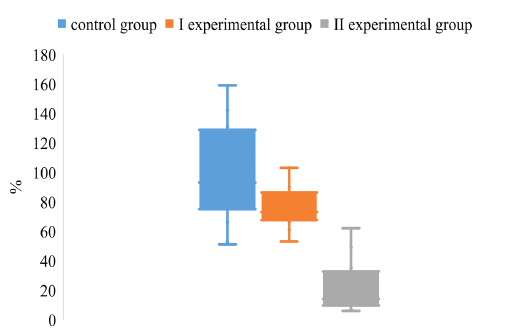
Analyzing the value of the CV index, it was found that in animals of experimental groups I and II the degree of dispersion is much lower compared to the control group (Figure 2).
It was found that the upper quartile of the CV of control group is about 62%, the lower quartile - 38%. The maximum value of the control group is about 92%. The minimum CV level reaches 22%. The above data indicate a high degree of variance of the values of the CV of animals in the control group.
Comparing the degree of dispersion of the CV index for different schemes of immunoprophylaxis of Aujeszky disease, it was found that the upper quartile of the experimental groups I and II are lower by 36% and 50%, respectively,
Table 1: The level of IgG to gB antigens of ADV in the pig’s blood of different age groups under different vaccination schemes (M±m, %, n=7)
Note: changes are considered to be statistically signifiсant at * – Р<0,05, ** – Р<0,01 relative to the parameters of the animals of the control group; pos. - percentage of seropositive animals; S/N - the calculation the competition percentage; CV is the coefficient of parameter variation in the group
Table 2: The level of IgG to gE antigens of ADV in the pig’s blood of different age groups under different vaccination schemes
Note: changes are considered to be statistically signifiсant at * – Р<0,05, ** – Р<0,01 relative to the parameters of the animals of the control group; pos. - percentage of seropositive animals; S/N - the calculation the competition percentage; CV is the coefficient of parameter variation in the group
compared with the control group. The lower quartiles of the arrays of CV values do not have significant differences.