Table 1 demonstrated that LBW was non-significantly altered in 1st, 2nd and 3rd weeks of treatments. While in the 4th week LBW, AA-gr showed significant (P<0.05) reduction when compared with C-gr and CA-gr. However, after 5 weeks of treatments, LBW of CA-gr was significantly (P<0.05) higher than the control and other treatments groups. Meanwhile, AA-gr showed significant (P<0.05) reduction as compared with both the C-gr and the CA-gr.
During the first week of treatments, feed consumption was significantly (P<0.05) reduced in all treated groups when compared with the control. In the 2nd week, there was no significant difference observed in chicken feed consumption among groups. After the 3rd and 4th week of treatments, both AA-gr and CO-gr induced a significant (P<0.05) reduction in feed consumption than control and CA-gr. At the last week of treatments a significant (P<0.05) reduction in feed consumption was observed in all treated groups as compared to control (Table 1).
Feed conversion ratio demonstrated a significant (P<0.05) reduction in all experimental groups as compared with control after the 1st week of treatments. However, at 2nd week, there was a significant (P<0.05) increase in AA-gr FCR than the control and, other treatments groups. At the end of the 3rd week of treatments, there was a significant (P<0.05) reduction in CA-gr and CO-gr as compared with AA-gr. After the 4th week there was significant (P<0.01) increase in the AA-gr FCR than the other groups. Meanwhile, there was significant (P<0.05) reduction in the CA-gr FCR than control. At the last week of treatments FCR showed a significant (P<0.05) reduction in CA-gr FCR than control and AA-gr (Table 1).
Liver weight was significantly (P<0.05) reduced in AA-gr than CA and CO-gr. While gizzard weight showed a
Table 2: Effect of organic acids (CA, AA and their combination) on edible organs weight (g), intestinal pH, villi length (µm) and crypts depth (µm) of Cobb broiler chicks
Values are means ± SE; Values within the same row with different superscripts (a,b &c) indicate significant difference at (P<0.05)
Table 3: Effect of organic acids (CA, AA and their combination) on serum T3 (ng/ml), T4 (ng/ml), HDL-c (mg/dl), LDL-c (mg/dl), TC (mg/dl) and TG (mg/dl) of Cobb broiler chicks
Values are means ± SE; Values within the same row with different superscripts (a,b &c) indicate significant difference at (P<0.05)
significant (P<0.05) increment in all treated groups as compared with the C-gr. Heart weight revealed significant (P<0.05) increase in the CA-gr than the C-gr and the CO-gr (Table 2).
The effect of water acidification on pH values of different segments of GIT showed no significant differences.
On the 2nd week, CA induced significant (P<0.05) increase in serum T3 concentration than the C-gr and the AA-gr. While T4 was significantly (P<0.05) elevated in CA-gr than AA-gr. However, in the 5th week the CA-gr and the Co-gr showed significant (P<0.05) elevation in serum T3 concentration than the C-gr. While serum T4 concentration significantly (P<0.05) elevated in all experimental groups than the C-gr (Table 3).
Table 3 demonstrated that TC and TGs were significantly (P<0.05) decreased in the AA-gr than the C-gr. However, HDL-c and LDL-c showed no significant changes in all experimental groups at the 2nd week. At the end of experimental period, TC and TGs showed a significant (P<0.05) reduction in the CA-gr, theAA-gr and the CO-gr than control. However, HDL-c was increased significantly (P<0.05) in all treated groups than control at the 5th week only. LDL-c showed significant (P<0.05) reduction in all treatments groups when compared to the control at the 5th week only.
Histomorphometric examination revealed an increase in both villus length and width, in addition, to increasing in crypt depth of small intestine of CA-gr and CO-gr compared to control and acetic acid groups (Figure 1). The morphometric analysis of intestinal villi length and crypts depth revealed a highly significant (P<0.05) increase in villus length in both CA-gr and CO-gr than the C-gr and the AA-gr. Moreover, crypt depth showed a highly significant (P<0.05) increase in CA-gr than other groups while CO-gr showed significant (P<0.05) increase in crypt depth than control and AA groups (Table 2). Goblet cell number per unit area of small intestine increased in birds treated with CA acidified water in comparison with control birds. The AA-gr showed tearing and sloughing of the intestinal mucosa (Figure 1C).
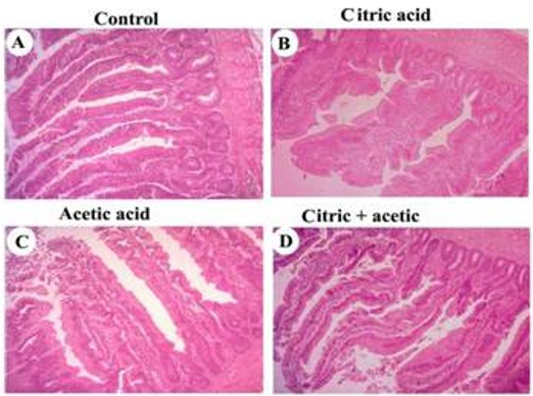
Figure 1: Photomicrographs showing small intestine of broiler chicks
control (A), citric acid (B), acetic acid (C) and citric+acetic acid (D) groups. Citric acid and citric+acetic groups showed an improvement in villus height and width. Goblet cells number per unit area of small intestine was increased in citric acid and citric+acetic acid groups. Acetic acid group showed degeneration and sloughing of intestinal mucosa. Hematoxylin and eosin stain (H&E stain). X100
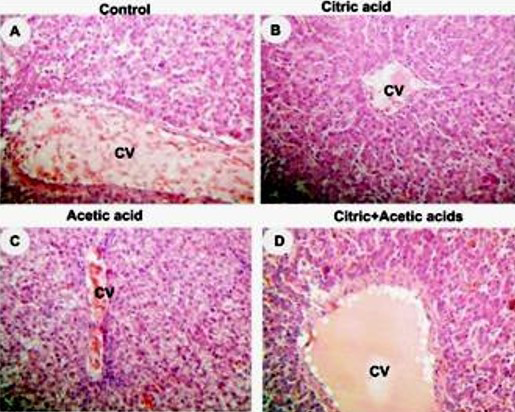
Figure 2: Photomicrographs showing liver of broiler chickens 5w old
control (A), citric acid (B), acetic acid (C) and citric+acetic acid (D) groups. Citric acid and combination groups showed normal hepatocytes architecture. Acetic acid group showed congestion in central vein (CV), hypremia and hydrobic degeneration in hepatocytes around CV. Hematoxylin and eosin stain (H&E stain). X250
Liver histopathology showed hyperemia and hydropic degeneration in acetic acid group (Figure 2C) while citric acid and combination groups showed normal architecture of liver parenchyma (Figure 2D).


