Research Article · Volume 40, Issue 1, 20 June 2025 · Open Access
Development and Evaluation of a Disease Predictive Model for Bemisia tabaci Population Management in Tomato Crops
· · · · · · · ·
Affiliations & Notes ⌄
- 1College of Biological Resource and Food Engineering, Qujing Normal University, Qujing 655011, Yunnan, China 2Department of Plant Pathology, University College of Agriculture, University of Sargodha (40100), Pakistan 3Department of Plant Pathology, Faculty of Agricultural Sciences and Technology, University of Layyah (31200), Layyah, Pakistan 4Department of Plant Protection, Ministry of National Food Security and Research Islamabad 5Department of Horticulture, Faculty of Agricultural Sciences and
Article Info ⌄
- Journal:
- Punjab University Journal of Zoology
- Published:
- 20 June 2025

From the article
- The comprehensive study of correlation conducted in the years 2021 and 2022 revealed that the variations in maximum and minimum temperatures, as well as the relative humidity, exhibited a more significant influence on the populations of B. tabaci on tomato genotypes compared to the effects of rainfall and wind speed.
- The correlation between B. tabaci population, rainfall, and wind speed was not statistically significant across all tomato genotypes, including Big Beef, Libnan Arif, Salma, and Po-02 (Table 1).
- It was concluded that temperature and relative humidity are key environmental factors affecting B. tabaci populations in tomato genotypes.
- Maximum temperature influences pest outbreaks, while increased relative humidity could suppress the B. tabaci population.
Selected from the article's own text.
Abstract
Introduction
The tomato, a widely cultivated plant, is known for its nutritional value and significant economic influence. Bemisia tabaci, commonly known as the whitefly, is an important global agricultural pest that poses challenges to crop production. B. tabaci transmits the tomato leaf curl virus, reducing agricultural productivity . Therefore, it is crucial to effectively manage populations of B. tabaci to restrict the spread of the tomato leaf curl virus .
The population dynamics of B. tabaci are influenced by environmental factors. Studying B. tabaci and its characteristics is essential for comprehending and managing these pests . Whiteflies often do significant harm to the yield and overall quality of tomatoes. Their influence requires efficient and enduring administration .
Weather impacts insect populations, pest behavior, prevalence, geographic distribution, and intensity. It is essential to comprehend the impact of climate on B. tabaci populations in pest management . Mitigating pest damage in agricultural systems requires understanding the impact of climate change on insect populations ; Ali et al., 2022a).
B. tabaci feeds on and transmits diseases, to tomato crops. The extent of harm is determined upon the developmental stage of the insect life cycle. The term ‘injury’ refers to harm caused to crops. The potential harm can encompass a decrease in production, a decrease in quality, or an increased susceptibility to plant diseases (Ali et al., 2022b, c). The life cycle stage of the insect might cause specific agricultural harm, which can further increase the overall damage . This study investigates the impact of climate variables on B. tabaci populations in different types of tomatoes.
The temperature, mainly the maximum range of 33-38°C, is a significant factor for what diseases. The temperature range specified is optimal for the reproduction and growth of B. tabaci . Elevated temperatures can expedite the growth and reproduction of these organisms, resulting in an augmentation of their population. A study by Denholm et al. (2005) established a correlation between increasing temperatures and the expansion of the B. tabaci population.
Precipitation, another significant epidemiological factor, can displace or cause mortality in B. tabaci. Further investigation is required to fully understand the intricate interaction between rainfall and B. tabaci populations . The impact of relative humidity and wind velocity on the life cycle of B. tabaci remains uncertain. Increased relative humidity can reduce the population of B. tabaci, while the specific mechanism behind this effect remains uncertain. Different studies have indicated that wind speeds do not significantly impact B. tabaci populations . This study aims to develop a predictive model to analyze the impact of temperature, rainfall, relative humidity, and wind speed on B. tabaci populations. This study also aims to utilize this model to design whitefly management strategies that can effectively mitigate the tomato leaf curl virus transmission.
Materials and Methods
Development of climate model for B. tabaci population prediction
To develop a disease-predictive model for B. tabaci prediction, four susceptible varieties (Big Beef, Libnan Arif, Salma, and Po-02) were cultivated in 2021 and 2022 at the Hafiz Abad Research Station, University of Layyah, in a Randomized Complete Block Design (RCBD) with three-replications. Each variety was cultivated in a plot measuring ten meters in length, with a distance of 70 cm between rows and 30 cm between each plant. Each week during the 2021-2022 growth seasons, the population of B. tabaci was recorded for each variance.
Data on the B. tabaci population were obtained from the disease screening nursery by randomly selecting 3-5 plants with insect infestations for each variety. To provide further insight, the affected plants exhibited indications of B. tabaci infection, such as the curling or yellowing of leaves or the presence of B. tabaci or their eggs on the undersides of the leaves. Weekly observations were taken of insect populations on the plants’ upper, middle, and lower leaves, as these locations are most suitable for B. tabaci survival and infection, according to Smith et al. (1998). This systematic technique enabled comprehensive and accurate sampling of plant structures. These components were sampled to study the plant’s distribution of B. tabaci populations. The averages were determined and reported. Using a microscope, B. tabaci was identified by examining the setae and transverse moulting sutures of the pseudo pupae .
Data collection of epidemiological variables
The environmental variables, comprising maximum and minimum temperatures, relative humidity, average rainfall, and wind speed, were collected daily from March to June during both the 2021 and 2022 agricultural seasons. The data was collected from observatory, situated in Karor-Layyah, and this observatory is owned and run by Pakistan Meteorological department. Then, weekly averages were calculated.
Evaluation of model
The model was assessed by using the procedures given by Snee (1977) and Chattefuee and Hadi (2006). The procedures are as under:
- Assessing the relationship between the regressand and regression coefficients using principles from the physical theory.
- Evaluation of collected data about projected data
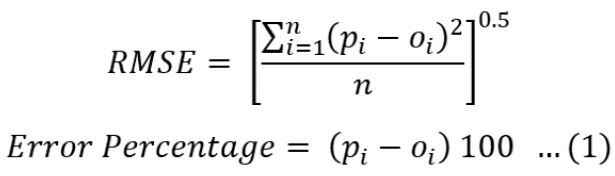
RMSE and % error were used to evaluate prediction accuracy . The equations utilized for calculating the root mean square error (RMSE) and percentage error were:

Pi and Oi denote the examined variables’ predicted and observed data points. Where, ‘n’ is the sum of observations. According to Willmott (1982), a model’s performance considered good when values of percentage error and root-mean square error (RMSE) fall within the range of ± 20.
Data analysis
Statistical analysis was performed using SAS 9.3 . ANOVA was used to identify significant factors, whereas LSD (P<0.05) was used to compare various test groups. These two methods are used because they can handle numerous comparisons and identify significant B. tabaci population-environmental variable interactions . Regression analysis was used to analyze environmental variables that correlated with whiteflies. A predicted climatic model for B. tabaci was created using stepwise regression . We used Root Mean Square Error (RMSE) and error (%) to evaluate multiple regression models. Both statistical methods provide a complete model correctness assessment across the observed dataset. The model’s error is measured by the RMSE and expressed as a percentage of the actual values. This dual-method approach thoroughly evaluates regression model prediction potential. Environmental factors that substantially impact B. tabaci populations were graphically represented, and their critical range for population increase were determined. The accuracy of predictive model was assessed by comparing the projected population estimates with the actual observed data. This study investigated the impact of environmental variables on all four genotypes of B. tabaci.
Results
The comprehensive study of correlation conducted in the years 2021 and 2022 revealed that the variations in maximum and minimum temperatures, as well as the relative humidity, exhibited a more significant influence on the populations of B. tabaci on tomato genotypes compared to the effects of rainfall and wind speed.
The association between the maximum and lowest temperature and the B. tabaci population on all genotypes, including Big Beef, Libnan Arif, Salma, and Po-02, was significantly positive. This suggests that increasing temperature leads to an increase in the population. Conversely, a negative association was observed between humidity and populations of B. tabaci in all studied tomato genotypes, including Big Beef, Libnan Arif, Salma, and Po-02. Increasing relative humidity reduced the populations of B. tabaci. The correlation between B. tabaci population, rainfall, and wind speed was not statistically significant across all tomato genotypes, including Big Beef, Libnan Arif, Salma, and Po-02 (Table 1).
Table 1: Correlation between epidemiological factors and B. tabaci population on tomato varieties in 2021–2022.
| Genotypes | Maxi. T (°C) | Mini. T (°C) | R.H. (%) | R.F. (mm) | WS (Km/h) |
| Big Beef | 0.99** 0.00 | 0.98* 0.01 | -0.86* 0.00 | 0.53 0.47 | 0.62ns 0.37 |
| Libnan Arif | 0.97* 0.02 | 0.98* 0.01 | -0.985* 0.00 | 0.44 0.27 | 0.56 ns 0.21 |
| Salma | 0.95** 0.00 | 0.97* 0.01 | -0.987** 0.00 | 0.66 0.16 | 0.74 ns 0.13 |
| Po-02 | 0.94* 0.02 | 0.971* 0.01 | -0.96* 0.01 | 0.37 0.31 | 0.50 ns 0.24 |
The upper values represent the Pearson’s correlation coefficient, while the lower values denote the probability level at P = 0.05; * = significant at P ≤ 0.05 and ns = Non-significant at P ≥ 0.05.
The data of environmental variables and B. tabaci population were used to develop a two-year disease-predictive model Y = -26.6 - 0.25x1 + 1.07x2 + 0.034x3 - 0.82x4 + 0.52x5, where Y is the B. tabaci population and x1, x2, x3, x4, and x5 are minimum temperature, maximum temperature, relative humidity, rainfall, and wind speed indicators, respectively. The model shows that B. tabaci populations take benefit from maximum and lowest temperatures. B. tabaci population increased by 1.07 units per unit of temperature. Each unit rise in relative humidity enhanced the population by 0.034 units. White fly populations decreased by 0.82 and 0.52 units per unit increase in wind speed and rainfall, respectively. Model equation shows that temperatures, humidity, wind speed, and precipitation affect B. tabaci populations. One unit of temperature increased the population by 1.07 units, whereas humidity raised it by 0.034 units. Wind speed and rainfall changes affected population of whitefly by 0.52 and 0.82 units (Table 2).
It was noticed that maximum temperature played the role of most crucial variable, accounting for 65% of the weightage in model (F=36.82, P<0.001). Minimum temperature influenced 53% of B. tabaci population variability (F=36.6, P<0.001). Whitefly population was highly affected by relative humidity, contributing 52% variability to the regression model (F=33.01, P<0.001). Rainfall only explained 50% of model variables with an F-value of 3.15 and P-value of 0.086. Wind speed explained 38% of B. tabaci population fluctuations with an F-value of 5.36 and a P-value of 0.028. Thus, the present disease predictive model with these five environmental components accounts for 38-65% of B. tabaci population variations, demonstrating the impact of ecological circumstances on pest outbreaks and the importance of creating predictive models for B. tabaci management (Table 2).
Table 2: Summary of a climate model for B. tabaci population based on epidemiological data collected over 202-2022.
| Studies variables | Number in model | Model R2 | C(p) | F value | P value |
| Max. temperature (°C) | 1 | 0.65 | 2.00 | 36.82 | 0.00* |
| Min. temperature (°C) | 2 | 0.53 | 2.00 | 36.63 | 0.00* |
| Relative humidity (%) | 3 | 0.52 | 2.00 | 33.01 | 0.00* |
| Rainfall (mm) | 4 | 0. 50 | 2.00 | 3.15 | 0.08 |
| Wind speed (Km/h) | 5 | 0.38 | 2.00 | 5.35 | 0.02 |
Regression co-efficients and B. tabaci dependent variable comparison with physical theory
The predicted model for the whitefly population based on two-year data (2021 and 2022) was tested using R2 , which exhibited a 0.55 value, indicating an acceptable alignment, particularly considering the field conditions that limit variable control. The estimated standard error was 1.48, confirming model accuracy (Table 3).
A significance level of P<0.05 was indicated by the regression model and F-distribution. Furthermore, environmental variables such as temperature, humidity, rainfall, and wind speed significantly affected the B. tabaci population at P<0.05. Table 4 shows that each variable had a standard error below 1. Thus, the model was flexible for B. tabaci population prediction. The regression analysis showed that maximum temperature was a significant predictor with a coefficient of 0.694 and a P-value of 0.001. The other environmental variables had P>0.05, making them less important (Table 5). A statistically significant model using physical theory and environmental variables was found to predict B. tabaci population dynamics in 2021 and 2022, assuming the maximum temperature component is most important.
Table 3: B. tabaci predictive model regression statistics for 2021 and 2022 data set
| Regression statistics | R | R2 | Adjusted R2 | Std. error of the estimate | Observations |
| 0.74a | 0.55 | 0.53 | 1.48 | 148.07 | |
| a. Predictors: (Constant), maximum temperature | |||||
Table 4: Assessing the variance of the predictive model for B. tabaci using data from two consecutive years, 2021-2022.
| Source | Sum of squares | df | Mean square | F value | Sig. |
| Regression | 81.59 | 1 | 81.59 | 36.82 | a0.00* |
| Residual | 66.48 | 30 | 2.21 | ||
| Total | 148.07 | 31 | |||
| a. Predictors: (Constant), maximum temperature | |||||
* = Significant at P <0.05; highly significant at P <0.01
Model evaluation
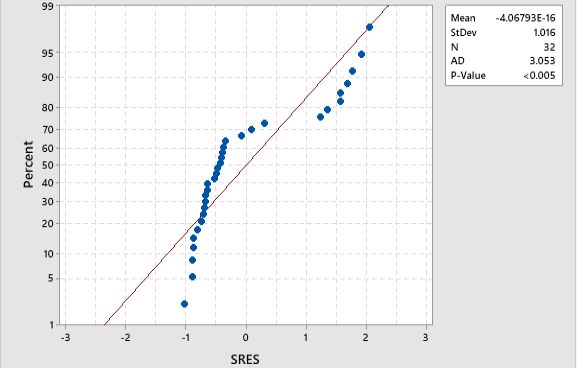
The second phase of model evaluation compared observed values to model predictions. The error (%) and Root Mean Squared Error (RMSE) criterion determined model prediction validity. A suitable model has a per cent error and RMSE of ± 20. Most forecasts utilising the two-year model for four tomato genotypes had a percent error of roughly ± 20 in this study. The standard probability plot of the 2021-2022 model showed that most data points were around the reference line, and few outliers affected the normal distribution. Interestingly, a 3% standardized residual indicated good agreement between actual and anticipated data points (Figure 1).
Table 5: The model, parameters, unstandardized and standardized coefficients t-statistics and significance.
| Model | Parameters | Unstandardized coefficients | Standardized coefficients | t | Sig. | ||
| B | Std. Error | Beta | |||||
| 1 | (Constant) | -18.35 | 4.24 | 4.33 | 0.00* | ||
| Maximum temperature | 0.69 | 0.11 | 0.74 | 6.07 | 0.00* | ||
| Excluded Variables a | |||||||
| Minimum temperature | -0.02b | 0.34 | 0.00 | -0.00 | 0.99 | ||
| Relative humidity | -0.04 b | 0.45 | 0.05 | -0.08 | 0.93 | ||
| Rainfall | -0.01 b | 0.68 | 0.81 | -0.08 | 0.93 | ||
| Wind speed | -0.00 b | 0.83 | 0.71 | -0.06 | 0.95 | ||
| a. Dependent Variable: B. tabaci population | |||||||
| b. Predictors in the model: (Constant), maximum temperature | |||||||
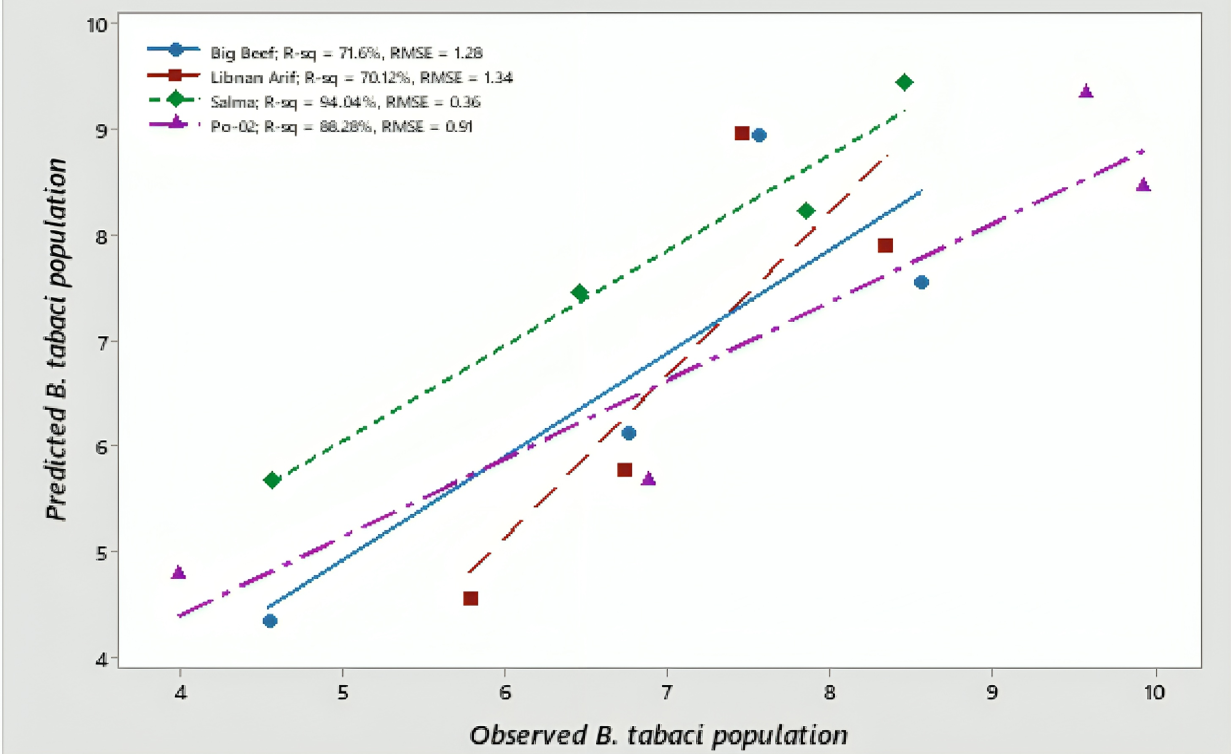
With R2 values over 90% and RMSE values under 20, all four tomato genotypes showed strong consistency between actual and projected data. Figure 2 shows that the stepwise regression model predicted B. tabaci populations.
Characterising B. tabaci conducive environmental conditions
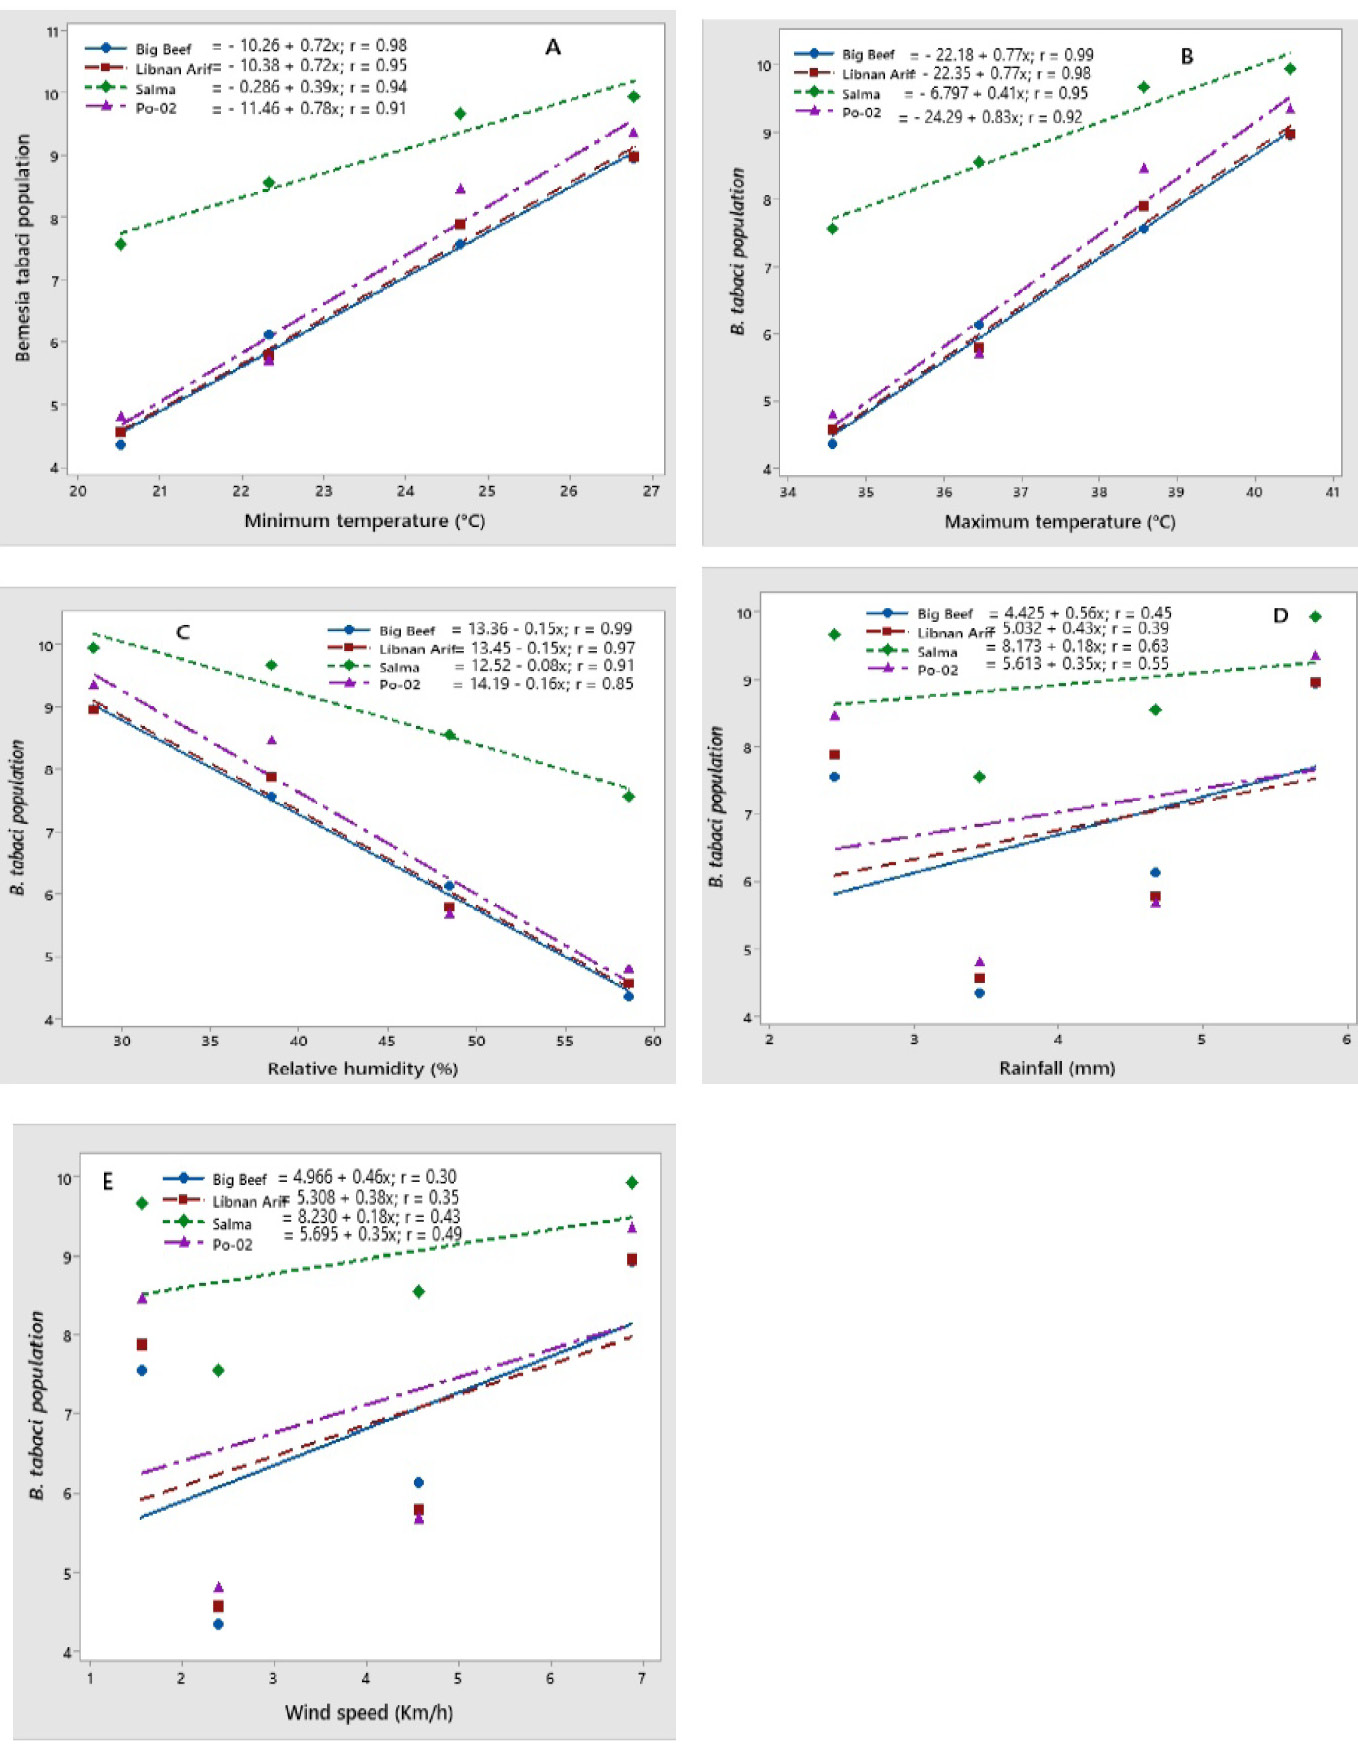
Regression analysis was performed on Big Beef, Libnan Arif, Salma, and Po-02 tomatoes varieties to determine the epidemiological factors that promote B. tabaci population growth. Two successive rating seasons, 2021-2022, showed a significant relationship between B. tabaci and all environmental parameters. B. tabaci populations rose significantly as minimum temperature increased, especially between 20.53 and 26.78 °C, on all four tomato types studied. The correlation coefficient (r) in Figure 3A shows that the linear regression model best describes the connection. Maximum temperature was the main factor affecting B. tabaci population growth. As the maximum temperature increase from 34.56-40.45 °C, B. tabaci increased (Figure 3B).
B. tabaci populations were negatively correlated with relative humidity. All tomato varieties decreased in number as humidity increased across both rating seasons (Figure 3C). Despite increased precipitation levels between 3.45-5.78 mm (Figure 3D) and wind speed between 2.4-6.87 km/h (Figure 3E), the B. tabaci population did not respond.
Discussion
Global tomato production is still reduced by tomato leaf curl virus and whitefly, resulting in significant costs. The control of vectors has effectively mitigated tomato leaf curl epidemics. Commercial growers are disappointed since no disease control alternatives that do not involve using resistant cultivars are available. However, collecting landscape-scale data over two years was used to develop a predictive model for whitefly population to uncover new insights that can be used to modify management techniques.
This research was motivated by the extensive failure of current management measures in controlling whitefly populations, which leads to major epidemics of tomato leaf curl virus. Considering the spatial and temporal characteristics of the whitefly populations and tomato leaf curl virus, it is essential to develop anticipated population management methods for this vector and virus. Integrating the disease prediction model with existing action thresholds is essential for developing a risk-predictive strategy to effectively manage the tomato leaf curl virus and its vector outbreaks. This method involves determining the specific whitefly population levels that indicate the need for management intervention. Moreover, the current investigation involved pesticide spraying, which is common in commercial farming.
A disease-predictive model showed that environmental variables are crucial to B. tabaci populations across tomato genotypes . Benjamin et al. (2021) and Khan et al. (2018) found that minimum and maximum temperatures and relative humidity significantly correlated with rainfall and wind speed. Den and Chio (2008) found that temperature controls pest dynamics and outbreaks. Our study found that insect growth is affected by maximum and minimum temperatures across all tomato genotypes, as suggested by Xia et al. (2022).
Another critical observation is the negative association between relative humidity and B. tabaci population (Zhang et al., 2021) a complicated interaction of elements. High humidity levels promote fungal diseases that reduce the population, but under certain low-humidity conditions, a further increase in humidity can create a more conducive environment for B. tabaci, increasing the population. This subtle relationship shows the complexity of pest-environment interactions. Thompson (2021) suggest that relative humidity may increase pest populations, which can help design pest management solutions. Rainfall and wind did not alter B. tabaci populations, contradicting prior pest dynamics research . Kadoum and Khidhir (2022) confirmed that pest dynamics are unaffected by rainfall and wind speed. Our study develops a multivariate regression model with components that match Rihawi et al. (2022). This study found that temperature affects B. tabaci dynamics, increasing population.
Our findings match Sanchezpos’s (2020) emphasis on the importance of maximum temperature in insect outbreaks. Even while temperature variables are important, our model showed that rainfall and wind speed had a lesser impact on B. tabaci dynamics , emphasizing the necessity for climate-specific management techniques that prioritize essential variables.
While the results section fully addresses how environmental variables affect B. tabaci populations, higher temperatures and lower relative humidity accelerate metabolic rates and reproductive cycles, increasing their populations. Warming temperatures improve insect physiological processes, increasing reproduction and population. However, decreasing humidity reduces fungal infections that harm B. tabaci, increasing their population . The statistical method was employed to test the model’s validity, and the findings were reasonable and comparable to Kadoum and Khidhir (2022).
Increasing temperatures and decreasing humidity helped B. tabaci develop (Zhang et al., 2021). High humidity decreases B. tabaci populations, as Thompson (2021) found. Finally, variable-specific pest dynamics management techniques are crucial ; . It stresses using climate-specific models in management plans to enable long-term B. tabaci resistant agriculture.
Conclusions
It was concluded that temperature and relative humidity are key environmental factors affecting B. tabaci populations in tomato genotypes. Maximum temperature influences pest outbreaks, while increased relative humidity could suppress the B. tabaci population. The climate model will help growers in managing B. tabaci by applying insecticides on time, resulting in more effective population management. The current study does not validate the proposed whitefly predictive model approach. Still, future research could assess the effectiveness of predictive, area wide whitefly management compared to calendar or scouting-based methods.
Declarations
Funding
The study did not receive any funding.
Data availability
Data will be made available upon request.
IRB approval and ethical statements
This study did not involve human or animal subjects, and thus required no Institutional Review Board (IRB) approval.
Declaration of generative AI and AI-assisted technologies in the writing process
During present investigation the author(s) did not used any AI and AI-assisted technologies in the writing process and take(s) full responsibility for the content of the published article.
Conflict of interest
The authors have declared no conflict of interest.
Figures

Normal probability plot for two years (2021-2022) model of B. tabaci population.

Comparison of observed and predicted data points of B. tabaci population on four tomato genotypes, i.e., Big Beef, Libnan Arif, Salma and Po-02 during crop growing seasons 2021-2022.

Relationship of relative minimum temperature (A), maximum temperature (B), relative humidity (C), Rainfall (D) and wind speed (E) with B. tabaci population on four tomato genotypes, viz., Big Beef, Libnan Arif, Salma and Po-02 during 2021-2022 crop growing seasons.
References
- Ali, Y., Raza, A., Aatif, H.M., Ijaz, M., Ul-Allah, S., Rehman, S.U. and Moustafa, M., 2022a. Regression modeling strategies to predict and manage potato leaf roll virus disease incidence and its vector. Agriculture, 12: 550. https://doi.org/10.3390/agriculture12040550[CrossRef]
- Ali, Y., Qin, A., Aatif, H.M., Ijaz, M., Khan, A.A., Ahmad, S. and Rahman, S.U., 2022b. A stepwise multiple regression model to predict Fusarium wilt in lentil. Meteor. Appl., 29: 1-12. https://doi.org/10.1002/met.2088[CrossRef]
- Ali, Y., Raza, A., Iqbal, S., Khan, A.A., Aatif, H.M., Hassan, Z. and Sas-Paszt, L., 2022c. Stepwise regression models-based prediction for leaf rust severity and yield loss in wheat. Sustainability, 14: 13893. https://doi.org/10.3390/su142113893[CrossRef]
- Bellows, Jr, T.S., Perring, T.M., Gill, R.J. and Headrick, D.H., 1994. Description of a species of Bemisia (Homoptera: Aleyrodidae). Ann. Entomol. Soc. Am., 87: 195-206. https://doi.org/10.1093/aesa/87.2.195[CrossRef]
- Benjamin, T. and Adams, R., 2021. Climatic factors and pest population dynamics: A review. Front. Ecol. Evol., 9: 334.
- Chattefuee, S. and Hadi, A.S., 2006. Regression analysis by example. John Wiley and Sons, Inc. Publ., New York, USA. pp. 21-71. https://doi.org/10.1002/0470055464[CrossRef]
- Den, J. and Chio, B., 2008. Impact of environmental variables on pest dynamics. J. Pest Manage., 54: 14-18. https://doi.org/10.1564/18apr03[CrossRef]
- Denholm, I., Cahill, M., Dennehy, T.J. and Horowitz, A.R., 2005. Challenges with managing insecticide resistance in agricultural pests, exemplified by the whitefly Bemisia tabaci. Philos. Trans. R. Soc. Lond. B Biol. Sci., 360: 1965-1971.
- Deutsch, C.A., Tewksbury, J.J., Tigchelaar, M., Battisti, D.S., Merrill, S.C., Huey, R.B. and Naylor, R.L., 2018. Increase in crop losses to insect pests in a warming world. Science, 361: 916-919. https://doi.org/10.1126/science.aat3466[CrossRef]
- Jones, D.R., 2003. Plant viruses transmitted by whiteflies. Eur. J. Pl. Pathol., 109: 195-219. https://doi.org/10.1023/A:1022846630513[CrossRef]
- Khan, M.A., Ali, Y., Abbas, H.Z. and Atiq, M., 2018. Spatio-temporal patterns of mungbean yellow mosaic virus and white fly population in relation to epidemiological factors. Int. J. Agric. Biol., 20: 2812-2816.
- Kadoum, A.M. and Khidhir, H.H., 2022. Environmental factors influencing pest populations: Bridging field observations and theoretical predictions. J. Environ. Pollut. Contr., 5: 111-122.
- Luck, J., Jeger, M. and Van den Bosch, F., 2011. Climate change and plant diseases. Annu. Rev. Pytopathol., 49: 489-509.
- Myers, R.H., 1990. Classical and modern regression with applications. PWS-Kent Publishing Company, Boston, USA.
- Navas-Castillo, J., Fiallo-Olivé, E. and Sanchez-Campos, S., 2011. Emerging virus diseases transmitted by whiteflies. Annu. Rev. Pytopathol., 49: 219-248. https://doi.org/10.1146/annurev-phyto-072910-095235[CrossRef]
- Naseer, S., Nadeem, I., Mustafa, A., Shah, J.A., Ahmed, S., Saqib, M. and Ali, Y., 2021. Management of Tomato leaf curl virus and its Bemisia tabaci vector in relation to prevailing environmental conditions of Faisalabad. Pak. J. Phytopathol., 33: 313-324. https://doi.org/10.33866/phytopathol.033.02.0696[CrossRef]
- Perring, T.M., 2001. The Bemisia tabaci species complex. Crop Prot., 20: 725-737. https://doi.org/10.1016/S0261-2194(01)00109-0[CrossRef]
- Rihawi, F., Johnson, A. and Weber, G., 2022. In-depth analysis of pest dynamics under varying climate conditions. J. Agric. Sci., 60: 356-370.
- Rokni, M., Tabari, H., Khalili, A., Rezaeian-Abadeh, M., Some’e, B.S. and Soltani, Z., 2020. Pest population dynamics and climate change: A comprehensive review. Glob. Ecol. Conserv., 22: e00936.
- Sanchezpos, C., 2020. Role of temperature in pest outbreaks. Entomol. J., 112: 213–219.
- SAS Institute., 1990. SAS user’s guide to statistics: (6.4th Ed.). SAS Inst., Inc., Cary, NC, USA.
- Sim, G. and Gurr, S., 2004. Effects of rainfall and wind on insect populations. J. Insect Pathol., 20: 221–225.
- Simmons, A.M. and Gurr, G.M., 2005. Trichomes of Lycopersicon species and their hybrids: Effects on pests and natural enemies. Agric. For. Entomol., 7: 265-276. https://doi.org/10.1111/j.1461-9555.2005.00271.x[CrossRef]
- Smith, J.A., Johnson, B.C. and Williams, D.E., 1998. Distribution and survival patterns of Bemisia tabaci on host plant structures. J. Entomol. Sci., 33(4): 245-260.
- Snee, R.D., 1977. Validation of regression models: Methods and examples. Technometrics, 19: 415-428. https://doi.org/10.1080/00401706.1977.10489581[CrossRef]
- Steel, R.G.D., Torrie, J.H. and Dickey, D.A., 1997. Principles and procedures of statistics: A biometrical approach, 2nd ed. McGraw-Hill, New York, USA.
- Thompson, K., 2021. The effect of rainfall patterns on agricultural pests: A review. Ann. Appl. Biol., 178: 134-144.
- Wallach, D. and Goffinet, B., 1989. Mean squared error of prediction as a criterion for evaluating and comparing system models. Ecol. Modell., 44: 200-306. https://doi.org/10.1016/0304-3800(89)90035-5[CrossRef]
- Willmott, C.J., 1982. Some comments on the evaluation of model performance. Bull. Am. Meteorol. Soc., 63: 1309-1313. https://doi.org/10.1175/1520-0477(1982)063<1309:SCOTEO>2.0.CO;2[CrossRef]
- Xia, J., Chen, P., Wang, P., Li, C. and Zhang, J., 2022. The interactive effects of temperature and humidity on insect pest distribution and abundance. Sci. Rep., 12: 2369.
- Zhang, Y., Li, X., Liu, X., Wang, H., Li, Z. and Liu, T., 2021. Interaction of temperature and humidity on developmental rate of agricultural pests. Pest Manage. Sci., 77: 378-386.
Services
Article usage statistics
Loading…