
Pollen replacement diets are growing more vital for the survival of healthy and powerful honey bee colonies. The current study revealed the impact of different protein-rich diets on protein and antioxidant contents and morphological changes in the midgut of Apis mellifera workers. Results showed substantial variations in terms of total protein (TP) and levels of antioxidants [total antioxidant content (TAX), glutathione (GSH), and lipid peroxidation (LPO) rates] between different diets for 6 and 12 days. In comparison to the other diets, honey bee colonies fed on diet 3 generally showed a significant decrease in their levels of TP, TAX, and GSH, whereas those fed on diet 5 and the control diet 1 showed a significant increase in these same levels. However, the highest LPO levels were in diet 2 and diet 3, as compared to the other diets. The histological structures of the midgut of honey bee workers fed on different diets showed significant differences. In contrast to control (Diet 1), the study observed alterations in the midgut of honey bee workers fed on all different diets for 6 and 12 days, as well as a variety of histological changes, particularly in the inner cell layer. The health of the morphological structure was also enhanced by comparable alterations in the peritrophic membrane, inner cellular layer, and epithelial cells in the midgut of honey bee workers fed on the control (Diet 1) and diet 5, respectively. In conclusion, these results indicate that diet 5 improved digestion and midgut development more than the other diets compared to the control.
Research Article · Volume 42, Issue 2, 9 May 2026 · Open Access
Comparative Study of the Influence of Artificial Diets on Protein Levels, Antioxidants and Midgut of Honey Bee Workers, Apis mellifera L.
· · ·
Affiliations & Notes ⌄
- 1Plant Protection Department, Faculty of Agriculture, Al-Azhar University, Assiut, Egypt
- 2Plant Protection Research Institute, Agricultural Research Center, Dokki, Giza, Egypt
- 3Zoology Department, Faculty of Science, Al-Azhar University, Assiut, Egypt. *Correspondence | Mahmoud M.A., Plant Protection Department, Faculty of Agriculture, Al-Azhar University, Assiut, Egypt
- 4Email: MahmoudAli.49@azhar.edu.eg
Article Info ⌄
- Journal:
- Sarhad Journal of Agriculture
- Published:
- 9 May 2026
From the article
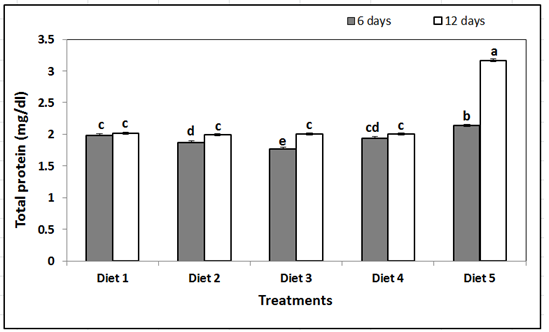
- The study showed that the individuals fed on diet 5 for 12 and 6 days had the highest total protein concentrations in honey bee workers, measuring 3.16 mg/dl and 2.14 mg/dl, respectively.
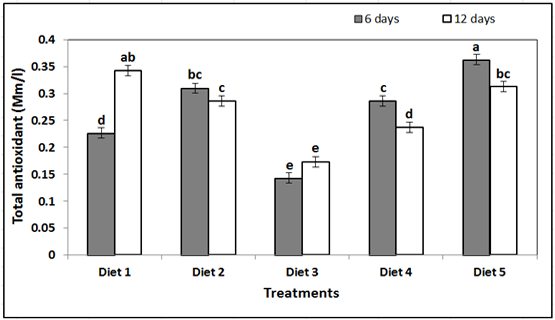
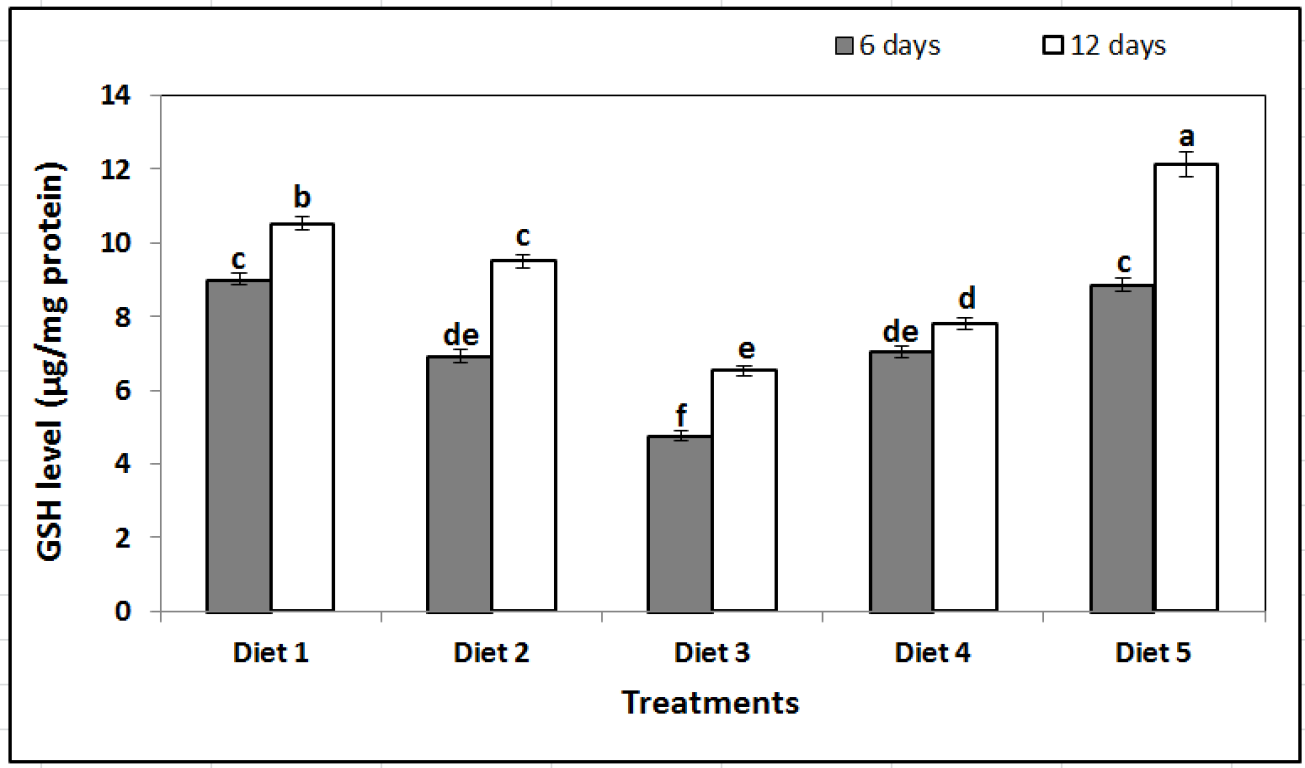
- It has been noted that honey bee workers fed on diet 5 had significantly higher levels of glutathione (GSH) and total antioxidant (TAX) than honey bee workers fed on other diets.
- On the opposing side, honey bee workers fed on diets 2 and 3 had significantly higher levels of lipid peroxidation (LPO), suggesting that these dietary conditions resulted in increased oxidative stress.
- The most advantageous results were obtained with diet 5, which improved midgut structure, protein content, and antioxidant levels.
Selected from the article's own text.
Abstract
Introduction
The honey bees, Apis mellifera L. (Hymenoptera: Apidae), are famous for their important contributions to ecology, science, and agriculture. Honey bees represent the sole livestock species that collect nectar and pollen to produce honey . Products made by honey bees, such as pollen, honey, royal jelly, propolis, and beeswax, are highly valuable both nutritionally and commercially. Also, honey bees play a vital role in agricultural ecosystems as pollinators . In response to colony collapse disorder, honey bee populations around the world have drastically decreased in recent decades due to the excessive application of antibiotics, poor breeding practices, nutritional deficiencies, and the careless use of pesticides, these are some of the possible causes of this phenomenon ; ; . In addition, disruption of the oxidative balance of honey bee workers that occurs due to pesticides, low temperatures, and pathogens in the hive which in turn affects the health and productivity of honey bee colonies ; .
To support both healthy honey bee workers development and rapid larval growth, protein is an essential part of honey bee nutrition ; . A lack of protein results in starvation of honey bees and is considered the main cause of colony collapse disorder . Also, there are established connections between protein-rich nutrition and immune function , and honey bees’ resistance to diseases is compromised by inadequate protein intake . The only natural protein supply that honey bees can eat is pollen; maintaining the health of honey bee colonies is contingent upon having enough of it in quantities as well as quality ; . Many investigations have demonstrated that pollen possesses a variety of compounds exhibiting antioxidant qualities ; . It is an important supplier of hydrophilic antioxidants, which guard against oxidative stress in the extracellular fluid, cytoplasm, and cell organelles. Pollen-based bee bread offers immature honey bees the protein, fat, vitamins, and minerals they need for growth and development ; . Additionally, a few pollen resources offer insufficient nutrition for the best colony development, according to Pernal and Currie (2001). It is imperative to identify solutions that mitigate pollen shortage in colonies of honey bees. To substitute the absence of the pure protein resource (pollen), alternative diets or supplements should be developed ; . In situations where pollen is inadequate or of low nutritional value, synthetic diets can be used as a replacement for natural pollen, offering vital proteins, fats, vitamins, and minerals . Pollen substitutes that are in the absence of natural pollen should be inexpensive, have a high nutritional value, and be easily embraced by honey bees all year long . For commercial beekeeping, numerous dietary formulations with different ingredient combinations have been developed and studied worldwide ; ; .
Dietary protein levels influence hemolymph protein amounts in honey bees, and the amount of protein in honey bee hemolymph can be used to gauge diet effectiveness ; . Nutritionally optimized protein diets enhance both total protein levels and the concentration of vitellogenin, a primary honey bee preservation protein . Insects rely on a robust antioxidant system due to their elevated metabolic rate, which results in substantial free radical generation under normal physiological conditions . The increased activity of antioxidant enzymes in total antioxidant (TAX), glutathione (GSH) levels detected in honey bee workers that fed a mixed diet of forage and pollen indicates an improved antioxidant defense, which enhanced the capacity of reactive oxygen species (ROS) reduction. The lower malondialdehyde (MDA) levels measured in honey bee workers fed a mixed diet (Diet and pollen) support this finding, as MDA is a recognized marker of oxidative stress . Compared to other insects, honey bees appear to have a limited capacity to combat reactive oxygen species (ROS). The relatively tiny number of genes encoding antioxidant proteins found in their genome suggests this . According to Alaux et al. (2010), malnutrition in honey bees is a sign of a compromised immune system. Stress induces behavioral and physiological reactions that have developed to improve survival in such situations; these reactions frequently require the allocation of resources for their production and maintenance .
Protein digestion and absorption occur primarily in the honey bee midgut . The honey bee midgut lacks a chitin lining and is therefore vulnerable to pathogens and toxic substances . The abundance of probiotic bacteria , the length of feeding periods , or epithelial protection against noxious agents have all been linked to high periplasm content in insects.
Many researchers have speculated that nutritional stress caused by low-quality pollen is one of the causes of the current decline of honey bee colonies. The study aims to investigate how different protein diets affect honey bee workers’ physiological functions. Also, to analyze the impact of these diets on the histomorphological features of the A. mellifera midgut, and to ascertain the relationship between the diet protein content and the antioxidant system of honey bee workers.
Materials and Methods
Diets preparation
Four artificial diets were employed as treatments for substitute pollen. These diets included both individual and combined forms of yeast, chickpeas, powdered sugar, date palm pollen, wheat germ, and skim milk. As shown in Table 1, the control group was fed on bee bread (pollen kept in comb cells).
Table 1: Ingredients of various experimental diets given to laboratory-maintained honey bee workers (Apis mellifera L.)
| Ingredients (%) | Diet | ||||
| D1 (control) | D2 | D3 | D4 | D5 | |
| Bee bread | 100 | - | - | - | - |
| Date palm pollen | - | 30 | - | - | 10 |
| Wheat germ | - | - | 30 | - | 10 |
| Skim milk | - | - | - | 30 | 10 |
| Powder sugar | - | 55 | 55 | 55 | 55 |
| Chickpeas | - | 10 | 10 | 10 | 10 |
| Yeast | - | 5 | 5 | 5 | 5 |
Experimental design
Colonies of the first hybrid Carniolan honey bees (Apis mellifera carnica) from the apiary of the Faculty of Agriculture, Al-Azhar University, Assiut, Egypt, provided the source of closed brood combs. In accordance with the procedure outlined by Williams et al. (2013), these combs were moved to regulated laboratory settings during the summer of 2024 to harvest freshly emerged honey bee workers. A total of 100 newly emerged honey bee workers (0–24 hours old) were housed in wooden cages (15 × 15 cm³), each featuring a glass panel on one side and black muslin on the opposite side. Each cage was equipped with a piece of wax comb affixed to the side to serve as a clustering substrate, along with two vials—one containing tap water and the other a 1:1 (w/v) sucrose solution. Each cage contains 5 g of each diet, and the diet was changed every 3 days. Honey bee workers were fed on different diets for 6 and 12 days. Three replicas were made for each diet. Samples of treated and control whole honey bee workers were stored in 5.0 mL Eppendorf tubes contain 70% ethyl alcohol after the experiment was over. Before analysis, the samples were preserved for 2 hours in Carnoy’s solution, which consists of 60% ethyl alcohol, 30% chloroform, and 10% glacial acetic acid.
Physiological studies
Preparation of tissue and biochemical analysis
Whole honey bee workers (6 and 12 days old) were tested for protein content and antioxidant enzyme activity. Following the procedure outlined by Tawfik et al. (2023), three pools of nine honey bee workers were homogenized and subjected to replicate of three analysis for each diet. The levels of total protein (TP) by the methods of Mahre et al. (2018), total antioxidant (TAX) by Koracevic et al. (2001), glutathione (GSH) by Beutler et al. (1963), and lipid peroxidation (LPO) by Ohkawa et al. (1979) were assessed in homogenates prepared from the whole bodies of honey bee workers. The assay was performed according to the instruction manual of reagent kits purchased from Biodiagnostic, Dokki, Giza, Egypt. The total protein (TP) was assessed at 550 nm. The total antioxidant (TAX) assay of honey bee workers was verified via spectrophotometry at 500 nm. GSH levels were measured at 340 nm by applying the protocol with 5,5’-dithiobis (2-nitrobenzoic acid) (DTNB) as a substrate. Also, the levels of LPO were measured.
Histological studies
After whole honey bee workers being fixed in Carnoy’s fluid, it is then dehydrated in absolute ethyl alcohol three times (15 minutes each time) before being cleared three times in methyl benzoate (8 hours each time) and toluene three times (2 hours total) before being embedded in paraffin wax at 60°C in an oven (2 hours each time) according to Drury and Wallington (1980). The Leica RM manual microtome was used to section paraffin wax blocks at 7μ thicknesses. Sections were dewaxed with xylene and rehydrated with descending ethyl alcohol (100%, 90%, 70%, and 50%), washed with distilled water, and then mounted on glass slides. Haematoxylin and Eosin (H&E) staining was used according to Bancroft et al. (2013); and dehydration with ethyl alcohol in increasing concentrations (50%, 70%, 90%, and 100%); and then xylene was used to clean the surface before mounting it with DPX mounting medium . Stained sections were photographed using a Carl Zeiss Microscope attached an Axio Camera Zeiss German company (Axio cam 712 color 20 mp, 2017), at Zoology Department, Faculty of Science, Assiut University (HE× 400, 25 μm)
Statistical analysis
Prior to statistical procedures, data were assessed for normality using the Shapiro–Wilk test. Subsequently, a one-way analysis of variance (ANOVA) was performed to examine the effect of dietary treatments. When significant differences were detected, pairwise comparisons among feeding diets were conducted using the Tukey–Kramer HSD test . All statistical procedures were carried out using the Statistical Analysis System (SAS Institute Inc., 2018).
Results
Influence of different artificial diets on the total protein content of honey bee workers
Our results at 6 and 12 days showed that the total protein content of honey bee workers administered different protein-rich diets was affected (Figure 1). The highest levels of total protein (3.16 mg/dl) were found in honey bee workers, which were fed on diet 5 for 12 days, followed by those that were fed on diet 5 for 6 days (2.14 mg/dl). The lowest total protein level (1.77 mg/dl) was found in honey bee workers that were fed on diet 3 for 6 days. Total protein levels of honey bee workers that were fed the remaining diets ranged between 2.01 and 1.88 mg/dl. Statistical analysis shows significant differences in the effect of various diets on total protein content levels of honey bee workers (F = 538; df = 9; P ≤ 0.001; Figure 1).
Influence of different artificial diets on antioxidants of honey bee workers
Total antioxidant levels
The findings show that the type of proteinaceous diet given to honey bee workers over a period of 6 and 12 days had a significant impact on their total antioxidant (TAX) levels (Figure 2). Honey bee workers fed on diet 5 for 6 days had the highest total antioxidant (TAX) level (0.36 Mm/l), followed by those fed on diet 1 for 12 days (0.34 Mm/l). Honey bee workers fed on other diets had TAX levels ranging from 0.31 to 0.14 Mm/l. A significant effect of diet type and TAX levels was found by statistical analysis (F = 55.80; df = 9; P ≤ 0.001; Figure 2).
Glutathione levels
The results reveal that the type of proteinaceous diet given to honey bee workers over 6 and 12 days significantly affected their glutathione (GSH) levels (F = 131; df = 9; P ≤ 0.001; Figure 3). Honey bee workers fed on diet 5 and the control (Diet 1) for 12 days had the highest GSH concentrations, measuring 12.11 and 10.51 µg/mg protein, respectively. Conversely, honey bee workers fed on diet 3 for six days showed the lowest GSH level (4.76 µg/mg protein). Honey bee workers fed the other diets had GSH levels ranging from 6.52 to 9.49 µg/mg protein.
Lipid peroxidation levels
The results demonstrated that the type of proteinaceous diet given to honey bee workers over a period of 6 and 12 days had a significant impact on their levels of lipid peroxidation (LPO) (F = 109; df = 9; P ≤ 0.001; Figure 4). Honey bee workers fed on diet 2 for 12 and 6 days had the highest LPO levels, measuring 8.50 and 8.33 nmol/mg protein, respectively. On the other hand, honey bee workers fed on diet 5 for 12 days had the lowest LPO level (3.54 nmol/mg protein). The range of LPO levels in honey bee workers fed on other diets was 5.54 to 8.17 nmol/mg protein.
Influence of different artificial diets on histological structures of honey bee workers
Histological analysis of honey bee workers midguts showed clear morphological changes in response to various proteinaceous diets. The midgut showed a typical architecture in honey bee workers fed on the control (Diet 1) for 6 and 12 days (Figure 5A and 6A). This included epithelial cells with intact, well-defined boundaries, homogeneous cytoplasmic inclusions, and distinctly visible apical striated borders, as well as a well-organized, multilayered peritrophic membrane and prominent epithelial folds along the entire mid
gut length. The majority of the cells were columnar epithelial cells, which were anchored to the basement membrane and organized in a single layer.
In honey bee workers fed on diet 1 for 6 days (Figure 5A), the epithelial midgut appeared elevated in certain areas, with granular cytoplasm and discernible peritrophic membranes. Both merocrine and holocrine secretions were clearly visible, and the intestinal lumen was slightly dilated. The peritrophic membrane was more noticeable, but the epithelial structure stayed mostly the same after 12 days of feeding on diet 1 (Figure 6A). Honey bee workers fed on diet 5, in contrast, showed only slight histological alterations. The epithelium looked elevated at 6 days (Figure 5B), with slightly vacuolated cytoplasm, especially at the basal region. It was easy to identify the peritrophic membrane. Within the intestinal lumen, homogeneous masses encircled by multiple peritrophic membranes were seen after 12 days (Figure 6B).
Honey bee workers fed on diet 2 showed more noticeable changes. In comparison to the control, the epithelial midgut displayed notable structural abnormalities at 6 and 12 days (Figure 5C and 6C), including decreased epithelial thickness and compromised peritrophic membrane integrity. Likewise, histological alterations in honey bee workers fed on diet 3 were similar to those seen in those fed
on diet 2. There were significantly fewer peritrophic membranes at 6 days (Figure 5D), and the epithelial lining displayed degenerative symptoms, with some cells separating but still loosely attached to the intestinal wall. Further degeneration was visible by 12 days (Figure 6D), with extensive cellular disintegration throughout the midgut and a discernible drop in the number and integrity of epithelial cells. Honey bee workers fed on diet 4 showed the most significant histological damage. Six days later, the peritrophic membrane looked noticeably thinner and the epithelial folds were either absent or sparse (Figure 5E). Out of all the diets, the epithelial cell density was the lowest. The quantity and size of ciliated columnar epithelial cells were significantly reduced at 12 days (Figure 6E). In addition to widespread necrosis and degeneration of gut epithelial cells, which included gut wall disintegration and epithelial cell separation, the peritrophic membrane was noticeably reduced.
In summary, the histological results show that the midgut integrity of honey bee workers was significantly impacted by the composition of their diet. Conversely, diets 2, 3, and particularly 4 caused varied degrees of structural damage, underscoring the significance of diet quality in preserving gut health. Diet 5 and the control (Diet 1) promoted healthier midgut morphology.
Discussion
The study showed that the individuals fed on diet 5 for 12 and 6 days had the highest total protein concentrations in honey bee workers, measuring 3.16 mg/dl and 2.14 mg/dl, respectively. The total protein level of honey bee workers fed on bee bread (Diet 1) for 12 days was 2.01 mg/dl. Individual development, longevity, foraging behavior, brood production, and pathogen resistance are all significantly impacted by the nutritional state of a honey bee colony ; , ; . These results, along with those of DeGrandi-Hoffman et al. (2010), point to a connection between diet and protein levels, suggesting that colony losses may be minimized by supplemental feeding to reduce protein stress. Basualdo et al. (2013) demonstrated that honey bee workers fed on a low-crude protein diet required a longer period to attain protein levels comparable to those of honey bees consuming a high-crude protein diet. Similarly, Ruth Archer et al. (2014) reported that protein-rich diets significantly enhanced honey bee survival rates. Supporting these findings, Tawfik et al. (2020) observed that newly emerged honey bee workers provided with a supplemental diet—comprising 200 g of feed per liter of sugar syrup and vitamin C administered every 10 days over 18 weeks—exhibited markedly elevated protein levels compared to other treatment groups. These studies collectively emphasize the critical role of dietary protein quality and supplementation in promoting optimal physiological development and longevity in honey bees. Tawfik et al. (2023) mentioned that honey bee workers fed on broad bean and clover bee bread had significantly higher concentrations of protein content than bees fed on cucumber, fennel, and maize bee bread.
It has been noted that honey bee workers fed on diet 5 had significantly higher levels of glutathione (GSH) and total antioxidant (TAX) than honey bee workers fed on other diets. On the opposing side, honey bee workers fed on diets 2 and 3 had significantly higher levels of lipid peroxidation (LPO), suggesting that these dietary conditions resulted in increased oxidative stress. These findings are in line with earlier research showing that vitamin C supplementation increases the activity of antioxidant enzymes like glutathione S-transferase (GST), catalase (CAT), and peroxidase (POX), as well as protein and GSH levels . Furthermore, Khider et al. (2013) found that maize pollen had better antioxidant qualities than pollen from date palm, and alfalfa.
The impact of diet on honey bee antioxidant defense mechanisms is further supported by the observation that the enzymatic activities of alkaline phosphatase (ALP), GST, and phenoloxidase (PO) differ based on the pollen source ; . Bee bread has been found to contain lipophilic antioxidants like coenzyme Q10 and alpha-tocopherol, which support vital cellular metabolic and regulatory processes . Particularly in situations of biotic and abiotic stress, the essential antioxidant enzymes GST, CAT, and SOD are essential for neutralizing reactive oxygen species (ROS) . Colonies given an 18-week supplemental diet showed improved antioxidant responses, according to Tawfik et al. (2020). Also, when compared to honey bees fed on bee bread from different floral sources like fennel, maize, cucumber, clover, and broad beans; honey bees fed only on sugar syrup showed noticeably lower levels of protein and GSH and higher levels of LPO . These results support the idea that supplementing diets high in protein can boost antioxidant capacity and increase honey bee workers’ resistance to oxidative stress.
Significant structural variations linked to dietary treatments were found by histologically analyzing the midgut of honey bee workers. The midgut epithelium of honey bee workers fed on the control (Diet 1, bee bread) retained a well-organized architecture, exhibiting prominent apical striations, a distinct peritrophic membrane, intact epithelial cell borders, and homogeneous cytoplasmic inclusions. After six and twelve days of feeding, columnar epithelial cells were the most common type. The nutritional value of bee bread, which offers vital proteins, fats, vitamins, and minerals, is in line with the findings of Herbert (1992). The development of young honey bees and the creation of essential tissues like glands and muscles depend on the proteins found in bee bread .
Honey bees fed on different diets, especially pollen substitutes, on the other hand, showed varied degrees of epithelial disruption, most likely as a result of variations in nutrient composition and digestibility . Increased dry matter content and improved fat body development demonstrated improved midgut morphology and feed utilization following supplementation with a combination of date palm pollen, wheat germ, and skim milk . However, some substitutes caused minor epithelial changes and increased perigastric membrane formation, particularly when combined with sugar syrup . Despite these changes, honey bees fed on pollen substitutes for up to 14 days showed no discernible degeneration of epithelial structures, with regeneration centers and cellular integrity largely intact . These findings support the importance of dietary protein quality for maintaining midgut health and cellular structure in honey bee workers and suggest that effective alternatives can mimic some benefits of natural pollen when honey bees face stress or pollen shortages ; .
Diets 2, 3, and 4 induced the most pronounced histological changes in the midgut epithelium of honey bee workers after 12 days, including extensive vacuolization, epithelial deformation, and reduced peritrophic membrane formation. These changes could be brought on by inadequate nutrient absorption and extended food retention in the gut, which could harm midgut cells. According to Crailsheim and Pabst (1988), even trace amounts of minerals in honey can cause the peritrophic membrane to rupture and the midgut to dissipate within six days. The observed variations demonstrate the dynamic interplay between honey bee physiology and nutritional inputs as well as the differing effects of diet composition on midgut integrity.
Conclusions and Recommendations
This study reveals that the physiological and histological health of honey bee workers is greatly influenced by their dietary composition. The most advantageous results were obtained with diet 5, which improved midgut structure, protein content, and antioxidant levels. Conversely, oxidative stress and epithelial damage were linked to diets 2, 3, and 4. These results emphasize the significance of balanced, nutrient-rich diets for honey bee health and colony productivity, particularly during times of pollen scarcity. Future studies should examine the field applications and long-term effects of optimal supplemental diets.
Novelty Statement
The study provides new insights into how diet composition affects honey bee nutrition, enhance antioxidant defenses and midgut health, contributing to the development of improved artificial diets for honey bee colonies sustainability.
Author’s Contribution
All authors are in agreement with the content of the manuscript and were involved in all steps of its preparation.
Generative AI or AI-assisted technology statement
The authors declare that no generative AI and AI-assisted technologies were used for this manuscript.
Conflict of Interest
The authors declare no conflict of interest.
Figures
The total protein content (mg/dl) of honey bee workers that were fed on various artificial diets for 6 and 12 days. Data as mean ± SE. The Tukey–Kramer HSD test at P ≤ 0.05 indicates that columns with the same letter are not significantly different.
The total antioxidant (Mm/l) of honey bee workers that were fed on various artificial diets for 6 and 12 days. Data as mean ± SE. The Tukey–Kramer HSD test at P ≤ 0.05 indicates that columns with the same letter are not significantly different.
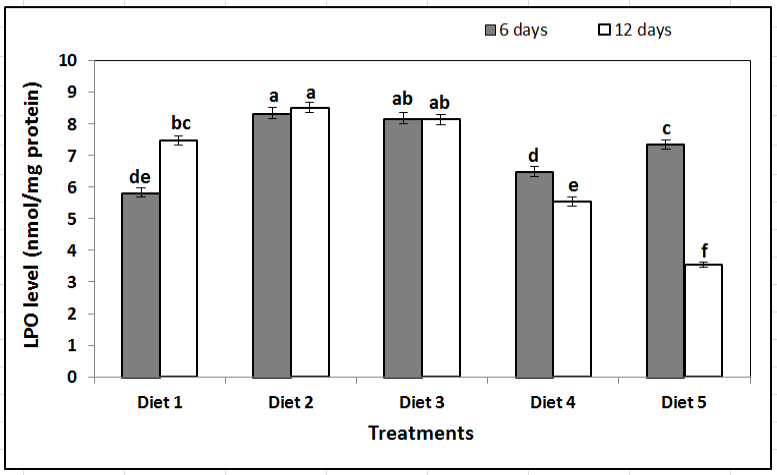
Lipid peroxidation (LPO) levels (nmol/mg protein) in honey bee workers fed on various artificial diets for 6 and 12 days. Data as mean ± SE. The Tukey–Kramer HSD test at P ≤ 0.05 indicates that columns with the same letter are not significantly different.
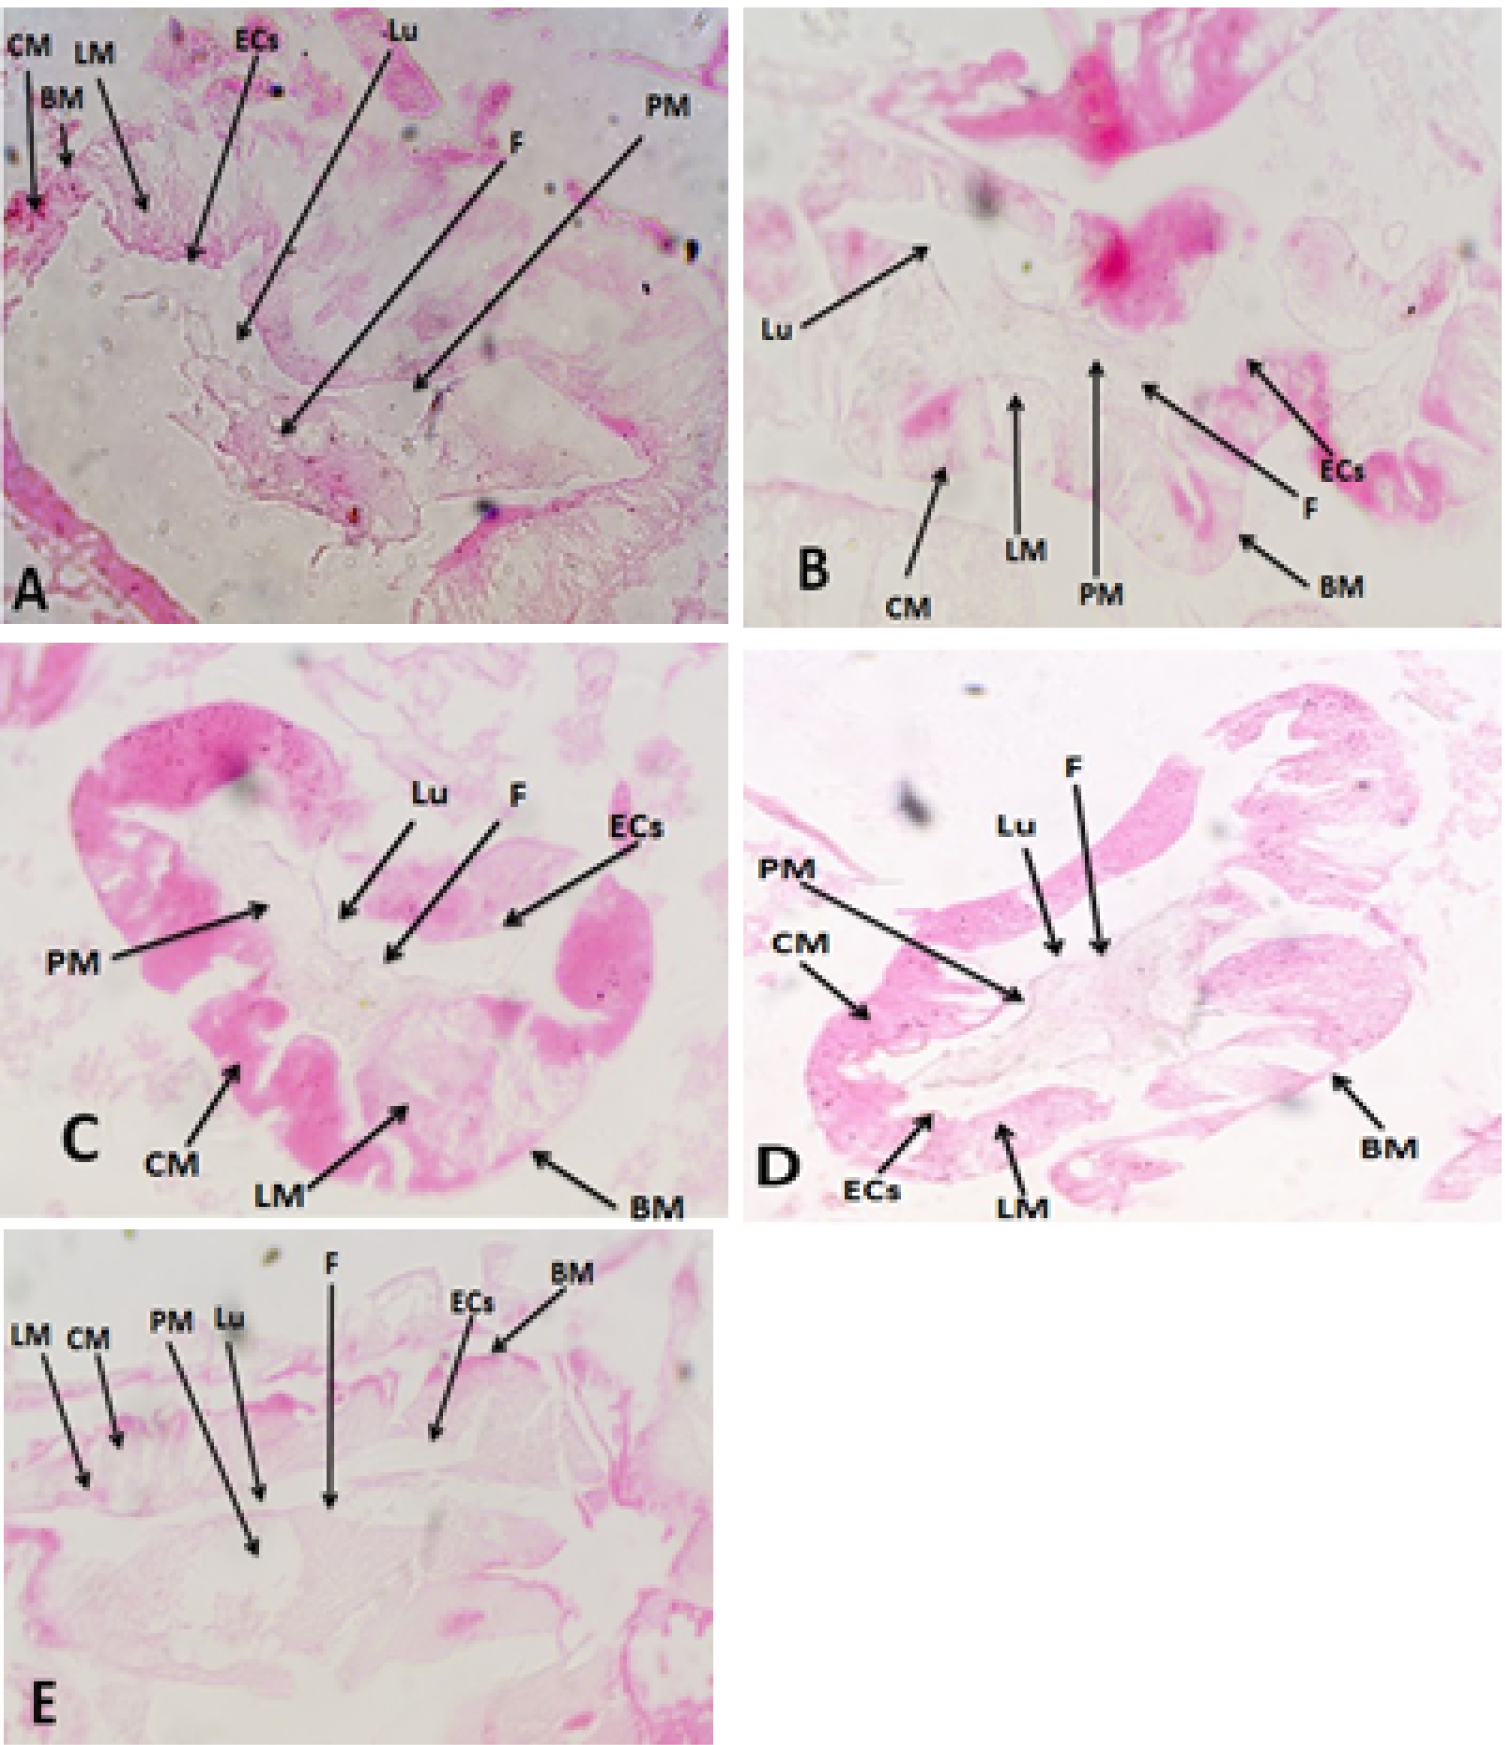
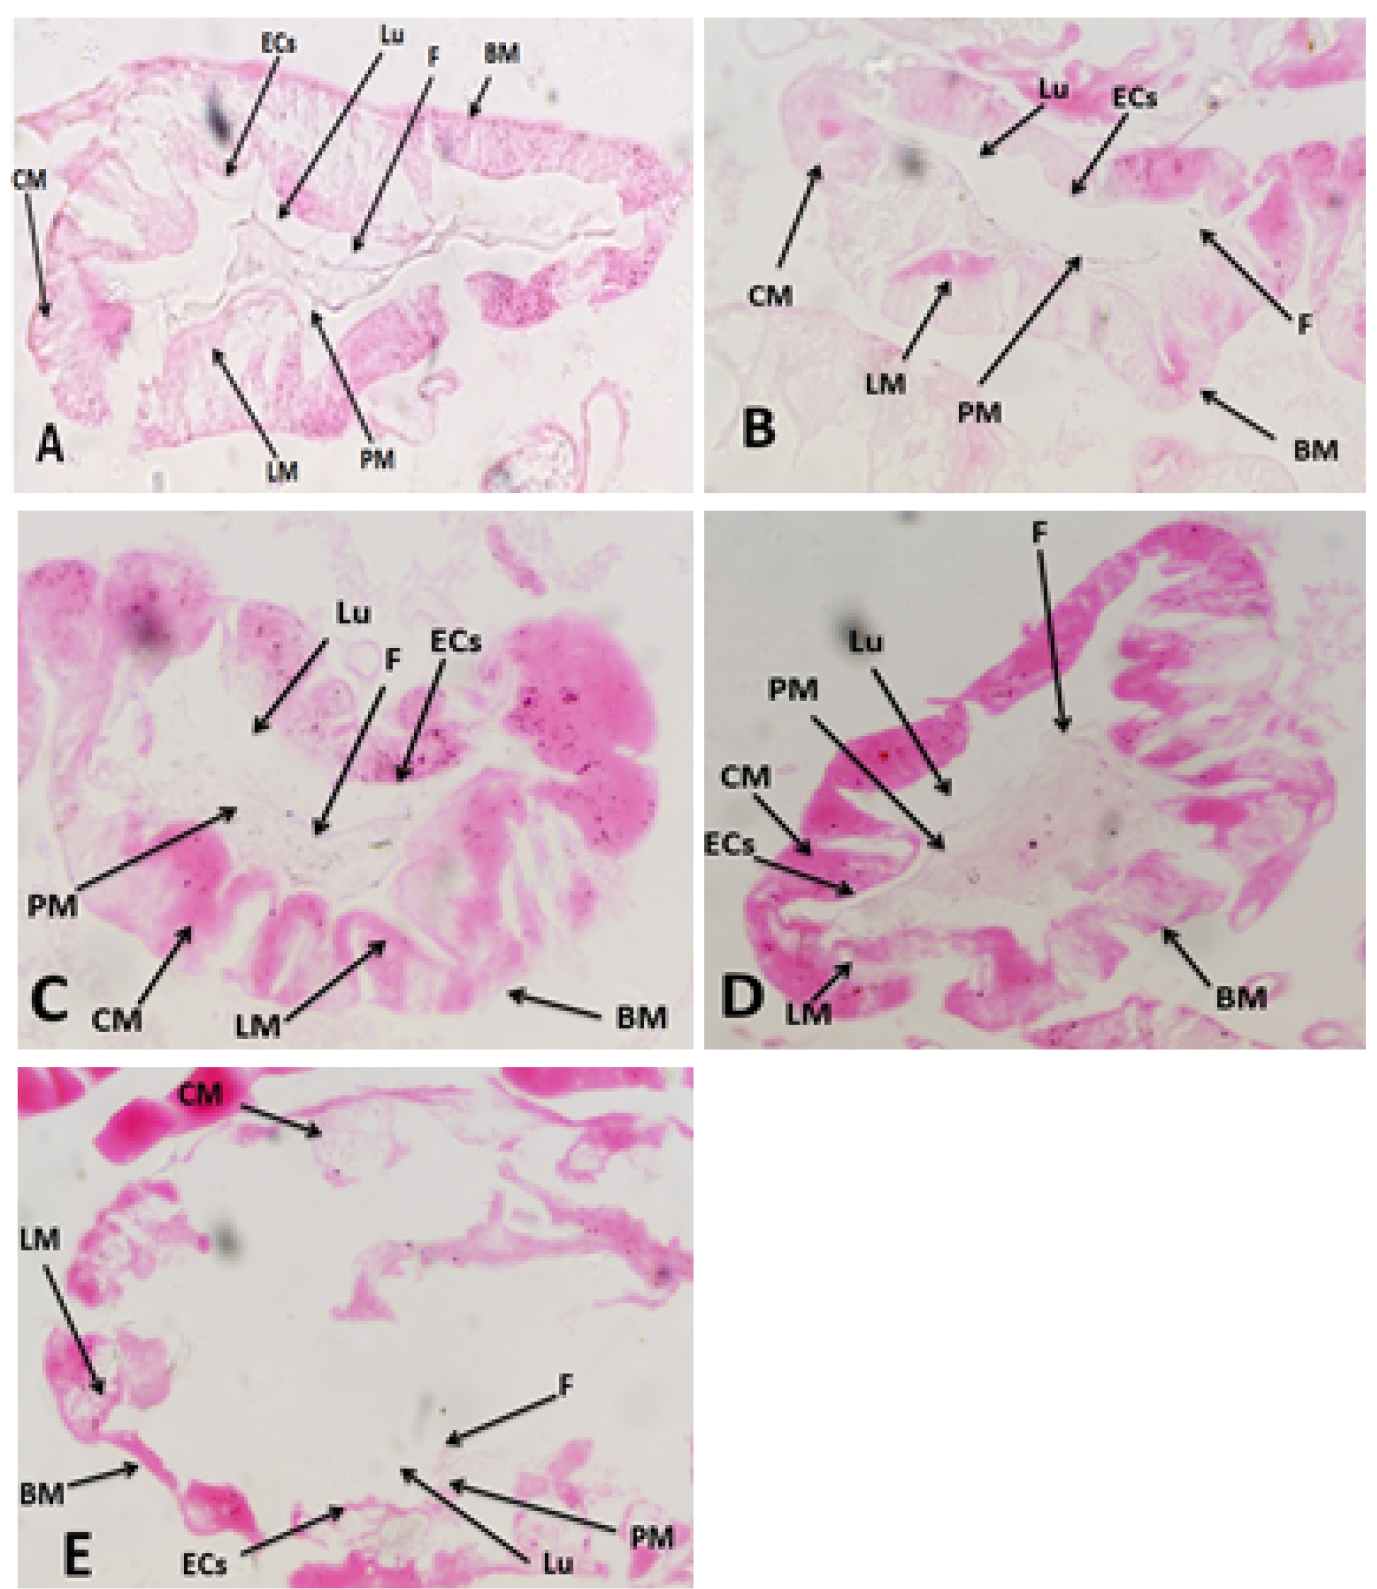
Light microscopic image of midgut of honey bee workers fed on diet 1 (control) for 12 days (Fig. 6A), showed a similar and improve in cell epithelium and Peritrophic membranes was numerous; in bees fed on diet 5 (Fig. 6B) epithelial cells clearly visible, very numerous peritrophic membranes; in bees fed on diet 2 (Fig. 6C) was similar to those fed for 6 days, and peritrophic membrane decrease; in bees fed on diet 3 (Fig. 6D) was showed the number of epithelium in the inside diameter of the midgut decreased, some gut epithelial cells degenerated; in bees fed on diet 4 (Fig. 6E) there are differences as the epithelial folds are less and cells were severely necrosis and degenerated. . BM: Basement Membrane; CM: Circular Muscle; ECs: Epithelial cells; F: food; H&E: Hematoxylin and Eosin; LM: Longitudinal Muscle; Lu: Lumen; MG: Midgut; PM: Peritrophic Membrane.
References
- Ahmed, Z.H., A.I. Tawfik, M.F. Abdel-Rahman and A.M. Moustafa. 2019. Nutritional value and physiological effects of some proteinaceous diets on honey bee workers (Apis mellifera L.). Bee World, 97(1): 26–31. https://doi.org/10.1080/0005772X.2019.1672983[CrossRef]
- Alaux, C., F. Ducloz, D. Crauser and Y. Le Conte. 2010. Diet effects on honey bee immunocompetence. Biol. Lett., 6(4): 562–565. https://doi.org/10.1098/rsbl.2009.0986[CrossRef]
- Anđelković, B., G. Jevtić, M. Mladenović, J. Marković, M. Petrović and N. Nedić. 2012. Quality of pollen and honey bee bread collected in spring. J. Hyg. Engin. Des., 275–277.
- Bancroft, J.D., C. Layton and S.K. Suvarna. 2013. Bancroft’s theory and practice of histological techniques (7th Ed.). Elsevier/Churchill Livingstone.
- Barragan, S., M. Basualdo and E.M. Rodriguéz. 2016. Conversion of protein from supplements into protein of hemolymph and fat bodies in worker honey bees (Apis mellifera L.). J. Apic. Res., 54(4): 399–404. https://doi.org/10.1080/00218839.2016.1158534[CrossRef]
- Basualdo, M., S. Barragan, L. Vanagas, C. Garcia, H. Solana, E. Rodriguez and E. Bedascarrasbure. 2013. Conversion of high and low pollen protein diets into protein in worker honey bees (Hymenoptera: Apidae). J. Econ. Entomol., 106(4): 1553–1558. https://doi.org/10.1603/EC12466[CrossRef]
- Beutler, E., O. Duron and B.M. Kelly. 1963. Improved method for the determination of blood glutathione. J. Clin. Lab. Med., 61: 882–888.
- Bielenin, I. and Z. Ibek. 1980. Influence of sodium fluoride on midgut epithelium of honey bee, Apis mellifera L. - in Polish] Zeszyty Naukowe Akademii Rolniczej Krakowie, 159(20): 49–67.
- Bobis, O., D. Dezmirean, L.A. Marghitas, V. Bonta, R. Margaona, C. Pasca, A. Urcan and P. Singh Bandhar. 2017. Bee bread from Apis mellifera and Apis dorsata. Comparative chemical composition and bioactivity. Bull. UASVM Anim. Sci. Biotechnol., 74(1): 43–50. https://doi.org/10.15835/buasvmcn-asb: 12620[CrossRef]
- Borges, D., E. Guzman-Novoa and P.H. Goodwin. 2021. Effects of prebiotics and probiotics on honey bees (Apis mellifera) infected with the microsporidian parasite Nosema ceranae. Microorgan., 9(3): 481. https://doi.org/10.3390/microorganisms9030481[CrossRef]
- Borycka, K., D. Grabek-Lejko and I. Kasprzyk. 2015. Antioxidant and antibacterial properties of commercial bee pollen products. J. Apic. Res., 54(5): 491–502. https://doi.org/10.1080/00218839.2016.1185309[CrossRef]
- Brodschneider, R. and K. Crailsheim. 2010. Nutrition and health in honey bees. Apidologie, 41(3): 278–294. https://doi.org/10.1051/apido/2010012[CrossRef]
- Candy, D.J., A. Becker and B. Wegener. 1997. Coordination and integration of metabolism in insect flight. Comp. Biochem. Physiol. Part - B: Biochem. Mol. Biol., 117(4): 497–512. https://doi.org/10.1016/S0305-0491(97)00212-5[CrossRef]
- Crailsheim, K. 1988. Transport of leucine in the alimentary canal of the honey bee (Apis mellifera L.) and its dependence on season. J. Insect Physiol., 34(12): 1093–1100. https://doi.org/10.1016/0022-1910(88)90210-7[CrossRef]
- Crailsheim, K. 1990. The protein balance of the honey bee worker. Apidologie, 21(5): 417–429. https://doi.org/10.1051/apido:19900504[CrossRef]
- Crailsheim, K. and M.A. Pabst. 1988. Der Einfluss von honig mit hohem mineralstoffgehalt auf die sterblichkeit und das mitteldarm gewebe der honigbiene (Apis mellifera carnica Pollm) im winter. Mitt. Deutsch. Ges. Allg. Angew. Entomol., 6(2): 125–135.
- Crailsheim, K., L. Schneider, N. Hrassnigg, G. Bühlmann, U. Brosch, R. Gmeinbauer and B. Schöffmann. 1992. Pollen consumption and utilization in worker honey bees (Apis mellifera carnica): Dependence on individual age and function. J. Insect Physiol., 38(6): 409–419. https://doi.org/10.1016/0022-1910(92)90117-V[CrossRef]
- De Jong, D., E.J. Da Silva, P.G. Kevan and J.L. Atkinson. 2009. Pollen substitutes increase honey bee haemolymph protein levels as much as or more than does pollen. J. Apic. Res., 48(1): 34–37. https://doi.org/10.3896/IBRA.1.48.1.08[CrossRef]
- Decourty, A., E. Mader and N. Desneux. 2010. Landscape enhancement of floral resources for honey bees in agro- ecosystems. Apidologie, 41(3): 264–277. https://doi.org/10.1051/apido/2010024[CrossRef]
- DeGrandi-Hoffman, G. and Y. Chen. 2015. Nutrition, immunity and viral infections in honey bees. Curr. Opin. Insect Sci., 10: 170–176. https://doi.org/10.1016/j.cois.2015.05.007[CrossRef]
- DeGrandi-Hoffman, G., Y. Chen, E. Huang and M.H. Huang. 2010. The effect of diet on protein concentration, hypopharyngeal gland development and virus load in worker honey bees (Apis mellifera L.). J. Insect Physiol., 56(9): 1184–1191. https://doi.org/10.1016/j.jinsphys.2010.03.017[CrossRef]
- Del Rio, D., A.J. Stewart and N. Pellegrini. 2005. A review of recent studies on malondialdehyde as toxic molecule and biological marker of oxidative stress. Nutr. Metab. Cardiovasc. Dis., 15(4): 316–328. https://doi.org/10.1016/j.numecd.2005.05.003[CrossRef]
- Di Pasquale, G., M. Salignon, Y. Le Conte, L.P. Belzunces, A. Decourtye, A. Kretzschmar, S. Suchail, J-L. Brunet and C. Alaux. 2013. Influence of pollen nutrition on honey bee health: Do pollen quality and diversity matter? PLoS ONE, 8(8): e72016. https://doi.org/10.1371/journal.pone.0072016[CrossRef]
- Drury, R.A. and E.A. Wallington. 1980. Carleton’s histological technique. 5th Edition, Oxford University Press, London, pp. 195.
- Farjan, M., M. Dmitryjuk, Z. Lipiński, E. Łopieńska-Biernat and K. Zoltowska. 2012. Supplementation of the honey bee diet with vitamin C: The effect on the antioxidative system of Apis mellifera carnica brood at different stages. J. Apic. Res., 51(3): 263–270. https://doi.org/10.3896/IBRA.1.51.3.07[CrossRef]
- Gamal Eldin, N.K., A.A. Ebeid, A.M. Sallam and N.K. Basuny. 2018. Effect of pollen supplements and substitutes on honey bee queen ovaries and worker hypopharyngeal glands. Mansoura J. Plant Prot. Pathol., 9(2): 83–91. https://doi.org/10.21608/jppp.2018.41253[CrossRef]
- Glavinic, U., B. Stankovic, V. Draskovic, J. Stevanovic, T. Petrovic, N. Lakic and Z. Stanimirovic. 2017. Dietary amino acid and vitamin complex protects honey bee from immunosuppression caused by Nosema ceranae. PLoS ONE, 12(11): e0187726. https://doi.org/10.1371/journal.pone.0187726[CrossRef]
- Gregorc, A. and I.D. Bowen. 2000. Histochemical characterization of cell death in honey bee larvae midgut after treatment with Paenibacillus larvae, Amitraz and Oxytetracycline. Cell Biol. Int., 24(5): 319–324. https://doi.org/10.1006/cbir.1999.0490[CrossRef]
- Gregorc, A., B. Sampson, P. Knight and J. Adamczyk. 2019. Diet quality affects honey bee (Hymenoptera: Apidae) mortality under laboratory conditions. J. Apic. Res., 58(4): 492-493. https://doi.org/10.1080/00218839.2019.1614736[CrossRef]
- Herbert, E.W. 1992. Honey bee nutrition, In: Graham J.M. (Ed.), the hive and the honey bee. Dadant and Sons, Hamilton, IIIinois., 197–233.
- Hoover, S.E.R., H.A. Higo and M.L. Winston. 2006. Worker honey bee ovarian development: seasonal variation and the influence of larval and adult nutrition. J. Comp. Physiol. B: Biochem. Syst. Environ. Physiol., 176(1): 55–63. https://doi.org/10.1007/s00360-005-0032-0[CrossRef]
- Hryniewicka, M., A. Karpinska, M. Kijewska, M.J. Turkowicz and J. Karpinska. 2016. LC/MS/MS analysis of α-tocopherol and coenzyme Q10 content in lyophilized royal jelly, beebread and drone homogenate. J. Mass Spectrom., 51(11): 1023–1029. https://doi.org/10.1002/jms.3821[CrossRef]
- Human, H. and S.W. Nicolson. 2003. Digestion of maize and sunflower pollen by the spotted maize beetle Astylus atromaculatus (Melyridae): is there a role for osmotic shock?. J. Insect Physiol., 49(7): 633–643. https://doi.org/10.1016/s0022-1910(03)00049-0[CrossRef]
- Khider, M., K. Elbanna, A. Mahmoud and A.A. Owayss. 2013. Egyptian honey bee pollen as antimicrobial, antioxidant agents, and dietary food supplements. Food Sci. Biotechnol., 22(5): 1461–1469. https://doi.org/10.1007/s10068-013-0238-y[CrossRef]
- Kieliszek, M., K. Piwowarek, A.M. Kot, S. Błażejak, A. Chlebowska-Śmigiel and I. Wolska. 2018. Pollen and bee bread as new health-oriented products: A review. Trends Food Sci. Technol., 71: 170–180. https://doi.org/10.1016/j.tifs.2017.10.021[CrossRef]
- Koracevic, D., G. Koracevic, V. Djordjevic, S. Andrejevic and V. Cosic. 2001. Method for the measurement of antioxidant activity in human fluids. J. Clin. Pathol., 54(5): 356–361. https://doi.org/10.1136/jcp.54.5.356[CrossRef]
- Kourtis, N. and N. Tavernarakis. 2011. Cellular stress response pathways and ageing: Intricate molecular relationships. The EMBO J., 30(13): 2520–2531. https://doi.org/10.1038/emboj.2011.162[CrossRef]
- Kramer, C.Y. 1956. Extension of multiple range tests to group means with unequal numbers of replications. Biomet., 12(3): 307–310. https://doi.org/10.2307/3001469[CrossRef]
- Li, Z., M. Hou, Y. Qiu, B. Zhao, H. Nie and S. Su. 2020. Changes in antioxidant enzymes activity and metabolomic profiles in the guts of honey bee (Apis mellifera) larvae infected with Ascosphaera apis. Insects, 11(7): 1–12. https://doi.org/10.3390/insects,11070419[CrossRef]
- Mahre, H.K., L. Dalheim, G.K. Edvinsen, E.O. Elvevoll and I.J. Jensen. 2018. Protein determination-method matters. Foods, 7(1): 5. https://doi.org/10.3390/foods7010005[CrossRef]
- Martinello, M. and F. Mutinelli. 2021. Antioxidant activity in bee products: A review. Antioxidants, 10(1): 71. https://doi.org/10.3390/antiox10010071[CrossRef]
- Matilla, H.R. and G.W. Otis. 2006. The effects of pollen availability during larval development on the behavior and physiology of spring-reared honey bee workers. Apidologie, 37(5): 533–546. https://doi.org/10.1051/apido:2006037[CrossRef]
- Mortensen, A.N., C.J. Jack, T.A. Bustamante, D.R. Schmehl and J.D. Ellis. 2019. Effects of supplemental pollen feeding on honey bee (Hymenoptera: Apidae) colony strength and Nosema spp. infection. J. Econ. Entomol., 112(1): 60–66. https://doi.org/10.1093/jee/toy341[CrossRef]
- Mucci, C.A., L. Ramirez, R.S. Giffoni and L. Lamattina. 2021. Cold stress induces specific antioxidant responses in honey bee brood. Apidologie, 52(3): 596–607. https://doi.org/10.1007/s13592-021-00846-w[CrossRef]
- Nicolson, S.W. 2011. Bee food : the chemistry and nutritional value of nectar, pollen and mixtures of the two. Afr. Zool., 46(2): 197–204. https://doi.org/10.1080/15627020.2011.11407495[CrossRef]
- Oakeshott, J.G., R.M. Johnson, M.R. Berenbaum, H. Ranson, A.S. Cristino and C. Claudianos. 2010. Metabolic enzymes associated with xenobiotic and chemosensory responses in Nesonia vitripennis. Insect Mol. Biol., 19(1): 147–163. https://doi.org/10.1111/j.1365-2583.2009.00961.x[CrossRef]
- Ohkawa, H., N. Ohishi and K. Yagi. 1979. Assay for lipid peroxides in animal tissue by thiobarbituric acid reaction. Anal. Biochem., 95(2): 351–358. https://doi.org/10.1016/0003-2697(79)90738-3[CrossRef]
- Paray, B.A., I. Kumari, Y.A. Hajam, B. Sharma, R. Kumar, M.F. Albeshr, M. Abul Farah and J.M. Khan. 2020. Honey bee nutrition and pollen substitutes: A review. Saudi J. Biol. Sci., 28(1): 1167–1176. https://doi.org/10.1016/j.sjbs.2020.11.053[CrossRef]
- Pernal, S.P. and R.W. Currie. 2001. The influence of pollen quality on foraging behaviour in honey bees (Apis mellifera L.). Behav. Ecol. Sociobiol., 51(1): 53–68. https://doi.org/10.1007/s002650100412[CrossRef]
- Puškadija, Z., L. Spiljak and M. Kovacic. 2017. Late winter feeding stimulates rapid spring development of carniolan honey bee colonies (Apis mellifera carnica). Poljoprivreda, 23(2): 73–76. https://doi.org/10.18047/poljo.23.2.11[CrossRef]
- Ruth Archer, C., C.W.W. Pirk, G.A. Wright and S.W. Nicolson. 2014. Nutrition affects survival in African honey bees exposed to interacting stressors. Funct. Ecol., 28(4): 913–923. https://doi.org/10.1111/1365-2435.12226[CrossRef]
- Saffari, A., P.G. Kevan and J.L. Atkinson. 2010. Palatability and consumption of patty-formulated pollen and pollen substitutes and their effects on honey bee colony performance. J. Apic. Sci., 54(2): 63–71.
- SAS Institute Inc. 2018. Statistical Analysis System (SAS), Version 9.4. Cary, NC, USA.
- Seitz, N., K. Traynor, N. Steinhauer, K. Rennich, M. Wilson, J. Ellis, R. Rose, D. Tarpy, R. Sagili, D.M. Caron, K.S. Delaplan, J. Rangel, K. Lee, K. Baylis, J. Wilkes, J.A. Skinner, J.S. Pettis and D. van Engelsdorp. 2016. A national survey of managed honey bee 2014–2015 annual colony losses in the USA. J. Apic. Res., 54(4): 292–304. http://doi.org/10.1080/00218839.2016.1153294[CrossRef]
- Silva, P.D., F.A.S. Oliveira, H.P. Pedroza, I.C.N. Adelha, M.M. Melo and B. Soto-Blanco. 2015. Pesticide exposure of honey bees (Apis mellifera) pollinating melon crops. Apidologie, 46(6): 703–715. https://doi.org/10.1007/s13592-015-0360-3[CrossRef]
- Stevanovic, J., Z. Stanimirovic, P. Simeunovic, N. Lakic, I. Radovic, M. Sokovic and L.J.V. Griensven. 2018. The effects of Agaricus brasiliensis extract supplementation on honey bee colonies. An. Acad. Bras. Cienc., 90(1):219–229. https://doi.org/10.1590/0001-3765201820150182[CrossRef]
- Szymaś, B. 1976. Histological examination of changes in midgut epithelium of honey bees fed pollen substitutes. Zootechnika, 22: 141-147.
- Szymaś, B. 1994. Evaluation of the nutritive value of pollen substitutes for honey bee (Apis mellifera L.). Rocz AR Pozn., Rozprawy Naukowe, pp. 68.
- Szymaś, B. and A. Przybył. 2007. Midgut histological picture of the honey bee (Apis mellifera L.) following consumption of substitute feeds supplemented with feed additives. Nauka Przyroda Technol., 1(4): 48.
- Szymaś, B., A. Langowska and M. Kazimierczak-Baryczko. 2012. Histological structure of the midgut of honey bees (Apis mellifera L.) fed pollen substitutes fortified with probiotics. J. Apic. Sci., 56(1): 5–12. https://doi.org/10.2478/v10289-012-0001-2[CrossRef]
- Tawfik, A.I., Z.H. Ahmed, M.F. Abdel-Rahman and A.M. Moustafa. 2020. Influence of winter feeding on colony development and the antioxidant system of the honey bee, Apis mellifera. J. Apic. Res., 59(5): 752–763. https://doi.org/10.1080/00218839.2020.1752456[CrossRef]
- Tawfik, A.I., Z.H. Ahmed, M.F. Abdel-Rahman and A.M. Moustafa. 2023. Effect of some bee bread quality on protein content and antioxidant system of honey bee workers. Int. J. Trop. Insect Sci., 43(1): 93–105. https://doi.org/10.1007/s42690-022-00888-2[CrossRef]
- Tellam, R.L., G. Wijffels and P. Willadsen. 1999. Peritrophic matrix proteins. Insect Biochem. Mol. Biol., 29(2): 87–101. https://doi.org/10.1016/s0965-1748(98)00123-4[CrossRef]
- Wijayati, N., D.S. Hardjono, M. Rahmavati and A. Kurniawati. 2019. Formulation of winged bean seeds as pollen substitute for outgrowth of honey bees (Apis mellifera L.). J. Phys. Conf. Ser., 1321(2): 022040. https://doi.org/10.1088/1742-6596/1321/2/022040[CrossRef]
- Williams, G.R., C. Alaux, C. Costa, T. Csaki, V. Doublet, D. Eisenhardt and R. Brodschneider. 2013. Standard methods for maintaining adult Apis mellifera in cages under in vitro laboratory conditions. J. Apic. Res., 52(1): 1–36. https://doi.org/10.3896/IBRA.1.52.1.04[CrossRef]
- Ye, Z.M., W.K. Dai, X.F. Jin, R.W. Gituru, Q.F. Wang and C.F. Yang. 2014. Competition and facilitation among plants for pollination: can pollinator abundance shift the plant– plant interactions? Plant Ecol., 215(1): 3–13. https://doi.org/10.1007/s11258-013-0274-y[CrossRef]
- Zerbo, A.C., R.L.M.S. Moraes and M.R. Brochetto-Braga. 2001. Protein requirements in larvae and adults of Scaptotrigona postica (Hymenoptera: Apidia, Meliponinae): midgut proteolytic activity and pollen digestion. Comp. Biochem. Physiol., Part B, 129(1): 139–147. https://doi.org/10.1016/s1096-4959(01)00324-4[CrossRef]
- Zheng, B., Z. Wu and B. Xu. 2014. The effects of dietary protein levels on the population growth, performance, and physiology of honey bee workers during early spring. J. Insect Sci., 14(1): 1–7. https://doi.org/10.1093/jisesa/ieu053[CrossRef]
Services
Article usage statistics
Loading…