Institute of Development Studies, the University Agriculture, Peshawar, Khyber Pakhtunkhwa, Pakistan.
dinzia1985@gmail.com

Selected from the article's own text.
Institute of Development Studies, the University Agriculture, Peshawar, Khyber Pakhtunkhwa, Pakistan.
dinzia1985@gmail.com
The contribution and role of agriculture in economic development is different for developed and developing countries. In developed economies like USA and Korean republic the lion’s share of agriculture output is used as input in further economic activities (Pryor and Holt, 1999). The agriculture sector has made a significant progress in terms of multiple cropping, yield per acre, crop intensification and input technology in the past sixty years.
With the rapid rise in demand for cereal, the performance of agriculture sector is immensely important. The key crops produced around the world are Wheat (714.8) Million Metric tons, Rice (476.9) Million metric tons, Cotton (120.3) Million Metric tons, Barley (145.24) and Coarse Grains (1,280.4) Million Metric tons .
In Pakistan, agriculture consumes 43.7 percent of the labor force. These people not only produce their own food but for the value added sector too. The prime objective of the agriculture sector of Pakistan is to reduce poverty and to provide food to those who are directly engaged in the sector as well to the rest of the population. The sector was under tremendous pressure and had faced problems in last few years. In spite all, the growth rate of the sector was 2.1 percent with the contribution of wheat, rice, sugarcane, maize and cotton of 5.4 percent to GDP. The growth and development of the sector is among the key objectives of the agriculture policy of the Government of Pakistan (GOP, 2013-14).
The researched crop Rice (Oryza Sativa L.) is among the leading crops on which human largely depends. The crop is labor intensive and requires ample water and is best suited to regions of high rain fall. Rice was cultivated on 11 percent of country’s land and is the third largest crop and a source of foreign exchange earnings. Its contribution to GDP was 0.7 percent and 3.1 percent to the value added sector. The major category of rice produced is basmati with IRRI (White rice) production in some parts of country too. The production and area under rice is on the rise mainly due to profitable market, excessive rains and potential for export (GOP, 2013-14). Rice a monsoon crop and is grown throughout the country with Punjab being the leading province in terms of basmati Varity. The main rivals of the crop are India, Vietnam, Thailand and Burma. District swat of Khyber Pakhtunkhwa province is the study area, which is known for its fruits and rice production. The total land area of the district is 500 thousand hectares, of which only one fifth is cultivated and rest is under forest (Cropping Reporting Services, 2006-07).
In developing economies, the social (efficiency) values of profitability deviates from private profitability due to market failure or intervention of government.
The specific objectives of the study are:
In recent past, Ilyas et al. (2005), Quddus and Mustafa (2005), Khan and Akhtar (2006), Rehman et al. (2011) and Ali and Khan (2012) has used the PAM methodology to investigate the competitiveness and comparative advantages of various agriculture commodities.
District swat has a historical position among the districts of Khyber Pakhtunkhwa. The district is surrounded by hilly areas mountains. The total land area is around five lakh hectares of which only one lakh is cultivable. The total population of the district was one hundred and twenty five thousand of which 52% were males. Most of the economically active population was consisted of males (District Census Repot,1998). Five villages, one each from selected union council was selected. The selected area has rich background in rice and has easy accessibility.
Proportional allocation technique was used to select a sample of 120 farmers from the total 5600 farmers in the selected union councils. The selected union council and villages were Manyar (Barikot), Takhtaband (Mingora), koat and alabad (Charbagh) and kotanai (Kotanai).
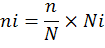
The Proportional Allocation Sampling Technique is used as follows.
Where ;
ni= Sampled respondents in village I; i= No. of villages in the study area (from 1 to 5); n= Total sample size (120); N= Total number of respondent’s farmers in five villages (5600); Ni= Total Number of farmers in ith villages.
Primary data was collected through questionnaire and through personal interviews with farmers and secondary data was taken from the reports of the govt. agencies.
The methodology of PAM consists of a simplified analytical framework which is based on budget estimates for farming, marketing and processing of the selected agricultural commodity. The entries in PAM table consist of costs, revenues and profit valued at market and social opportunity cost prices. The advantage of PAM is that the result can be disaggregated to focus on a particular region.
aNet Private Profitability: E= A-(B+C+D); bNet Social Profitability: J= F-(G+H+I); cOutput Transfer: K= A-F; dLabor Market Distortions: L=B-G; eCapital Market Distortions: M=C-H; fOther Input Transfer: N=D-I; gTotal Policy Effects: O= E- J = K- (L+M+N) = NPP-NSP=PSEtotal.
Table 1: Structure of Policy Analysis Matrix (PAM).
| Budget Items | Private Budget at Market Price | National Budget at National Opportunity Cost | Effect of Policy (Divergence) |
| Revenue | A | F | Kc |
| Labor cost | B | G | Ld |
| Capital cost | C | H | Me |
| Tradable input cost | D | I | Nf |
| Profit | Revenue less costs Private values Ea | Revenue less costs social values Jb | Total Policy Effects Og |
Table 2: PAM Estimates for rice crop of District Swat Export promotion regime 2013-FX Premium 3%.
| Items | Private prices | Social prices | Divergence |
| Output /Revenue | 67515.21 | 66606.22 | 908.98 |
| Labor | 24671.64 | 24671.64 | 0 |
| Capital | 7325.99 | 7178.83 | 147.16 |
| Tradable | 27356.46 | 28177.15 | -820.69 |
| Profit | 8161.12 | 7094.62 | 1066.5 |
| Net Private Profitability: E= A-(B+C+D) | E= 8161.2 | ||
| Net Social Profitability: J= F-(G+H+I) | J=6580.22 | ||
| DRCr= 0.83 | SBCr=1.11 | ||
| NPCr=1.01 | EPCr=1.05 | ||
| PSEr=0.023 | SRPr=0.023 | ||
The two important measures in the PAM table are, profit for private and social values and divergence. The profit in observed prices shows competitiveness while in social terms it indicates comparative advantage. The divergence in values shows policy effects and is an important indication for economic policies. The indicators of comparative advantage are Domestic resource cost ratio (DRCr) and Social benefit cost ratio (SBCr) given in PAM terminologies.
Domestic resource cost ratio (DRCr) = (G+H) / (F-I)
Social benefit cost ratio (SBCr) = F / (G+H+I)
The indicators of policy effects given in PAM terminologies are:
Nominal protection coefficient ratio (NPCr)= A / F
Effective protection coefficient (EPCr) = (A-D) / (F-I)
Producer subsidy equivalent (PSEr) = O / A
Subsidy ratio to producer (SRPr) = O / F
These characteristics include educational level of farmers, land tenurial status, farm size and area under rice cultivation. These factors help in understanding the result of the study and do affect the outcome. About 61% of the farmers were under matriculate and only 14% were matriculate or above, the rest were illiterate. Regarding the land tenurial status, 62% of the growers were found tenants. The survey data further indicates that small farm size i.e. 1-3 acres dominated the sampled data.
The average cost of production was Rs. 55587.09 per acre of which cost of fertilizer was the leading cost factor. The wholesale price of rice paddy in the study area for the study period stood at Rs.1731.25 per 40 kg of crop yield. The price has shown an upward jump in the year 2013-14 as when compared with preceding years.
The items of the PAM table consist of labor, capital and tradable inputs. Initially, the private values are calculated and then the input and output values are converted into Social values with foreign exchange premium of 3%. The Shadow exchange rate premium indicates that for the study year dollar was underpriced by 3% in comparison to Pakistani rupee. The last column of PAM budget indicates the divergence or convergence regarding transfer of resources from and to rice farmers due to market failure or government intervention. For export parity regime, the national opportunity cost values are obtained by the multiplication of yield (output) and export parity price, whereas for import parity the process is vice versa.
The calculated PAM budget items and the measurement indicators are depicted in Table 2.
Less than unity value of Domestic resource cost ratio DRCr and greater than one value of Social Benefit Cost ratio SBCr indicate that the study area is enjoying a comparative advantage in producing IRRI/Basmati rice crop. Both the indicators suggest that the national cost of transforming the resources to yield a unit of foreign exchange is smaller, hence the country is using their resources efficiently and its contribution to national welfare is positive.
This study has used the approach of Policy Analysis Matrix PAM to assess the comparative advantage and competitiveness of rice crop of swat farming region for harvesting year 2013-14. The data of Agriculture policy institute API were used to estimates indicators of comparative advantage DRCr and SBCr and indicators of policy effects NPCr, EPCr, PSEr and SRPr. The indicators of comparative advantage and competitiveness depicting an encouraging situation for export promotion regime of rice crop of district Swat. The other set of indicators like NPC and EPC shows that the farmers of rice crop in the region are receiving more than the border prices and are supported by government policies. The last two indicators show an overall transfer from taxpayers and consumers to producers. Since Pakistan has clear comparative advantage in rice production as export promotion, therefore it is recommended that both the government and private sector should encourage rice production for export by extending all kinds of financial and infrastructural support.
Pakistan is ranked 10th in terms of area allocated to rice crop, but in terms of yield its ranking is 61th in the world. The current study suggests to the policy makers to devise policies to improve yield per acre. The study also recommends introducing Cost reduction techniques, easy credit system to farmers, awareness campaign regarding global rice trends and timely availability of fertilizers should be ensured.
For an agricultural economy like Pakistan, it is impertive to know the comparative advantage of major crops in export promotion regime.
Zia Ud Din: Collected the data, analysed the data and derived the results.
Noor Paio Khan: drafted the manuscript.
Loading…