Means, standard deviations and the coefficients of variation of the variables are shown in Table 1. The coefficient of variation of most of the variables is lower than 10%, except for the slaughter age and live weight. These results were similar to those reported by Kidwell (1955) for the withers height (WH), the chest width (CW), the pelvis width (PW), and the chest girth (CG). However, other measurements had lower coefficients of variation except for live weight (LW) which had a higher value. This similarity is to be expected given the variety of ages and live weights of animals used in our study compared to that of Kidwell (1955) study. Compared with the values recorded in this paper, Ternan et al. (1959) found higher coefficients of variance for all overlapping parameters, except for the live weight that had a lower value. The variety of animal types used by these authors as opposed to the Holstein cull cows used in the present study may explain these variations.
Furthermore, in Tunisia, over half of cattle herds are mainly composed by Holstein reared for milk production rather than local breeds. In addition, these disparities could be also related to the low number of cull cows used in this experiment due to the limitation of animal identification procedures which is considered as a major constraint for animal data collection and recording in the country. The results obtained in the present study could change with larger data sets.
Table 1: Mean, standard deviation (SD), and coefficient of variation (CV) of the variables.
Table 2: Correlation coefficients between the live body variables.
+++ P <0.001 ++ P <0.01 + P <0.05. Live weight (LW); chest depth (CD); chest girth (CG); chest width (CW); pelvis width (PW); withers height (WH); and pelvis height (PH).
Table 2 shows the correlation coefficients between the eight variables studied. Correlation between live weight (LW) and chest girth (CG) was not mentioned, because live weight (LW) was calculated using the formula established by Brody et al. (1937). Several significant correlations between variables were found (p<0.001). For example, there is a high positive correlation (p<0.001) between live weight (LW) at slaughter with chest depth (CD) (r= 0.68), withers height (WH) (r= 0.58) or pelvis width (PW) (r= 0.66). These results were similar to those reported by Gresham et al. (1986) and Thompson et al. (1983). Their results showed that the chest girth (CG) had a high positive correlation with the chest width (CW) (r= 0.66). The withers height (WH) showed a high positive correlation (p<0.001) with the pelvis height (PH) (r= 0.90). In accordance with the present study, Shah et al. (2018) reported a high positive correlation between chest girth, withers and rump height in cattle.
On the other hand, the age of the cull cows showed a negative correlation with all measured parameters (p<0.05). Miller et al. (1969) reported that mature Holstein cows, having more than four parities recorded a slight gain in weight during lactation which could be explained by the mobilization of fat reserves to satisfy the demands of lactation. In addition, Ragsdale (1934) concluded that mature frame size is reached at around five years of age. However, live weight increases continue until the age of seven years. This trend could explain the negative correlation found in the present study between age and all measurements recorded on live cull cows. Significant negative correlations (p<0.001) were mainly found between age and the weight at slaughter (r = -0.51). Thompson et al. (1983) also reported a high positive correlation between the weight of the animal and the withers height (WH). Tebug et al. (2018) predicted live weight of dairy cattle using heart girth and height at withers measurements. These authors reported a high positive correlation between live weight and heart girth (r=0.92). However, the correlation between live weight and withers height was moderate (r=0.78). The correlations found in the present study are lower than those reported by these authors and would reflect the breed diversity in that study compared to the animals used in the present research.
The findings of Brown et al. (1956) are consistent with correlations between the body weight and withers height WH) (r= 0.59 vs. r= 0.58) and the chest depth (CD). However, Wanderstock and Salisbury (1946) reported a higher correlation between slaughter weight and withers height. Kohli et al. (1951) reported a negative correlation between the shoulder width and withers height which was not found in the present investigation.
The two principal components (PC) are summarized in Figure 1. The first component explained 57.6% of the variability, while the second component explained 13.7%. Together they explained 71.3% of the total variability.
Results showed high correlations between the first component, weight at slaughter (r= 0.93), chest girth (CG) (r= 0.93) and pelvis width (PW) (r= 0.94). The second component had high negative correlations with the withers height (WH) (r= -0.57) and the pelvis height (PH) (r= -0.59). Alberti et al. (2008) performed a principal component analysis using data from 15 European beef breeds reported that the first component explained about 48% of the variance, however, the second component explained 24% of the total variability. Putra et al. (2020) used body measurements and principal component analysis to describe conformation in cattle. These authors reported that two components were extracted and explained 73.36% of the total variance. In addition, each component explained 47.89% (PC1) and 25.47% (PC2), respectively. These results are quite similar to those found in the present study.
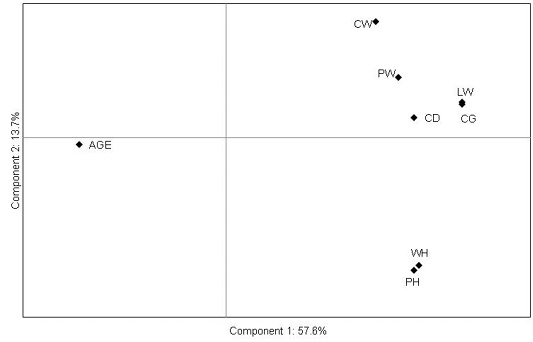
Figure 1: Projection of the morphometric measurements in the plane defined by the first two principal components. Live weight (LW); chest depth (CD); chest girth (CG); chest width (CW); pelvis width (PW); withers height (WH); and pelvis height (PH).
The coordinates of the eight initial variables in the plane formed by the axes representing the two principal components show their correlations with components 1 and 2. Component 1 showed high positive correlations with the live weight (LW), the chest width (CW), the pelvis width (PW), and the chest girth (CG), but a negative correlation with the withers height (WH) of the live animal. In fact, these variables are located far from the origin of the first component (PC1). The shape characteristics are grouped together, placed to the right of the loading plot and positively correlated. The second component (PC2) is characterized by two frame size measurements (withers and pelvis heights). In fact, the second component showed high negative correlations with withers(WH), and pelvis heights (PH), but a positive correlation with the depth of the chest (CD). In addition, these measurements are negatively correlated with the age as this parameter was located opposite to them. Hence, the principal component analysis reflected two different groups of variables. The first principal component was correlated with variables related to width and depth, indicating the animal conformation. In contrast, the second principal component was correlated to heights showing that frame size can be considered as an indicator of the axis of the animal bone structure.
Cluster analysis based on the two previously revealed components identified three classes of live cull cows (Figure 2) that could be described as follows:
• Cluster 1: Cull cows having a live weight between 300 and 500kg, pelvis height between 130 and 145 cm, and chest girth between 165 and 185 cm. • Cluster 2: Cull cows having a live weight between 500 and 700kg, pelvis height between 145 and 155 cm, and chest girth between 185 and 205 cm. • Cluster 3: Cull cows having a live weight between 500 and 700kg, pelvis height between 130 and 145 cm, and chest girth between 185 and 205 cm.
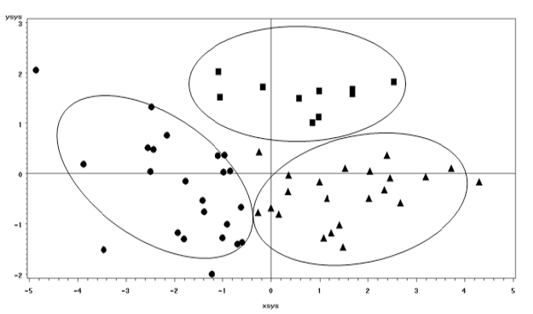
Figure 2:Projection of the morphometric measurements of the three animal groups identified by the cluster analysis based on the two principal components. : Cluster 1, : Cluster 2, : Cluster 3.
Table 3: Means of different measurements among the three classes of cull cows.

