
The accumulation of adipose tissue is largely influenced by the genetic background of cattle. Therefore, we analyzed the transcriptome changes within adipose tissue in beef cattle at different stages of growth. Microarray analysis of data at 12 vs 18 months, 12 vs 24 months, 12 vs 30 months, 18 vs 24 months, 18 vs 30 months and 24 vs 30 months uncovered a total of 10625 differentially expressed genes (P ≤ 0.05; no fold change). The dynamic impact approach (DIA) bioinformatics tool was used to uncover the most-affected biological pathways among the DEG. Ingenuity pathway analysis (IPA) software also was used to analyze upstream transcription regulators and gene networks. Bioinformatics analysis results indicated that 18 months being a key age for alterations in metabolism. The results of IPA analysis revealed that several transcription regulators related to disease, cell growth, proliferation and lipid metabolism, including PPAR, are important during development of the adipose tissue. These data indicate that future research should emphasize the study of key genes related to synthesis, metabolism, and growth of adipose tissue during development. This will allow to determine the functional relevance of the genes and pathways uncovered.
Research Article · Volume 50, Issue 5, 12 August 2018 · Open Access
Bioinformatics Analyses of Bovine Adipose Tissue Transcriptome from Lilu Beef Cattle at Different Stages of Growth
· · · · ·
Affiliations & Notes ⌄
- 1Institute of Animal Science and Veterinary Medicine, Shandong Academy of Agricultural Sciences, Jinan 250100, China 2Shandong Key Lab of Animal Disease Control and Breeding, Jinan 250100, China 3Department of Animal Science, University of Illinois Urbana-Champaign, IL, USA 4College of Life Sciences, Shandong Normal University, Ji’nan, China , Guifen Liu and Xiaomu Liu contributed equally to this work. , * Corresponding authors: wanfc@sina.com
- 2jloor@illinois.edu
Article Info ⌄
- Journal:
- Pakistan Journal of Zoology
- Published:
- 12 August 2018

From the article
- To validate the microarray hybridization results, 8 genes were selected from the differentially expression gene list for quantitative qRT-PCR assays.
- The adipose tissues used in qRT-PCR assays were total RNA of all 4 age stages from 12 animals.
- However, the expression abundance was higher in the microarray analyses than in qRT-PCR of FASN, LEAP2, LPL genes.
- Altogether, validation of microarray data by qRT-PCR revealed a high correspondence between both analyses (Table III).
Selected from the article's own text.
Abstract
Introduction
Fat is an unpopular part of meat for consumers and is considered to be unhealthy to their bodies in many countries. However, the quantity and distribution of fat in the adipose tissue are important contributors to meat quality, such as taste and nutritional quality of the meat ; ; . The beef carcass can be categorized into quality grades based on subcutaneous fat thickness, so breeding for optical carcass fat is one of the major goals toward better profitability in beef industry . The growth and development of adipose is a valuable trait that affects marbling and an important factor determining the price of beef in the Chinese beef market.
Fat accumulation is affected by age, genetics, and nutrition. Metabolic processes affecting fat accumulation occur in adipose tissue, there are some certain relationships exist between adipose tissue metabolism and fat accumulation . Gene expression in fat depots provides further proof that the mechanisms for fat accumulation differ significantly among animal species . In fact, it is a complicated biochemical process that involves many genes, developmental stages, and pathways. Some studies have reported regional differences in the expression of individual genes among different adipose depots ; . Adipocyte biology plays pivotal roles in the regulation of fat metabolism . Uncovering novel genes may provide deeper appreciation of the genetic basis for the growth and development of adipose.
Lilu cattle are the result of crossing fixed combined with directional excellent-choosing that includes the pedigree of 62.5% Limousin and 37.5% Chinese Luxi cattle. Lilu cattle have bigger and well-balanced body type. Adult bull and cow weight is above 800kg and 500kg, respectively. Hybrid off-springs have good production performance and adaptability. Currently, this breed will be under-review as a new beef cattle variety in China.
Microarray technology has been widely used to discover new genes and functions, to understand biochemical pathways ; . We used a novel bioinformatics approach, the dynamic impact approach (DIA) to analyze microarray data at four different age stage in Lilu cattle. In addition, we used ingenuity pathway analysis (IPA) to study downstream regulators of transcriptomics differences. The primary purpose of this study was to uncover the gene expression and signaling or metabolic pathways of subcutaneous adipose tissues during development of Lilu beef cattle. As a result, the expression pattern of the adipose transcriptome of Lilu beef cattle could be discerned.
Materials and methods
Animal housing and tissue sampling
A total of 12 Li-Lu beef cattle, four groups (12, 18, 24, and 30 months of age, n=3) were used in this experiment. The whole procedure for experimental animals was performed in strict accordance with guideline (IACC20060101, Jan, 2006) of the Institutional Animal Care and Use Committee of Institute of Animal Science and Veterinary Medicine, Shandong Academy of Agricultural Sciences, and all efforts were made to minimize suffering. The subcutaneous adipose tissues near the last thirteenth or fourteenth rib were collected from animal carcasses after slaughter, immediately frozen in liquid nitrogen, and kept at -80°C until analyzed.
RNA extraction and cRNA synthesis
Total RNA extraction was performed by homogenizing the fat tissue samples with Trizol reagent (Invitrogen, Carlsbad, CA, USA) and purified using the RNAeasy mini kit (QIAGEN; Cat# 74106). RNA quality and purity were determined by NanoDrop ND-1000 spectrophotometer at 260/280 nm (NanoDrop Technologies, USA). The integrity of total RNA was assessed by an Agilent 2100 Bioanalyzer profile (Agilent Technologies Inc., USA); only samples with RNA Integrity Numbers (RIN) values more than 7 were used for microarray and qRT-PCR analysis.
Purified total RNA was transcribed into cDNA using the Low RNA Input Linear Amplication kit (Agilent Technologies Inc., USA). Then cDNA was transcribed into cRNA which was labeled with Cyanine-3 (Cy3) NHS ester (GE healthcare, USA) using T7 RNA polymerase (Agilent Technologies Inc., USA).
Microarrays hybridization and data analysis
The Cy3 labeled RNA samples were hybridized with Agilent GF Bovine 4×4 gene expression microarray slides (Covering the entire bovine genome, including 43803 probes) at 65°C for 17 h. The hybridized microarray slides were washed with a Gene Expression Washing Buffer Kit (Agilent Technologies Inc.; Cat # 5188-5327) and were scanned with an Agilent DNA Microarray Scanner (#G2565BA, Agilent Technologies) at a resolution of 5μm.
Microarrays were adjusted for dye and array effect (Quantile normalization and array centering), duplicated spot intensities were not averaged and were subsequently used for statistic alanalysis. A mixed model with repeated measures was then fitted to the normalized log2-transformed adjusted ratios (sample/reference standard) using MIXED Procedure of SAS (version 9.1.3; SAS Institute, Cary, NC, USA). The model included the fixed effects of time (12, 18, 24, 30). Beef cattle were considered as a random effect. Differences in relative gene expression were considered significant at P<0.05 and fold change greater than 6. Statistical significance was accepted at the P<0.05 level.
Validation by qRT-PCR and correlation analysis
Candidate genes were selected based on microarray data for qRT-PCR validation. qRT-PCR primers were designed and synthesized (Biosune, Shanghai) to assay 8 differentially expressed genes (Table I). qRT-PCR were performed using the ABI Prism 7700 Sequence Detector
Table I.- Primer sequences of genes selected for analysis by qRT-PCR.
| Gene | Accession number | Forward primer | Reverse primer | Temp. (°C) |
| FOX1 | XM_ 002691748.1 | AATCACAGAGAA CCAAGCTCTCCGT | TGCGGTGCCATGA ACAGATGCA | 60 |
| FASN | NM_ 001012669.1 | AGGCGCCCATAG GACCAGCACC | GACCAGGCAGGT CTCCGAGTCG | 53 |
| HMGCR | NM_ 001105613.1 | AGGAAAGTCTGT GGTCTGTGAAG | CAGGCAATGTAG ATGGCAGTTAC | 63 |
| LEAP2 | NM_174559 | TGGCACCTCAAA CTCTTTGCAGT | TTGGAGAGCCAT CTACCTGGGCT | 57 |
| LPL | NM_001075120 | TTGGGTTCAGCG GGTCTACTGTTCT | AATCCTGTCTGC GGCGACCA | 58 |
| MHC | D50046.1 | CTTCCCTGATACT CTGCCCCTCC | CCCCAGTGATCT CATGGTAGGCA | 62 |
| MYH | NM_174727 | GCGCAATGCGG AGTCGGTCA | TCCGGGACTGGGA GCTTCAGTTG | 60 |
| SIRT1 | NM_ 001192980.1 | AGTGGCGGCTG AGAGGGAGG | GTACCCAATAGCG GCCGCCG | 57 |
Gene abbreviations: FOX1, forkhead box O1; FASN, fatty acid synthase; HMGCR, 3-hydroxy-3-methylglutaryl-CoA reductase; LEAP2, liver-expressed antimicrobial peptide-2; LRL, lipoproteinlipase; MHC, major histocompatibility complex; MYH, MutY human homologue; SIRT1, sirtuin 1.
(Applied Biosystems, Foster City, CA, USA) in a final volume of 20 μL containing SYBR Green I (Invitrogen). The cycling parameters of qRT-PCR amplification were as follows: 94°C for 2 min, 35 cycles of 94°C for 30 s, appropriate annealing temperature for 30 s, 72°C for 30 s.
The qRT-PCR data were genometric mean of the internal control genes and log2 transformed before statistical analysis. All means were compared using the PDIFF statement of SAS, and difference were considered statistically significant at P<0.05.
Statistical analysis
Quantile normalization: The goal of the quantile method is to make the distribution of probe intensities for each array in a set of arrays the same. The method is motivated by the idea that a quantile-quantile plot shows that the distribution of two data vectors is the same if the plot is a straight diagonal line and not the same if it is other than a diagonal line.
Microarrays were adjusted for dye and array effect (Quantile normalization and array centering), duplicated spot intensities were not averaged and were subsequently used for statistical analysis. A mixed model with repeated measures was then fitted to the normalized log2-transformed adjusted ratios (sample/reference standard) using MIXED Procedure of SAS (version 9.1.3; SAS Institute, Cary, NC, USA). The model included the fixed effects of time (12, 18, 24, 30). Beef cattle were considered as a random effect. Differences in relative gene expression were considered significant at P≤0.05 and no fold change for 6 comparisons. Statistical significance was accepted when P<0.05.
The qPCR data were genometric mean of the internal control genes and log2 transformed before statistical analysis. All means were compared using the PDIFF statement of SAS, and difference were considered statistically significant at P≤0.05.
Functional analysis of pathways by DIA
The dynamic impact approach (DIA) was a method to study the biological impact of experimental conditions through the transcriptome level and it can interpret the biology of the impact by providing the direction of the impact . In this study, the DIA were used to uncover impact and direction (flux) of the biology pathway in four different age stages of Lilu cattle. Briefly, the data of gene chip was categorized as follows: Entrez gene ID, FDR, fold-change (FC), and P-value, and then the data was uploaded to DIA and calculated. The results are showed in figures and tables.
Transcription regulators and gene network analysis
Ingenuity pathway analysis (IPA) software was used to analyze the upstream transcription regulators and their connections with other downstream genes that were differentially expressed. A list of DEG (P-values≤0.05) was uploaded to the IPA using core analysis. The results of upstream transcription regulators were downloaded and saved for further analysis.
Results
Differential expression genes of adipose in different ages
All differently expressed genes of different ages were listed in Table II, the number of differently expressed genes were 188, 707, 1016, 907, 1026 and 165 between 12 vs 18, 12 vs 24, 12 vs 30, 18 vs 24, 18 vs 30 and 24 vs 30, respectively. The differential expression genes mainly focus on 12 vs 24, 12 vs 30, 18 vs 24, and 18 vs 30 and the numbers of genes are more than the other two groups. The down-regulated genes of these groups are more than up-regulated genes. There are no big differences between 12 vs 18 and 24 vs 30.
Table II.- Differential expression genes number of adipose tissue in four different ages.
| Age comparisons (months) | Gene No. | Up-regulated genes No. | Down-regulated genes No. |
| 12 vs 18 | 928 | 562 | 366 |
| 12 vs 24 | 1754 | 814 | 940 |
| 12 vs 30 | 2201 | 1080 | 1121 |
| 18 vs 24 | 2429 | 1079 | 1350 |
| 18 vs 30 | 2648 | 1135 | 1513 |
| 24 vs 30 | 665 | 340 | 325 |
The differential expressed genes were selected according to P-value ≤ 0.05. No fold change in this study.
Validation of microarray results using qRT-PCR
To validate the microarray hybridization results, 8 genes were selected from the differentially expression gene list for quantitative qRT-PCR assays. Because they are either important components of the lipid metabolic process and are related to meat quality of cattle (FOX1, FASN, HMGCR, LPL, and SIRT1) or because they are important and believable genes in the process of chip analyzing (LEAP2, MHC, MYH). The adipose tissues used in qRT-PCR assays were total RNA of all 4 age stages from 12 animals. For all 8 genes, the expression trends are similar both in microarray analyses and qRT-PCR experiment. However, the expression abundance was higher in the microarray analyses than in qRT-PCR of FASN, LEAP2, LPL genes. Altogether, validation of microarray data by qRT-PCR revealed a high correspondence between both analyses (Table III).
Summary of KEGG pathway analysis
A functional analysis of DEG (P<0.05) was made with DIA. The DIA provide a summary of the KEGG pathways in the form of categories and sub-categories (Fig. 1), in accordance with the number of DEG (Table II) all the differentially expressed genes were more focus on 12 vs 30, 18 vs 24 and 18 vs 30. The summary of the KEGG pathways showed that KEGG pathway categories were more impacted 18 vs 24 and 18 vs 30 in parallel with the other time comparisons. The categories “metabolism” was the most impacted in the adipose tissue between 18 vs 24 and 18 vs 30, and the 18 month is very important age for beef cattle. The categories “metabolism” was the most impacted in the adipose tissue between 18 vs 24 and 18 vs 30, and the 18 month is very important age for beef cattle. The subcategories of pathway “energy metabolism” were activated from 12 month to 24 month, and then this pathway was inhibited on 30 month. From Figure 1, the most metabolic pathways were inhibited after 18 month of beef cattle.
Table III.- Comparison of the microarray and qPCR results.
| Gene | Microarray results (P value) | RT-PCR results (P value) | Regulation |
| FOX1 | # | # | - |
| FASN | ** | * | + |
| HMGCR | # | # | - |
| LEAP2 | ** | * | + |
| LPL | ** | * | + |
| MHC | * | ** | + |
| MYH | * | * | + |
| SIRT1 | ** | ** | - |
*, means P<0.05; **, means P<0.01; #, means P>0.05; +, means up-regulation; - means down-regulation.
In metabolic pathway, sulfur metabolism; thiamine metabolism; glycosaminoglycan degradation; alpha-linolenic acid metabolism; linoleic acid metabolism; glycine, serine and threonine metabolism are the top 6 most affected metabolism pathways in the adipose tissue between 18 vs 24 (Fig. 2). The thiamine metabolism; glycine, serine and threonine metabolism; sulfur metabolism; cysteine and methionine metabolism; histidine metabolism and ascorbate and aldarate metabolism are top 6 most affected metabolism pathways in the adipose tissue between 18 vs 30 (Fig. 3).
In nonmetabolic pathway, fat digestion and absorption; vasopressin-regulated water reabsorption; renin-angiotensin system; leukocyte transendothelial migration; PPAR signaling pathway; dorso-ventral axis formation are the top 6 most affected non metabolism pathways in the adipose tissue between 18 vs 24 (Fig. 4). The thiamine metabolism; glycine, serine and threonine metabolism; sulfur metabolism; non-homologous end-joining; cysteine and methionine metabolism are the top 6 most affected non metabolism pathways in the adipose tissue between 18 vs 30 (Fig. 5).
Gene network analysis by IPA
We used IPA to find the relationships between transcription factors and all the DEGs between 18 vs 24 and 18 vs 30. Eighty-eight transcription regulators were found in the adipose tissue between 18 vs 24, KLF5, one of activated transcription regulators, which is relevant to cancer, cellular development, cellular growth and proliferation, and this regulator is unregulated FAM110A, MYC, DUSP1, ACTA2, NOTCH1 and PREB, down regulated RUNX1 (Fig. 6). Another eighty-eight transcription regulators were tested in the adipose tissue by IPA between 18 vs 30, PPARGC1A, one of inhibited transcription, which is related to lipid metabolism, down regulated 20 target molecules and up regulated 6 target molecules (Fig. 7).
Discussion
Lilu cattle
LuXi yellow cattle is a good local beef cattle in Shandong province, which is famous for its excellent meat quality, however, its growth rate is slow. Therefore, we have used introduced breed to improve the local breed. Lilu beef cattle is breeded through the method of crossing fixed and combined with directional excellent-choosing individual which include 62.5% adventitious Limousin blood and 37.5% local Luxi Yellow cattle blood. We have analyzed the growth performance, carcass characteristics, and meat quality in four age stages. Most of growth traits are superior to Luxi yellow cattle in the same stage and there are not many dominant variations between them in meat quality. These results have been reported previously , 2012).
Fat development and differentiation
In beef cattle, postnatal adipose tissue development was thought to occur as follows: internal, intermuscular, subcutaneous, and, last intramuscular. The accumulation of fat is associated with the genetic background, development, and nutrition of an animal. The adipose are very important because they can store fats as energy sources , and fat related carcass traits are important to the beef industry with value of the meat . However, the growth and differentiation of adipose tissue were controlled by many factors, including heredity, nutrition and others. A number of quantitative trait loci (QTL) studies have shown candidate genes and their location on chromosomes that may be associated with backfat thickness in cattle ; . Some results indicated that adipocyte differentiation were controlled by a number of adipogenic transcription factors ; , and adipocyte differentiation were also regulated by differentiation-inducing agents ; .
Differently expression gene pattern
From overall differently expression gene pattern of this study, we found that the differently expressed genes were focusing on 18 vs 24, 18 vs 30 and 24 vs 30. However, there are fewer genes existed between 12 vs 18, 24 vs 30. As the reported, during the development of beef cattle, the growth rates of different parts and tissues of the body are not the same. Head, limbs and skeleton are the fastest at the early age, body length and muscle mainly grow after the early age, while after maturity; the growth of body weight and fat is the main thing . Form these differently expression genes numbers, we can concluded that 18 month age is very important development stage in beef cattle.
Fat deposition and metabolism, is affected by several lipid metabolism pathway. In metabolic pathways, the most of pathways are inhibited, especially between 18 vs 24 and 18 vs 30. The lipid metabolism, metabolism of other amino acids and metabolism of cofactors and vitamins were most inhibited between 18 vs 24, also in 18 vs 30. In beef cattle, people always to improve lipid level by castration method. In fact, the steers have higher lipid than bulls, because liver fat deposition is affected by several lipid metabolism pathways, steers had lower hepatic mRNA levels of LPL and FATP5 than bulls. Steers also had higher adipogenic SREBPs mRNA levels . The differently expressed genes were analyzed by Gene chip. Gene chip has been widely used in bioscience research as a technical tool. Gene chip has been used in many species, cattle ; , pig , sheep, and others . Agilent GeneChip oligonucleotide arrays are a popular platform for the high-throughput analysis of gene expression or discovering new genes . The differently expressed genes have three main trends in four age stages of Lilu beef cattle and these genes are critical in PPAR signaling pathway. In our group, we have researched that three-hydroxy-3-methylglutaryl-CoA reductase (HMGCR) catalyzes the conversion of HMG-CoA to mevalonate and is considered the rate-limiting enzyme in the overall pathway of cholesterol biosynthesis and have an important role in PPAR signaling pathway. These genes involved signaling pathway which would contribute to our further research in Lilu beef cattle.
The induction of adipocyte differentiation and the resulting appearance of new small adipocytes after induction of PPAR have been reported by Yamauchi and Kadowaki (2001) in murine models of insulin resistance. PPAR, a key regulator in adipogenesis and fat storage, controlling the expression of many adipocyte-specific genes . However, the development of adipocyte size in cattle from 10 to 26 months of age does not correspond with a continuous increase in s.c. fat, which is consistent with steady-state levels of PPAR gene expression . Up regulation of PPARγwas observed in the backfat tissue of Lilu cattle with the increasing age . In present research, PPAR signal pathway is be active between 12 vs 30, and the most impact exists between 18 vs 30. As for beef cattle, after maturity, the fat will deposit very quickly in different body part.
Acknowledgements
We acknowledge the National Natural Science Foundation of China under Grant No. 31402098), Young Talents Training Program of Shandong Academy of Agricultural Science, MATS-Beef Cattle System, the Sustentative Research Project of China Ministry of Science and Technology under Grant No. 2015BAD03B04), Breeding New Varieties Projects of Transgenic Organisms under Grant No. 2016ZX08007-002), Agricultural Science and Technology Innovation Project of Shandong Academy of Agricultural Sciences under Grant No. CXGC2016A04).
Statement of conflict of interest
Authors have declared that there is no conflict of interests regarding the publication of this article.
Figures
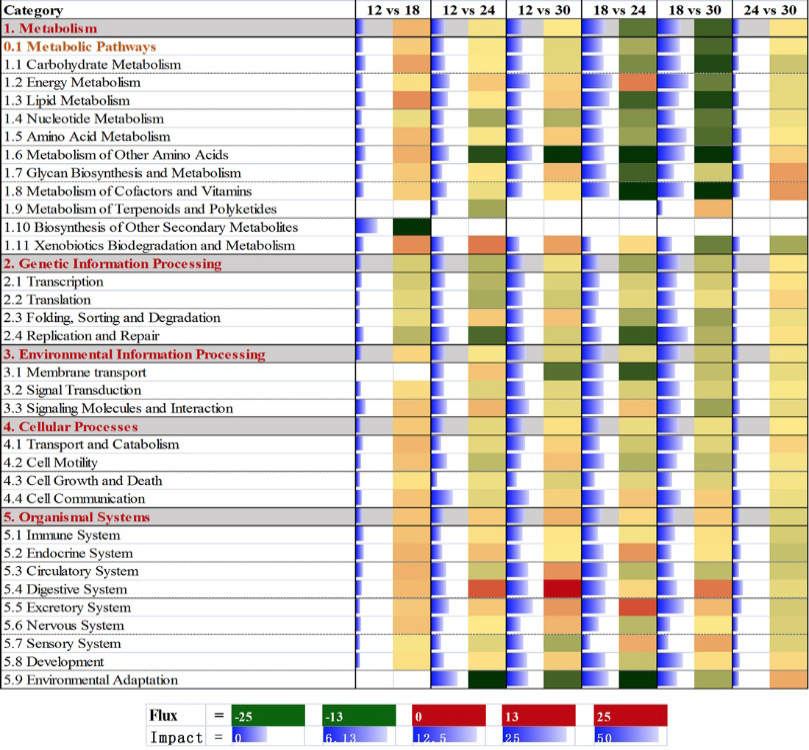
Results of flux and impact uncovered by the dynamic impact approach (DIA) based on Kyoto Encyclopedia of Genes and Genomes (KEGG) Pathways database analysis of the bovine muscle transcriptome for each time comparison. Notes: Blue lines show the impact of each category and the corresponding subcategories (P value<0.05 and no fold change). The impact is represented by the horizontal blue bars (large the bar larger the impact). Flux represents the direction of each category and the corresponding subcategory (green color, inhibition; yellow, stable; red color, activation, with different color intensities according to the level of up-regulation or down-regulation).
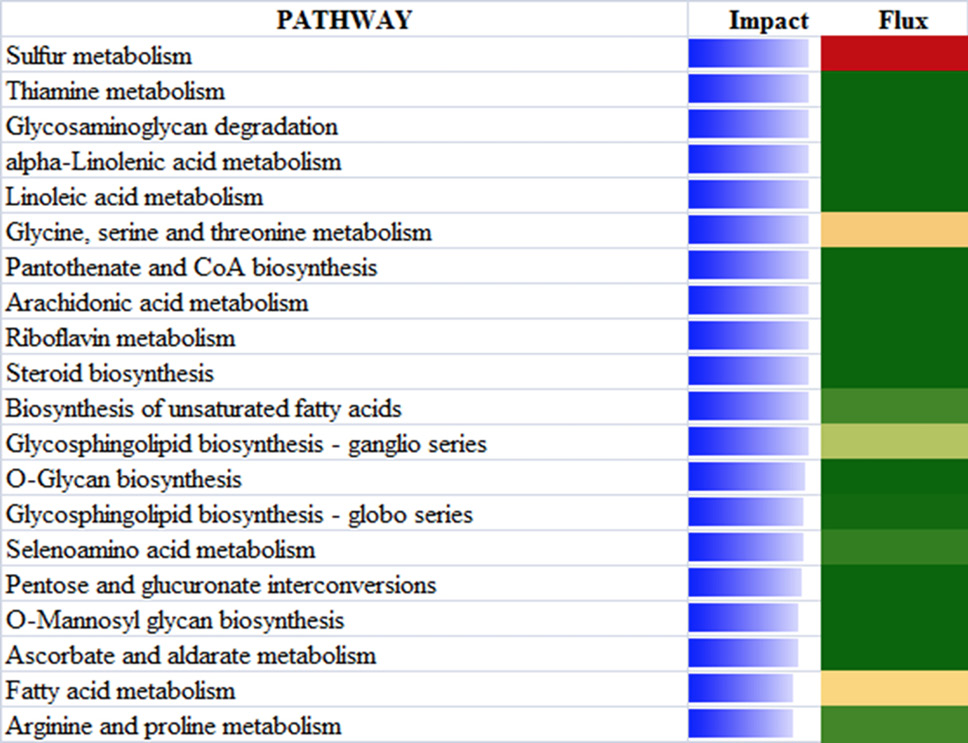
The top 20 most affected metabolic Kyoto Encyclopedia of Genes and Genomes pathways ranked by overall effect value in adipose tissues of beef cattle on comparison of 18 vs 24. The transparent bars represent the effect values (0 to 50), flux represents the direction of each category and the corresponding subcategory (green color, inhibition; yellow color, stable; red color, activation, with different color intensities according to the level of upregulation or downregulation).
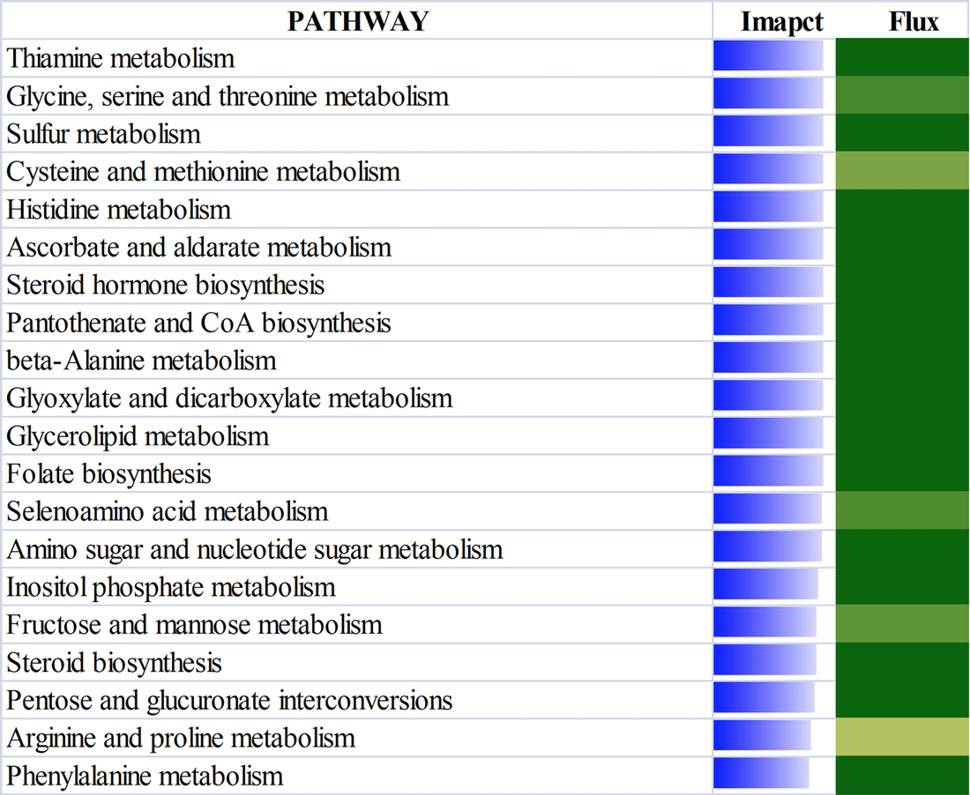
The top 20 most affected metabolic Kyoto Encyclopedia of Genes and Genomes pathways ranked by overall effect value in adipose tissues of beef cattle on comparison of 18 vs 30. The transparent bars represent the effect values (0 to 50), flux represents the direction of each category and the corresponding subcategory (green color, inhibition; yellow color, stable; red color, activation, with different color intensities according to the level of upregulation or downregulation).
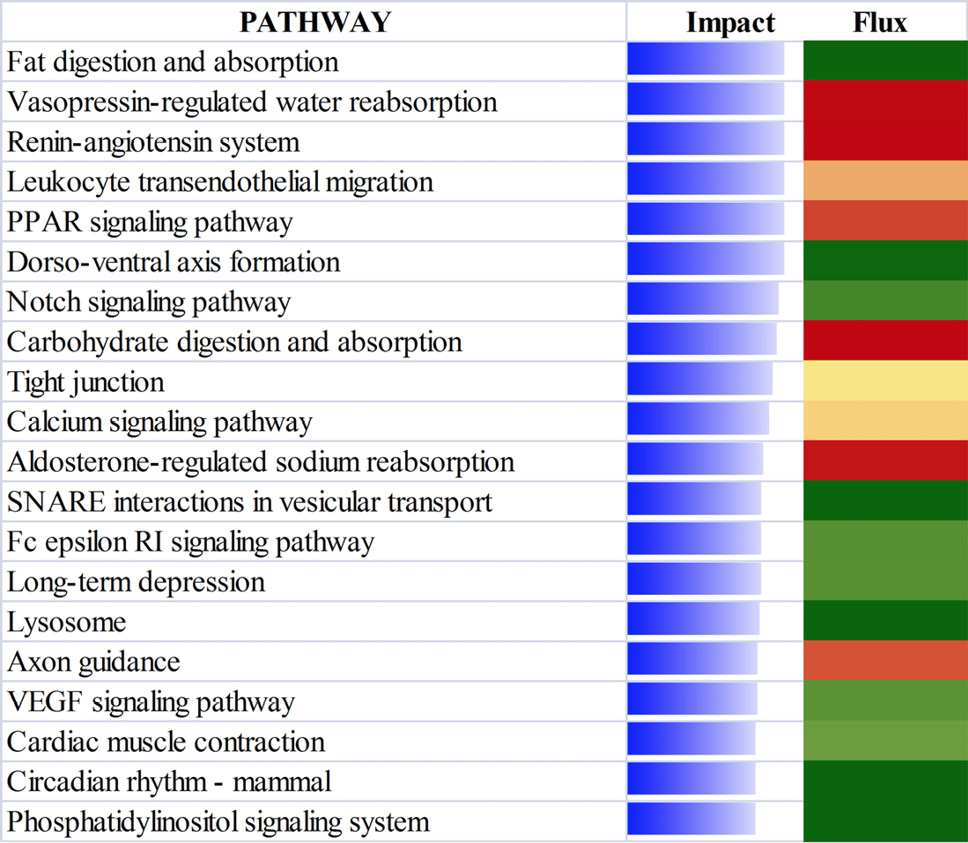
The top 20 most affected non metabolic Kyoto Encyclopedia of Genes and Genomes pathways ranked by overall effect value in adipose tissues of beef cattle on comparison of 18 vs 24. The transparent bars represent the effect values (0 to 50), flux represents the direction of each category and the corresponding subcategory (green color, inhibition; yellow color, stable; red color, activation, with different color intensities according to the level of upregulation or downregulation).
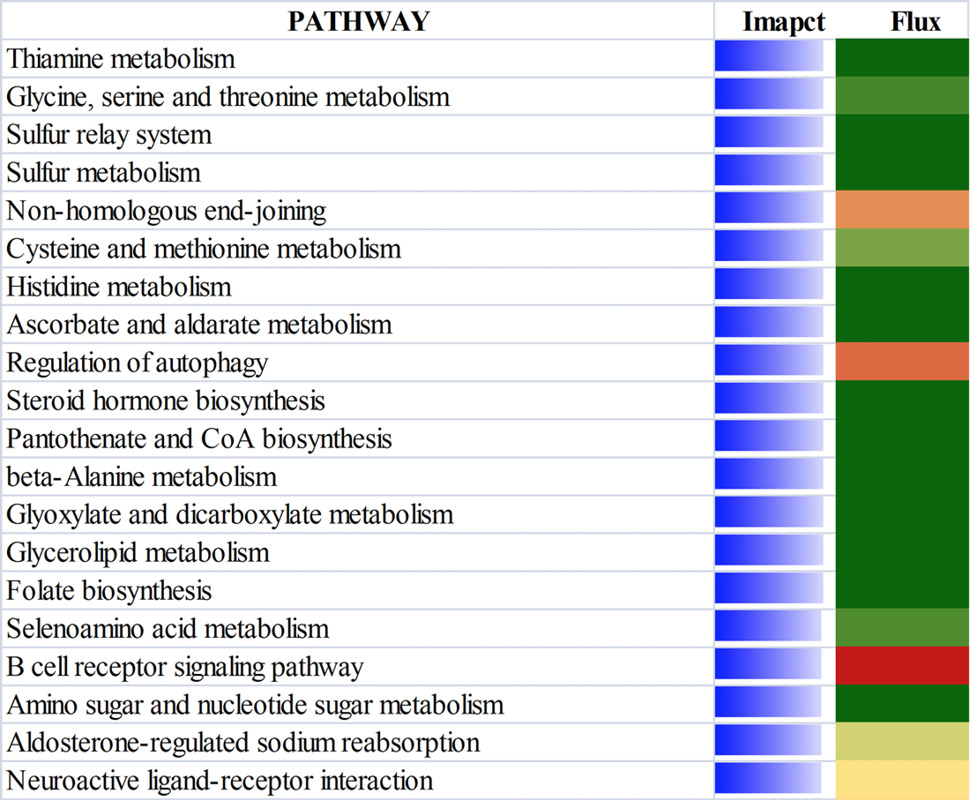
The top 20 most affected non metabolic Kyoto Encyclopedia of Genes and Genomes pathways ranked by overall effect value in adipose tissues of beef cattle on comparison of 18 vs 30. The transparent bars represent the effect values (0 to 50), flux represents the direction of each category and the corresponding subcategory (green color, inhibition; yellow color, stable; red color, activation, with different color intensities according to the level of upregulation or downregulation).
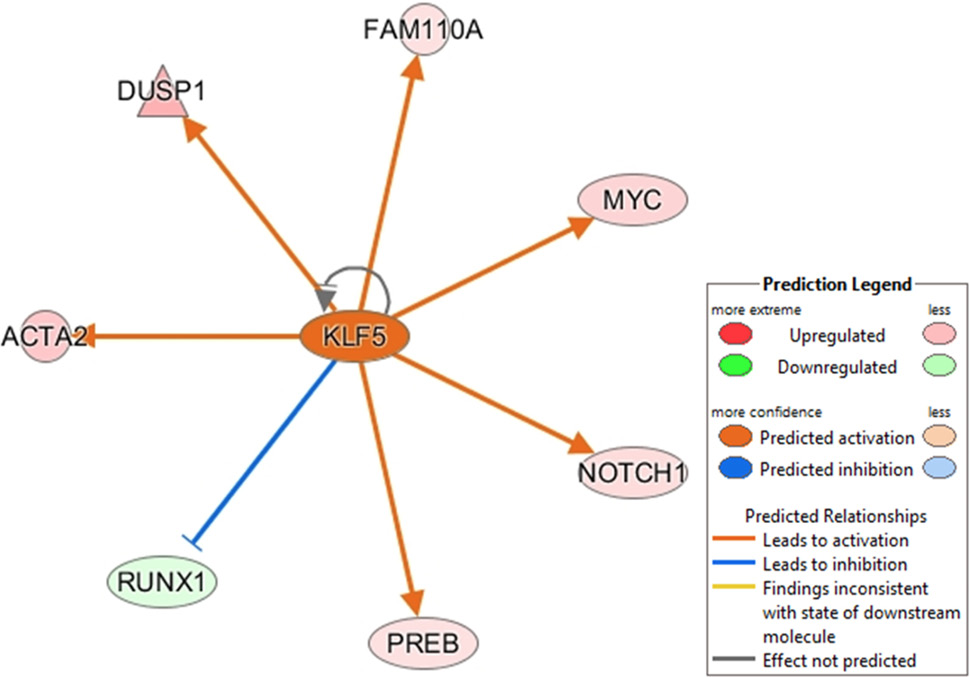
Ingenuity Pathway upstream network analysis of differentially expressed genes (DGE) between 18 vs 24 of beef cattle.
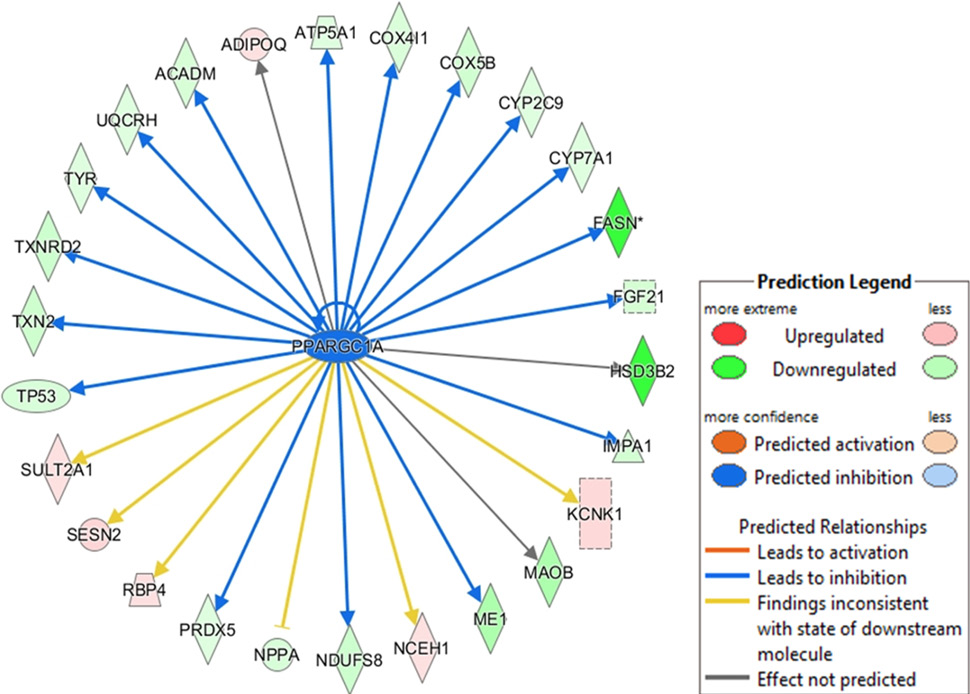
Ingenuity pathway upstream network analysis of differentially expressed genes (DGE) between 18 vs 30 of beef cattle.
References
- Albrecht, E., Gotoh, T., Ebara, F., Xu, J.X., Viergutz, T., Nurnberg, G., Maak, S. and Wegner, J., 2011. Cellular conditions for intramuscular fat deposition in Japanese Black and Holstein steers. Meat Sci., 89: 13-20. https://doi.org/10.1016/j.meatsci.2011.03.012[CrossRef]
- Baik, M., Nguyen, T.H., Jeong, J.Y., Piao, M.Y. and Kang, H.J., 2015. Effects of castration on expression of lipid metabolism genes in the liver of korean cattle. Asian-Australasian J. Anim. Sci., 28: 127-134.
- Bionaz, M., Periasamy, K., Rodriguez-Zas, S.L., Hurley, W.L. and Loor, J.J., 2012. A novel dynamic impact approach (DIA) for functional analysis of time-course omics studies: Validation using the bovine mammary transcriptome. PLoS One, 7: e32455. https://doi.org/10.1371/journal.pone.0032455[CrossRef]
- Bong, J.J., Cho, K.K. and Baik, M., 2010. Comparison of gene expression profiling between bovine subcutaneous and intramuscular adipose tissues by serial analysis of gene expression. Cell Biol. Int., 34: 125-133.
- Bourzac, K.M., Rounseville, M.P., Zarate, X., Maddula, V.S., Henderson, D.C., Luckey, J.A., Seligmann, B. and Galbraith, D.W., 2011. A high-density quantitative nuclease protection microarray platform for high throughput analysis of gene expression. J. Biotechnol., 154: 68-75. https://doi.org/10.1016/j.jbiotec.2011.03.020[CrossRef]
- Girard, J., Perdereau, D., Foufelle, F., Prip-Buus, C. and Ferre, P., 1994. Regulation of lipogenic enzyme gene expression by nutrients and hormones. FASEB J., 8: 36-42. https://doi.org/10.1096/fasebj.8.1.7905448[CrossRef]
- Hishikawa, D., Hong, Y.H., Roh, S.G., Miyahara, H., Nishimura, Y., Tomimatsu, A., Tsuzuki, H., Gotoh, C., Kuno, M., Choi, K.C., Lee, H.G., Cho, K.K., Hidari, H. and Sasaki, S., 2005. Identification of genes expressed differentially in subcutaneous and visceral fat of cattle, pig, and mouse. Physiol. Genom., 21:343-350. https://doi.org/10.1152/physiolgenomics.00184.2004[CrossRef]
- Istvan, E.S. and Deisenhofer, J., 2000. The structure of the catalytic portion of human HMG-CoA reductase. Biochim. Biophys. Acta, 1529: 9-18. https://doi.org/10.1016/S1388-1981(00)00134-7[CrossRef]
- Jiang, Z., Michal, J.J., Chen, J., Daniels, T.F., Kunej, T., Garcia, M.D., Gaskins, C.T., Busboom, J.R., Alexander, L.J., Wright, Jr. R.W. and Macneil, M.D., 2009. Discovery of novel genetic networks associated with 19 economically important traits in beef cattle. Int. J. biol. Sci., 5: 528-542. https://doi.org/10.7150/ijbs.5.528[CrossRef]
- Kim, H., Chi, Y., Chung, K., Kim, K., Choi, Y. and Baik, M., 2000. Differential response of obese gene expression from fasting in bovine adipose tissues. Biosci. Biotechnol. Biochem., 64: 2240-2242. https://doi.org/10.1271/bbb.64.2240[CrossRef]
- Lee, S.H., Gondro, C., van der Werf, J., Kim, N.K., Lim, D.J., Park, E.W., Oh, S.J., Gibson, J.P. and Thompson, J.M., 2010. Use of a bovine genome array to identify new biological pathways for beef marbling in Hanwoo (Korean cattle). BMC Genom., 11: 623. https://doi.org/10.1186/1471-2164-11-623[CrossRef]
- Liu, X., Liu, G., Tan, X., Zhao, H., Cheng, H., Wan, F., Wu, N. and Song, E., 2014. Gene expression profiling of SIRT1, FoxO1, and PPARgamma in backfat tissues and subcutaneous adipocytes of Lilu bulls. Meat Sci., 96:704-711. https://doi.org/10.1016/j.meatsci.2013.09.019[CrossRef]
- Lozeman, F.J., Middleton, C.K., Deng, J., Kazala, E.C., Verhaege, C., Mir, P.S., Laroche, A., Bailey, D.R. and Weselake, R.J., 2001. Characterization of microsomal diacylglycerol acyltransferase activity from bovine adipose and muscle tissue. Comp. Biochem. Physiol. Part B: Biochem. mol. Biol., 130: 105-115.
- Marzolla, V., Armani, A., Zennaro, M.C., Cinti, F., Mammi, C., Fabbri, A., Rosano, G.M. and Caprio, M., 2012. The role of the mineralocorticoid receptor in adipocyte biology and fat metabolism. Mol. cell. Endocrinol., 350: 281-288. https://doi.org/10.1016/j.mce.2011.09.011[CrossRef]
- Moore, S.S., Li, C., Basarab, J., Snelling, W.M., Kneeland, J., Murdoch, B., Hansen, C. and Benkel, B., 2003. Fine mapping of quantitative trait loci and assessment of positional candidate genes for backfat on bovine chromosome 14 in a commercial line of Bos taurus. J. Anim. Sci., 81: 1919-1925. https://doi.org/10.2527/2003.8181919x[CrossRef]
- Okumura, T., Saito, K., Sakuma, H., Nade, T., Nakayama, S., Fujita, K. and Kawamura, T., 2007. Intramuscular fat deposition in principal muscles from twenty-four to thirty months of age using identical twins of Japanese Black steers. J. Anim. Sci., 85: 1902-1907. https://doi.org/10.2527/jas.2006-752[CrossRef]
- Picard, F., Kurtev, M., Chung, N., Topark-Ngarm, A., Senawong, T., Machado De Oliveira, R., Leid, M., McBurney, M.W. and Guarente, L., 2004, Sirt1 promotes fat mobilization in white adipocytes by repressing PPAR-gamma. Nature, 429: 771-776. https://doi.org/10.1038/nature02583[CrossRef]
- Rangwala, S.M. and Lazar, M.A., 2000, Transcriptional control of adipogenesis. Annu. Rev. Nutr., 20: 535-559. https://doi.org/10.1146/annurev.nutr.20.1.535[CrossRef]
- Reusch, J.E., Colton, L.A. and Klemm, D.J., 2000, CREB activation induces adipogenesis in 3T3-L1 cells. Mol. cell. Biol., 20: 1008-1020. https://doi.org/10.1128/MCB.20.3.1008-1020.2000[CrossRef]
- Rosen, E.D. and Spiegelman, B.M., 2000. Molecular regulation of adipogenesis. Annu. Rev. Cell Develop. Biol., 16: 145-171. https://doi.org/10.1146/annurev.cellbio.16.1.145[CrossRef]
- Rule, D.C., Thornton, J.H., McGilliard, A.D. and Beitz, D.C., 1992. Effect of adipose tissue site, animal size, and fasting on lipolysis in bovine adipose tissue in vitro. Int. J. Biochem., 24: 789-793. https://doi.org/10.1016/0020-711X(92)90013-Q[CrossRef]
- Song, E.L., Liu, X.M., Wu, N.K., Tan, X.W., Liu, G.F. and Wan, F.C., 2011. Performance measurement report on LI-LU cattle (the first report). China Cattle Sci., 37: 46-48.
- Song, E.L., Liu, X.M., Wu, N.K., Tan, X.W., Liu, G.F. and Wan, F.C., 2012. Performance measurement report on LI-LU cattle (the second report). China Cattle Sci., 1: 22-24.
- Sun, W.X., Wang, H.H., Jiang, B.C., Zhao, Y.Y., Xie, Z.R., Xiong, K. and Chen, J., 2013. Global comparison of gene expression between subcutaneous and intramuscular adipose tissue of mature Erhualian pig. Genet. mol. Res., 12: 5085-5101. https://doi.org/10.4238/2013.October.29.3[CrossRef]
- Taniguchi, M., Guan, L.L., Basarab, J.A., Dodson, M.V. and Moore, S.S., 2008. Comparative analysis on gene expression profiles in cattle subcutaneous fat tissues. Comp. Biochem. Physiol. Part D: Genom. Proteom., 3: 251-256. https://doi.org/10.1016/j.cbd.2008.06.002[CrossRef]
- Wang, Y.H., Byrne, K.A., Reverter, A., Harper, G.S., Taniguchi, M., McWilliam, S.M., Mannen, H., Oyama, K. and Lehnert, S.A., 2005. Transcriptional profiling of skeletal muscle tissue from two breeds of cattle. Mammal. Genom., 16: 201-210. https://doi.org/10.1007/s00335-004-2419-8[CrossRef]
- Wang, B., Ning, Q.J., Wang, Q., Peng, W., Hao, T., and Sun, J.S., 2018. Reconstruction and Subcellular localization analysis of eriocheir sinensis molting protein-protein interaction network. Pakistan J. Zool., 50: 1777-1784. http://dx.doi.org/10.17582/journal.pjz/2018.50.5[CrossRef]
- Wood, J.D., Enser, M., Fisher, A.V., Nute, G.R., Sheard, P.R., Richardson, R.I., Hughes, S.I. and Whittington, F.M., 2008. Fat deposition, fatty acid composition and meat quality: A review. Meat Sci., 78: 343-358. https://doi.org/10.1016/j.meatsci.2007.07.019[CrossRef]
- Wu, X.L., Macneil, M.D., De, S., Xiao, Q.J., Michal, J.J., Gaskins, C.T., Reeves, J.J., Busboom, J.R., Wright, R.W. and Jiang, Jr. Z., 2005. Evaluation of candidate gene effects for beef backfat via Bayesian model selection. Genetica, 125: 103-113. https://doi.org/10.1007/s10709-005-5255-1[CrossRef]
- Yamauchi, T. and Kadowaki, T., 2001, The molecular mechanisms by which PPAR gamma/RXR inhibitors improve insulin resistance, Nihon rinsho. Japanese J. clin. Med., 59: 2245-2254.
- Yu, L., Guo, N., Yang, Y., Wu, X., Meng, R., Fan, J., Ge, F., Wang, X., Liu, J. and Deng, X., 2010. Microarray analysis of p-anisaldehyde-induced transcriptome of Saccharomyces cerevisiae. J. Indust. Microbiol. Biotechnol., 37: 313-322. https://doi.org/10.1007/s10295-009-0676-y[CrossRef]
Services
Article usage statistics
Loading…