
This study assessed contamination levels and identified the potential sources of heavy metals (Pb, Ni, Cr, and Cu) in agricultural soils of Iraq’s Middle Euphrates region using geochemical indices (Igeo, EF, CF, PLI). Analysis of 50 surface soil samples from cultivated, fallow, and pollution-proximal areas revealed distinct patterns: the Contamination Factor (CF) indicated moderate to considerable contamination by Pb, Ni, and Cr (maximum CF values of 6.0, 9.95, and 6.0, respectively), whereas Cu showed generally low contamination (CF = 0.81–3.43). The Enrichment Factor (EF) moderate to high enrichment for Ni (0.76–6.55) and a range from deficiency to moderate enrichment for Pb (0.56–3.95), whereas Cu and Cr displayed lower enrichment factors (0.40–2.95 and 0.63–4.08, respectively). An integrated assessment using the Pollution Load Index (PLI) confirmed moderate to considerable overall metal accumulation (1.11–5.85). Source identification based on Igeo and EF indicated suggested mainly geogenic origins for Pb and Cu, a pronounced anthropogenic contribution for Ni, and mixed lithogenic–anthropogenic sources for Cr. These results underscore the urgency of adopting sustainable land management and targeted monitoring to mitigate contamination, protect soil resources, and reduce human exposure via the food chain.
Research Article · Volume 42, Issue 1, 11 March 2026 · Open Access
Assessment of Pollution Indicators and Source Apportionment of Heavy Metals in Agricultural Topsoils of the Middle Euphrates Region, Iraq
· ·
Affiliations & Notes ⌄
- 1Department of Soil Science and Water Resources College of Agricultural Engineering Sciences University of Baghdad, Baghdad, Iraq
- 23Commission Agricultural Research Centre, Baghdad, Iraq. *Correspondence | Mazin Fadhil Khudhair, Department of Soil Science and Water Resources College of Agricultural Engineering Sciences University of Baghdad, Baghdad, Iraq
- 3Email: mazin.fadhil@coagri.uobaghdad.edu.iq
Article Info ⌄
- Journal:
- Sarhad Journal of Agriculture
- Published:
- 11 March 2026
From the article
- The agricultural soils of Iraq’s Middle Euphrates region are moderately to severely contaminated with heavy metals (Pb, Ni, Cr, and Cu).
- Anthropogenic activities, notably inadequate waste management and industrial emissions, represent the predominant contamination sources, particularly near point sources like landfills and industrial complexes.
- Geochemical indices, however, suggested a primarily lithogenic origin for Copper (Cu) and Lead (Pb) at most sampling sites.
- Future work should incorporate correlation and multivariate statistical analyses to refine source apportionment accuracy and evaluate the potential ecological and health risks associated with metal accumulation.
Selected from the article's own text.
Abstract
Introduction
Heavy metals (HMs), which are metallic elements of high density and inherent toxicity even at low concentrations, represent a major environmental threat to living organisms . Quantitatively, they are characterized by an atomic weight exceeding 58.5 and a specific density greater than 5 g cm-³. Although these elements occur naturally, anthropogenic activities including industrial operations, agricultural practices, mining, and waste incineration are substantially elevating their concentrations in agricultural environments, thereby disrupting their natural biogeochemical cycles . A critical concern is their environmental persistence, as they are non-degradable and can accumulate for extended periods. Particularly hazardous metals such as cadmium, lead, arsenic, mercury, and chromium exhibit a dose and duration dependent toxicity, capable of inducing deleterious effects even at trace levels.
The bioaccumulation of HMs in the food chain constitutes a significant threat to global food security and public health. These contaminants transfer through trophic levels, potentially inducing toxicological effects in humans by disrupting physiological processes, even at low concentrations . Agricultural soil contamination, predominantly from anthropogenic sources such as fertilizer overuse and contaminated irrigation water, directly compromises soil health, crop quality, and food safety . Therefore, elucidating the origins and spatial distribution of HMs in topsoil is imperative for accurate environmental risk assessment and the formulation of targeted remediation strategies.
The bioavailability and mobility of HMs are strongly governed by soil physicochemical properties. Research indicates that their retention increases with higher concentrations of calcite and clay minerals, which enhance adsorption and precipitation processes ; . Calcareous soils, characterized by alkaline pH and abundant carbonate content, exhibit significant variability in lead concentrations, attributed to its complexation with carbonate minerals .
Source apportionment studies reveal a clear distinction between pristine and impacted areas. In arid regions distal from direct pollution sources, the geogenic background dominates (∼70%), with anthropogenic contributions accounting for the remainder . Conversely, in polluted areas, industrial emissions, vehicular traffic, and mining waste are the principal anthropogenic sources of heavy metal contamination (e.g., Zn, Fe, Co, Cu, Pb, Mn), with a negligible contribution from parent rock material .
Pollution indices namely the Contamination Factor (CF), Pollution Load Index (PLI), and Enrichment Factor (EF) consistently reveal that heavy metal concentrations in agricultural soils exceed permissible limits, particularly in proximity to industrial zones . These indices provide a critical quantitative assessment of contamination levels and are instrumental in guiding environmental policy and research priorities. In Iraq, pollution sources are predominantly anthropogenic. Recent studies identify contaminated irrigation water as a primary vector in agricultural areas , while industrial emissions, notably from oil refining, significantly contaminate soils adjacent to petroleum facilities . Further exacerbating the issue are the use of wastewater and unsustainable agricultural practices . The efficacy of indices such as the Geoaccumulation Index (Igeo) and CF in source apportionment has been demonstrated, for instance, in tracing contamination to traffic emissions . The Middle Euphrates region, one of Iraq’s most productive agricultural zones, is increasingly affected by industrial expansion and wastewater reuse, raising concerns over soil contamination. However, limited information is available on the spatial variability and source contribution of heavy metals in the agricultural soils of this region. Against this backdrop, the present study aims to quantify the contamination levels of selected heavy metals and differentiating between anthropogenic and geogenic contributions of Lead (Pb), Nickel (Ni), Chromium (Cr), and Copper (Cu) contamination.
Materials and Methods
Study area
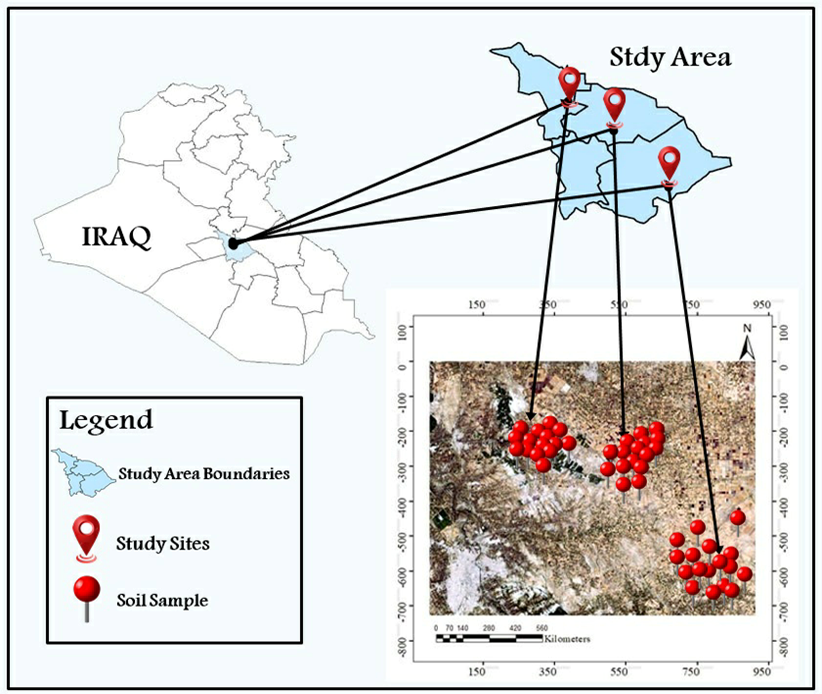
The investigation was conducted in a semi-arid region of the Middle Euphrates, Iraq Figure 1), encompassing three predominantly
Table 1: Location coordinates of the collected soil samples.
| Site | Latitude (N) | Longitude (E) | Site | Latitude (N) | Longitude (E) |
| 1 | 32°33'21.3" | 44°31'50.3" | 26 | 32°33'14.3" | 44°33'07.8" |
| 2 | 32°33'20.6" | 44°31'49.1" | 27 | 32°32'29.6" | 44°31'40.1" |
| 3 | 32°33'25.0" | 44°31'41.0" | 28 | 32°32'37.1" | 44°30'56.0" |
| 4 | 32°33'32.7" | 44°31'45.9" | 29 | 32°32'47.2" | 44°31'32.5" |
| 5 | 32°33'39.3" | 44°31'39.7" | 30 | 32°33'02.3" | 44°33'56.5" |
| 6 | 32°33'45.6" | 44°31'42.5" | 31 | 32°33'07.8" | 44°34'00.4" |
| 7 | 32°33'45.2" | 44°31'56.2" | 32 | 32°33'26.8" | 44°33'22.1" |
| 8 | 32°33'41.2" | 44°31'56.0" | 33 | 32°33'24.2" | 44°33'07.1" |
| 9 | 32°33'46.0" | 44°32'06.6" | 34 | 32°33'35.8" | 44°33'01.4" |
| 10 | 32°33'48.7" | 44°32'14.6" | 35 | 32°33'40.9" | 44°32'48.3" |
| 11 | 32°33'57.4" | 44°31'40.1" | 36 | 32°33'57.8" | 44°32'49.8" |
| 12 | 32°33'58.4" | 44°31'45.2" | 37 | 32°34'01.8" | 44°32'46.9" |
| 13 | 32°34'09.1" | 44°31'45.0" | 38 | 32°34'12.3" | 44°32'34.4" |
| 14 | 32°34'17.9" | 44°31'26.1" | 39 | 32°34'29.5" | 44°32'32.9" |
| 15 | 32°34'35.9" | 44°31'22.1" | 40 | 32°34'50.1" | 44°32'09.5" |
| 16 | 32°35'01.8" | 44°32'44.2" | 41 | 32°24'03.9" | 44°43'48.3" |
| 17 | 32°35'01.1" | 44°32'53.7" | 42 | 32°24'13.0" | 44°44'01.2" |
| 18 | 32°34'50.9" | 44°32'51.7" | 43 | 32°24'13.6" | 44°44'07.7" |
| 19 | 32°34'52.1" | 44°32'32.4" | 44 | 32°24'18.4" | 44°47'16.6" |
| 20 | 32°34'37.9" | 44°32'41.3" | 45 | 32°24'17.3" | 44°47'38.6" |
| 21 | 32°34'23.0" | 44°32'49.0" | 46 | 32°23'05.0" | 44°48'43.8" |
| 22 | 32°34'04.4" | 44°33'06.9" | 47 | 32°19'41.6" | 44°44'02.6" |
| 23 | 32°34'02.6" | 44°33'12.2" | 48 | 32°24'00.1" | 44°44'50.7" |
| 24 | 32°33'38.4" | 44°33'13.4" | 49 | 32°23'29.4" | 44°44'54.0" |
| 25 | 32°34'10.2" | 44°33'25.9" | 50 | 32°23'35.7" | 44°48'36.6" |
agricultural sub-districts: Al-Nile (sites 1–20), Shumali (sites 21–39), and Al-Imam (sites 40–50) Table 1. The predominant soil type in the study area was calcareous, with a pH range of 7.0–8.1, indicating mildly to moderately alkaline conditions. Soil textures vary between sandy clay (SC) and clay loam (CL). The area is subject to multiple anthropogenic pollution sources, hosting diverse industrial point sources including sugar refineries, oil processing facilities, and plants for construction materials and adhesives. Further contamination pressures arise from the Abu Shalab – Al-Sayihiya sanitary landfill and intensive poultry farming operations.
Soil samples
Surface horizon soil samples (0–30 cm depth, representing the primary root zone for most agricultural crops) were collected as discrete, uncompromised cores to prevent mixing between surface and subsurface soils with a stainless-steel auger during the early spring season (March 2024). A total of 50 samples collected according to a stratified random sampling design from both cultivated and uncultivated areas, reflecting the spatial heterogeneity of pollution sources within the study area.
Soil analysis
Following collection, the samples were air-dried under controlled conditions (25 °C) to prevent contamination. Subsequently, they were gently crushed using a wear-resistant polycarbonate hammer to minimize the risk of metallic contamination. After the removal of visible impurities, the material was sieved through a 2 mm stainless-steel sieve. Soil texture was determined by the hydrometer method, soil pH was measured in a 1:1 soil-water suspension using a pH meter, and calcium carbonate content was quantified by the calcimeter method, as mentioned in Methods of Soil, Plant, and Water Analysis . The total concentrations of Pb, Ni, Cu, Cr, and Fe were determined through digestion of 2 g of each soil sample in triplicate with a HClO₄–HNO₃–H₂SO₄
Table 2: Categories for Igeo, EF, CF, and PLI indices ((Muller, 1981); ; ; .
| Igeo | EF | CF | PLI | ||||
| Degree | Value | Degree | Value | Degree | Value | Degree | Value |
| Uncontaminated | ≤ 0 | Low | < 2 | Low | < 1 | Uncontaminated | = 0 |
| Slightly | 0-1 | Moderate | 2 - 5 | Moderate | 1 - < 3 | Low | 0 - 1 |
| Moderately | 1-2 | High | 5 - 20 | High | 3 - < 6 | Moderate | 1 - 2 |
| Moderately to heavily | 2-3 | Very high | 20-40 | Very high | ≥ 6 | High | 2 - 3 |
| Heavily | 3-4 | Extremely high | ≥ 40 | Very high | > 3 | ||
| Heavily to extremely | 4-5 | ||||||
| Extremely | >5 | ||||||
mixture, following the established protocol of a manual for the West Asia and North Africa region . Heavy metal concentrations were measured using an Atomic Absorption Spectrometer (AAS, analytik jena novAA 400). All analyses were conducted in the laboratory of the Department of Soil and Water management at the Agricultural Research Center, Baghdad.
Quality assurance and quality control (QA/AC)
HMs were analyzed using a novAA 400 Atomic Absorption Spectrometer (Analytik Jena). The limits of detection (LODs) were 0.5 (Pb), 0.3 (Ni), 0.2 (Cu), 0.5 (Cr), and 1.0 (Fe) mg kg-1. Accuracy of the results was confirmed by approved reference materials (NIST SRM 2709a), with recovery rates ranging (90 – 110) %. Values of the procedural blank samples were below LDs, and the repeatability accuracy (RSD) was less than 5%. Calibration (R² > 0.999) was verified using approved standards.
Pollution indices
Pollution indices in soil are quantitative mathematical equations used to assess the level of contamination with HMs and other pollutants by comparing their concentrations with reference values or environmental standards. This aids in identifying pollution sources and their risk severity. Indices such as CF, PLI, Igeo and EF provide a scientific basis for soil management decision-making . Table 2 provides a summary of the pollution indices.
Geo-accumulation index (Igeo)
In 1969, the German scientist Müller (Muller, 1969) proposed a quantitative equation for assessing the contamination of soil and sediments by HMs and other pollutants. This index, known as Igeo, is based on comparing the concentration of a pollutant element in the study sample with its natural geological background values, while accounting for natural variations through a correction factor of 1.5
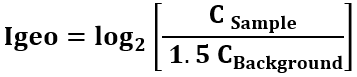
Where: C sample represents the concentration of the heavy metal in the analyzed soil, and C background denotes its Lithogenic background concentration.
Enrichment factor (EF)
The term refers to a quantitative statistical index developed by the British scientist Chester and the American scientist Stoner (Chester and Stoner, 1973), which is used to assess the degree of soil contamination by HMs. This is achieved by comparing the concentration of the element under study (the sample metal) with that of a stable reference element, such as iron (Fe). It is calculated using Equation (2).
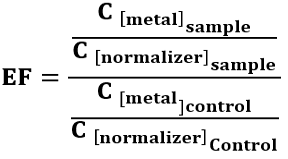
Where: C metal is the concentration of the target element, C normalizer is the concentration of the reference element (Fe).
Contamination factor (CF)
It is a simple quantitative mathematical index developed by the Swedish scientist Hakanson to assess the level of soil contamination with HMs or chemical substances. This factor is calculated using mathematical Equation (3).
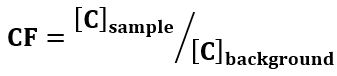
Where: [C] represents the concentration of the element in the sample and the background, respectively.
Pollution load index (PLI)
This guideline, established by the British scientist Tomlinson et al. , is used as an index for assessing comprehensive soil pollution. It relies on calculating the geometric mean of the contamination factor (CF) values for multiple elements and can be computed using Equation (4).
Table 3: Values of normalizer and background control
| Sub-districts | mg Kg-1 | ||||
| Fe | Pb | Ni | Cu | Cr | |
| Al-Nile | 17079 | 88.68 | 78.31 | 29.07 | 118.45 |
| Shumali | 17083 | 91.32 | 66.66 | 34.72 | 118.92 |
| Al-Imam | 17077 | 90.35 | 70.93 | 29.11 | 112.85 |

Where: (n) is the number of studied elements, and CF is the contamination factor for each individual element.
Samples (normalizer and background control) were taken from an area unaffected by human activities, away from agricultural and industrial activities within the study area (Table 3).
Results and Discussion
Igeo (Pb, Ni, Cu and Cr)
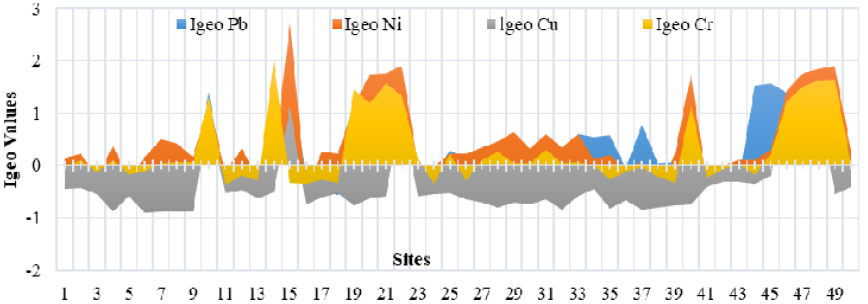
Analysis of the geo-accumulation index (Igeo) across the study area revealed considerable spatial heterogeneity in contamination levels for all investigated elements (Figure 2). Igeo values ranged from uncontaminated to heavily contaminated categories. Specifically for lead (Pb), Igeo values ranged from <0 to 2, indicating pollution levels from uncontaminated to moderately contaminated. moderate Pb contamination affected 52% of the sampled sites. Overall, Igeo revealed distinct contamination profiles for the studied metals. Nickel (Ni) contamination was widespread, with I-geo values ranging from <0 to 2.73, indicating that 87.1% of sampling sites exhibited low to severe pollution. In contrast, copper (Cu) levels were largely uncontaminated (I-geo: <0 to 1.19), with 88% of sites falling within the background category. Chromium (Cr) showed an intermediate state, with a maximum I-geo of 2; however, 58% of sites still displayed low to moderate contamination, despite generally negative values.
EF (Pb, Ni, Cu and Cr)
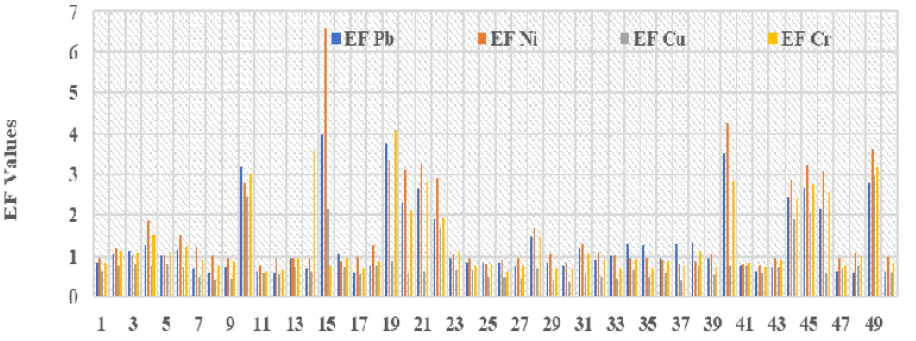
Analysis of soil heavy metal content for Pb, Ni, Cu, and Cr revealed distinct spatial variations in elemental enrichment sources across the study area (Figure 3). Quantification using the Enrichment Factor (EF), as per the Tomlinson et al., (1980) classification scheme, indicated enrichment levels ranging from minimal to high.
Site-specific EF values demonstrated considerable variation. Lead exhibited minimal to moderate enrichment, with EFs ranging from 0.56 to 3.95. Nickel enrichment spanned from minimal to high (EFs: 0.76 - 6.55). For copper and chromium, EF values ranged from 0.40 to 2.95 and 0.63 to 4.08, respectively, corresponding to minimal to moderate enrichment levels.
CF (Pb, Ni, Cu and Cr)
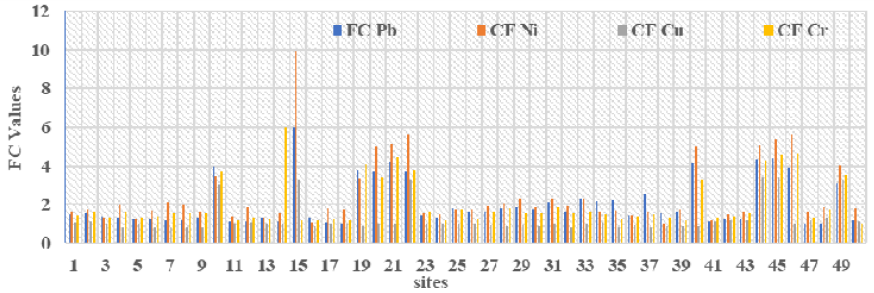
According to Hakanson (1980) classification, the soils in the study area display a spectrum of heavy metal contamination (Figure 4). The contamination factor for lead ranged as moderate to considerable 1.10 – 6.00, a classification shared by chromium 1.00 – 6.00. Nickel levels also indicate moderate to considerable contamination (1.21–9.95). Conversely, copper is characterized by a broader pollution gradient, ranging from low to high 0.81–3.43.
PLI (Pb, Ni, Cu and Cr)
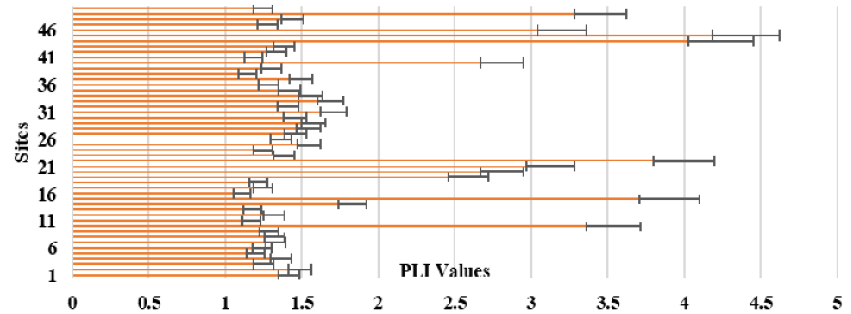
Analysis of the Pollution Load Index (PLI) demonstrated discernible heavy metal contamination across all sampled soils from the study area. Computed PLI values ranging from 1.11 to 5.85. According to the Tomlinson et al., (1980) classification, these results indicate a pollution status spanning from moderate to severe (Figure 5). The elevated PLI values signify a considerable anthropogenic burden, with specific sites exhibiting a pronounced state of heavy metal accumulation, highlighting significant agricultural pollution within the region.
Based on Igeo, EF and CF interpretations supported by PCA, approximately 65% of the total metal load was attributed to anthropogenic sources, mainly landfill leachates and industrial effluents, while 35% originated from lithogenic background materials. The highest anthropogenic contribution was observed in the Al-Nile sub-district, corresponding to proximity
to the Abu Shalab landfill. Geochemical indices, including the Geo-accumulation Index (Igeo), Enrichment Factor (EF), Contamination Factor (CF), and Pollution Load Index (PLI), revealed significant spatial heterogeneity in soil contamination by HMs (Pb, Ni, Cu, Cr) across the study area. This heterogeneous distribution of pollutants has profound implications for agricultural sustainability, ecosystem integrity, and regional food security. The primary vectors for heavy metal introduction into the food web are threefold: (1) Phytoavailability and subsequent root uptake, where agricultural crops assimilate metals from the soil, leading to bioaccumulation in edible tissues and compromising crop safety and public health . (2) Atmospheric deposition of metal-laden particulate matter originating from industrial and waste disposal emissions, which directly contaminates the phyllosphere of leafy vegetables, often resulting in concentrations that exceed international safety standards . (3) Irrigation practices utilizing contaminated water, where leachates from waste sites or industrial effluents pollute water resources, thereby facilitating the widespread dispersion of metals across agricultural landscapes .
The ramifications of this pollution extend beyond public health, significantly impairing the economic viability of agriculture through the degradation of soil health. Elevated concentrations of HMs, such as nickel and lead, disrupt soil microbiological equilibrium. suppressing the activity of microbial communities essential for nutrient cycling and organic matter decomposition , precipitating a long-term decline in soil fertility that often precedes the manifestation of visible phytotoxicity . Furthermore, the conversion of cultivated land to fallow may exacerbate pollution severity, as active agricultural management can have a mitigating effect.
The findings of this study substantiate that anthropogenic activities, particularly inadequate waste management and industrial emissions, are the principal drivers of soil degradation in the region. The pronounced spatial variability in contamination levels underscores the necessity for precision agricultural management strategies. A targeted approach is urgently required, prioritizing continuous monitoring and remediation of identified hotspots, coupled with the promotion of Good Agricultural Practices (GAPs) in moderately affected zones. Interventions such as restricting cultivation in heavily polluted areas and deploying advanced remediation technologies are critical to ensuring sustainable agriculture and safeguarding environmental and human health.
The analysis of the Geo-accumulation Index (Igeo) revealed a clear distinction between geogenic and anthropogenic sources for the studied metals. A predominant geogenic origin was indicated for Pb, Cr, and Ni in 48%, 12.9%, and 42% of the sites, respectively, suggesting minimal anthropogenic influence in these locales. Conversely, anthropogenic contributions ranged from limited to significant at other sites. The most pronounced impact was observed at Site 15, adjacent to the Abu Shalab - Al-Sayihiya landfill (Al-Nile sub-district), which exhibited elevated Igeo values for Pb (2.00), Ni (2.73), and Cu (2.00). In contrast, anthropogenic enrichment of Cu was less widespread (12% of sites), with notable concentrations confined to Sites 44 and 45 near oil and sugar refining facilities (Al- Shumali sub-district; Igeo = 1.19). This spatial patterning of Igeo values confirms that industrial waste discharges are a critical pollution source, significantly exceeding Lithogenic background concentrations inherent to the local geology .
This dichotomy was further elucidated by the Enrichment Factor (EF) results. Geogenic processes, attributable to parent material weathering, were the predominant source of enrichment for lead (Pb) and chromium (Cr), accounting for 80% of enriched sites. Anthropogenic activities were responsible for the remaining 20%. The maximum EF for Pb (3.95) at Site 15 is likely linked to leachate from the adjacent landfill. The peak EF for Cr (4.08) at Site 19, near a building materials plant, is ascribed to low-level but persistent industrial emissions and atmospheric deposition, compounded by the site’s status as a fallow field with a history of irrigation with low-quality water . For nickel (Ni), geogenic sources predominated at 78% of sites, with anthropogenic factors contributing to 22%. The most significant anthropogenic impact was again evident at Site 15 (EF = 6.55). Copper (Cu) enrichment was overwhelmingly geogenic (92% of sites), with minimal anthropogenic influence (8%); the most pronounced effect was recorded at Site 49 (EF = 2.95), attributed to leaching from a neighboring date canning factory.
Assessment via the Contamination Factor (CF) indicated widespread soil pollution by Pb, Ni, Cu, and Cr across the study area, with considerable spatial variability. The highest CF values for Pb, Ni, and Cr were consistently recorded at Site 15 (6.00, 9.95, and 6.00, respectively), reinforcing the role of the solid waste landfill as a major point source. In contrast, notable Cu contamination (CF = 3.43) was localized to Sites 44 and 45, proximate to vegetable oil and sugar processing plants, likely a consequence of industrial waste and specific agricultural practices .
A clear correlation between heavy metal accumulation and anthropogenic pressure was demonstrated by the Pollutant Load Index (PLI). Fallow soils adjacent to persistent, low-intensity pollution sources exhibited PLI values ranging from 2.59 to 5.85, signifying high to very high contamination and a state of significant environmental degradation. Conversely, cultivated soils situated away from direct anthropogenic influences showed markedly lower PLI values (1.11–1.17), indicative of a moderate contamination level and representing an initial stage of Anthropogenic impact. This contrast highlights the role of land use and proximity to pollution sources in determining the severity of contamination.
Conclusions and Recommendations
The agricultural soils of Iraq’s Middle Euphrates region are moderately to severely contaminated with heavy metals (Pb, Ni, Cr, and Cu). Anthropogenic activities, notably inadequate waste management and industrial emissions, represent the predominant contamination sources, particularly near point sources like landfills and industrial complexes. Geochemical indices, however, suggested a primarily lithogenic origin for Copper (Cu) and Lead (Pb) at most sampling sites. The significant spatial heterogeneity in pollution levels necessitates targeted intervention strategies. Accordingly, integrated mitigation measures are recommended, including systematic monitoring, remediation of identified hotspots, and the promotion of sustainable land-use and irrigation practices. Future work should incorporate correlation and multivariate statistical analyses to refine source apportionment accuracy and evaluate the potential ecological and health risks associated with metal accumulation.
Acknowledgements
The authors would like to thank the staff of the Soil and Water Management Department Laboratory at the Agricultural Research Center, Scientific Research Council, for their support. This research is based on the first author’s doctoral dissertation.
Novelty Statement
This study presents the first comprehensive assessment of heavy metal pollution in the agricultural topsoils of Iraq’s Middle Euphrates region. By integrating multiple geochemical indices, the research quantifies contamination levels, discriminates between geogenic and anthropogenic sources, and identifies specific hotspots linked to localized industrial and waste disposal activities.
Author’s Contribution
Abdulbaqi D Al Maamouri and Sadeq Jaafar Hassan Dwenee: Supervised the research, developed the methodology, interpreted the results, and revised the manuscript.
Mazin Fadhil Khudhair: Conducted research, performed the chemical analyses, and wrote and formatted the manuscript. All authors have read and agreed to the published
version of the manuscript.
Generative AI or AI assisted technology statement
The authors declare that no genrative AI was used in the creation of this manuscript.
Conflict of interest
The authors have declared no conflict of interest.
Figures
Map of the study area showing sampling locations.
Geo-accumulation Index (Igeo) values for the study sites
Enrichment factor (EF) values for the study sites
Contamination factor (CF) values for the study sites
Pollution load index (PLI) values for the study sites
References
- Abdullahi, A., M.A. Lawal and A.M. Salisu. 2021. Heavy metals in contaminated soil: source, accumulation, health risk and remediation process. Bayero J. Pure and Appl. Sci., 14(1): 1–12. https://doi.org/10.4314/bajopas.v14i1.1[CrossRef]
- Al Maamouri, A.B.D. and H.A.S. Salwa. 2024. Effect of mineral composition on sequential extract of lead and cadmium in some Iraqi soils. Iraqi J. Agric. Sci., 55(6): 2060–2073. https://doi.org/10.36103/k8mc7q15[CrossRef]
- Al-Baldawi, I.A., S. Abdullah, N. Ismail, A. Almanso and S. Jasim. 2021. Phytotoxicity of Salvinia molesta in Diesel Exposure. Al-Khwarizmi Engineering J., 17(3): 13–21. https://doi.org/10.22153/kej.2021.09.0[CrossRef]
- Ali, R.J. and B.A. Sadee. 2023. Determination of essential and trace elements in various vegetables using ICP-MS. Baghdad Sci. J., 20(3): 0715-0715. https://doi.org/10.21123/bsj.2022.7253[CrossRef]
- AL-Najjar, R.D., T.A. Hussain and A.H.M.J. Al Obaidy. 2024. Geochemical Evaluation of Heavy Metals Soil Pollution in Al-Hayy District Affected by Agriculture Activities: a case study. Iraqi J. Sci., 65(8): 4359–4371. https://doi.org/10.24996/ijs.2024.65.8.19[CrossRef]
- Angon, P.B., M.K.C.S. Isiam, A. Das, N. Anjum, A. Poudel and S. Suchi. 2024. Sources, effects and present perspectives of heavy metals contamination: Soil, plants and human food chain. Heliyon., 10(7): 1-15. https://doi.org/10.1016/j.heliyon.2024.e28357[CrossRef]
- Aweez, S.J., D.A Darwesh. and B.A. Othman. 2021. Application of some single and integrated index Equation to assess heavy metal in different soils in Erbil governorate. Iraqi J. Agric. sci., 52(4): 868–875. https://doi.org/10.36103/ijas.v52i4.1394[CrossRef]
- Basha, N.T. and M.J. Issa. 2025. Determine the Pollution Indices of the Soil Near the Najaf Refinery in the Middle of Iraq. Iraqi J. Sci., 66(1): 219–229. https://doi.org/10.24996/ijs.2025.66.1.18[CrossRef]
- Chen, X., Y. Ren, C. Li, Y. Shang, R. Ji, D. Yao and Y. He. 2024. Study on Factors Influencing the Migration of Heavy Metals from Soil to Vegetables in a Heavy Industry City. Sustain., 16(24): 11084. https://doi.org/10.3390/su162411084[CrossRef]
- Chester, R. and J.H. Stoner. 1973. Pb in particulates from the lower atmosphere of the Eastern Atlantic. Nature., 245(5419): 27–28. https://doi.org/10.1038/245027b0[CrossRef]
- Duarte Z.V.M. and G.R. Carrillo. 2025. Assessment of Metal Contamination in Soil Adjacent to Mining Activities Using Some Indices. Soil Sediment Contamination., 34(3): 493–509. https://doi.org/10.1080/15320383.2024.2358437[CrossRef]
- Elnagar, S., M.K. Abdel-Fattah and M.S. Shokr. 2025. Assessment of Potential Soil Contamination by Heavy Metals in Some Areas of Nile Delta, Egypt. J. Sustain. Agric. Environ. Sci., 4(2): 36–48. https://doi.org/10.21608/jsaes.2025.385393.1137[CrossRef]
- Eskandari, E., M. Kosari, A. Davood, N. Khiavi, M. Saeedikhani, R. Katal and M. Zarinejad. 2020. A review on polyaniline-based materials applications in heavy metals removal and catalytic processes. Separation and Purification Technol., 231: 115901. https://doi.org/10.1016/j.seppur.2019.115901[CrossRef]
- Estefan, G., R. Sommer and J. Ryan. 2013. Methods of Soil, Plant, and Water Analysis: A manual for the West Asia and North Africa Region: Third Edition. Int. Center. Agric. Res. Dry Area. (ICARDA). https://hdl.handle.net/20.500.11766/7512
- Ghanem, A.M. and M.J. Issa. 2025. Concentrations of Heavy Metals in Soil of West Qurna-1Oilfield Northern Basrah. Iraqi J. Sci.. 66(6):2382–2393. https://doi.org/10.24996/ijs.2025.66.6.16[CrossRef]
- Hakanson, L. 1980. An ecological risk index for aquatic pollution control. A sedimentological approach. Water Res., 14(8): 975–1001. https://doi.org/10.1016/0043-1354(80)90143-8[CrossRef]
- Kumar, P., S. Alhag, E. Al-Shahari, M. Al-Fakeh, F.S. Abou, R. Bachheti, I. Siric and E. Eid. 2025. Impact of Irrigation with Contaminated River Water on Growth, Yield, and Heavy Metals Accumulation in Planted Armenian Cucumber (Cucumis melo var. flexuosus (L.) Naudin.). Water, Air, Soil Pollution., 236(1): 1–14. https://doi.org/10.1007/s11270-024-07642-z[CrossRef]
- Luo, H., L. Yang, C. Zhang, X. Xiao and X. Lyu. 2024. Early warning of heavy metals contamination in agricultural soils: Spatio-temporal distribution and future trends in the Hexi Corridor. Ecolog. Indicator., 160: 111908. https://doi.org/10.1016/j.ecolind.2024.111908[CrossRef]
- Müller, G. 1969. Index of geoaccumulation in sediments of the Rhine River. Geojournal., 2(3): 108–118. https://www.sid.ir/paper/618491/en
- Müller, G. 1981. Die Schwermetallbelastung der sedimente des Neckars und seiner Nebenflusse: Eine Bestandsaufnahme. Chemical Zeitung., 105: 157–164. https://www.sid.ir/paper/596736/en
- Nadem, S., A. Barakat, M. El Baghdadi, A. Hilali, E. Bouras, H. Mosaid and M. El Garnaoui. 2025. Using statistical analysis and pollution indices to characterize metal pollution in volcanic and calcareous soils in semi-arid regions. Ecolog. Engineer. Environ. Technol., 26(3): 17–33. https://doi.org/10.12912/27197050/199517[CrossRef]
- Naser, K.M. 2025. Evaluation of pollution of Diyala river water quality by some heavy metals (Pb, Cu, Ni, Cd), boron and their effect on pollution of agricultural soils. Iraqi J. Agric. Sci. 56(3):1157–1169. https://doi.org/10.36103/cxh3n392[CrossRef]
- Othman, B.A. and E.S. Kakey. 2021. Pesticides bioaccumulation and their soil pollutant effect. Iraqi J. Agric. Sci., 52(1):36–47. https://doi.org/10.36103/ijas.v52i1.1234[CrossRef]
- Rashid, A., B. Schutte, A. Ulery, M. Deyholos, S. Sanogo, E. Lehnhoff and L. Beck. 2023. Heavy Metal Contamination in Agricultural Soil: Environmental Pollutants Affecting Crop Health. Agron., 13(6): 1521. https://doi.org/10.3390/agronomy13061521[CrossRef]
- Rundel, P.W., and P.E. Villagra. 2007. Arid and Semi-Arid Ecosystems. The Physical Geography of South America., 7: 158-183. https://doi.org/10.1093/oso/9780195313413.003.0018[CrossRef]
- Sarma, H.H., A. Rajkumar, A. Baro, B. Das and N. Talukdar. 2024. Impact of Heavy Metal Contamination on Soil and Crop Ecosystem with Advanced Techniques to Mitigate Them. J. Advan. Biolog. Biotechnol., 27(6): 53–63. https://doi.org/10.9734/JABB/2024/v27i6865[CrossRef]
- Shref, A.M., A. Al Maamouri, M.F. Khudhair and F. Ahmed. 2024. Effect of clay minerals, calcite, and organic matter on adsorption and desorption of cadmium and lead. Iraqi J. Agric. Sci., 55(5):1657–1666. https://doi.org/10.36103/zfgk8x49[CrossRef]
- Sutherland, R.A. 2000. Bed sediment-associated trace metals in an urban stream, Oahu, Hawaii. Environ. Geolog., 39(6):611–627. https://doi.org/10.1007/s002540050473[CrossRef]
- Tomlinson, D.L., J. Wilson, C. Harris and D. Jeffrey. 1980. Problems in the assessment of heavy-metal levels in estuaries and the formation of a pollution index. Helgoländer Meeresuntersuchungen., 33(4): 566–575. https://doi.org/10.1007/BF02414780[CrossRef]
- Wang, H., Y. Li, J. Fu, S. Feng, Q. Cheng and J. Wei. 2025. Characterization and Risk Assessment of Heavy Metals in Topsoil of Agricultural Land from an Agate Dyeing Village. Water, Air, Soil Pollution., 236(8): 1–11. https://doi.org/10.1007/s11270-025-08043-6[CrossRef]
- Xu, W., Y. Jin and G. Zeng. 2024. Introduction of heavy metals contamination in the water and soil: a review on source, toxicity and remediation methods. Green Chemis. Letters Rev., 17(1). https://doi.org/10.1080/17518253.2024.2404235[CrossRef]
- Xu, X., Y. Liu, D. Gui, Q. Jin, S. Abd-Elmabod and T. Lin. 2025. Status of heavy metals contamination in the topsoil of major Oasis cities in Northwest China. Environmental Geochemis. Health., 47(9): 1–20. https://doi.org/10.1007/s10653-025-02659-7[CrossRef]
Services
Article usage statistics
Loading…