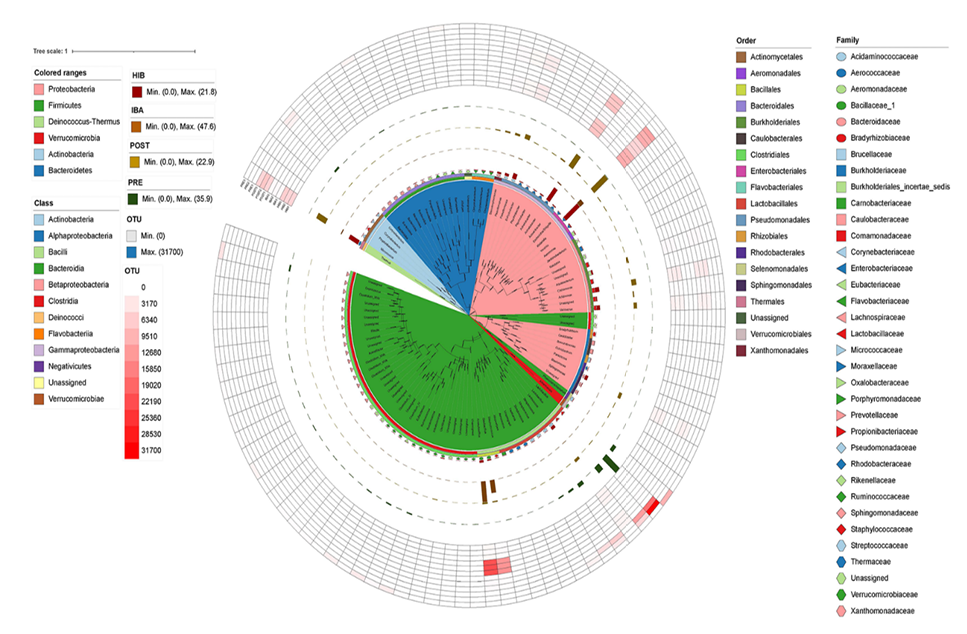
Fig. 8.
The main OTU evolutionary tree of intestinal bacteria. The OTU evolutionary tree was constructed using the Top 100 OTUs with a relative abundance greater than 0.2%. The branches of the evolutionary tree were filled with color using phylum-level bacterial classification. OTUs used the genus level to correspond to bacterial annotations. The circles of evolutionary tree from inside to outside with color bands or blocks were at the level of class, order, and family. The next level was a bar graph representing the expression level of OTUs in HIB, IBA, POST, and PRE groups. The outermost layer was a heat map of the corresponding OTU abundance in each sample.