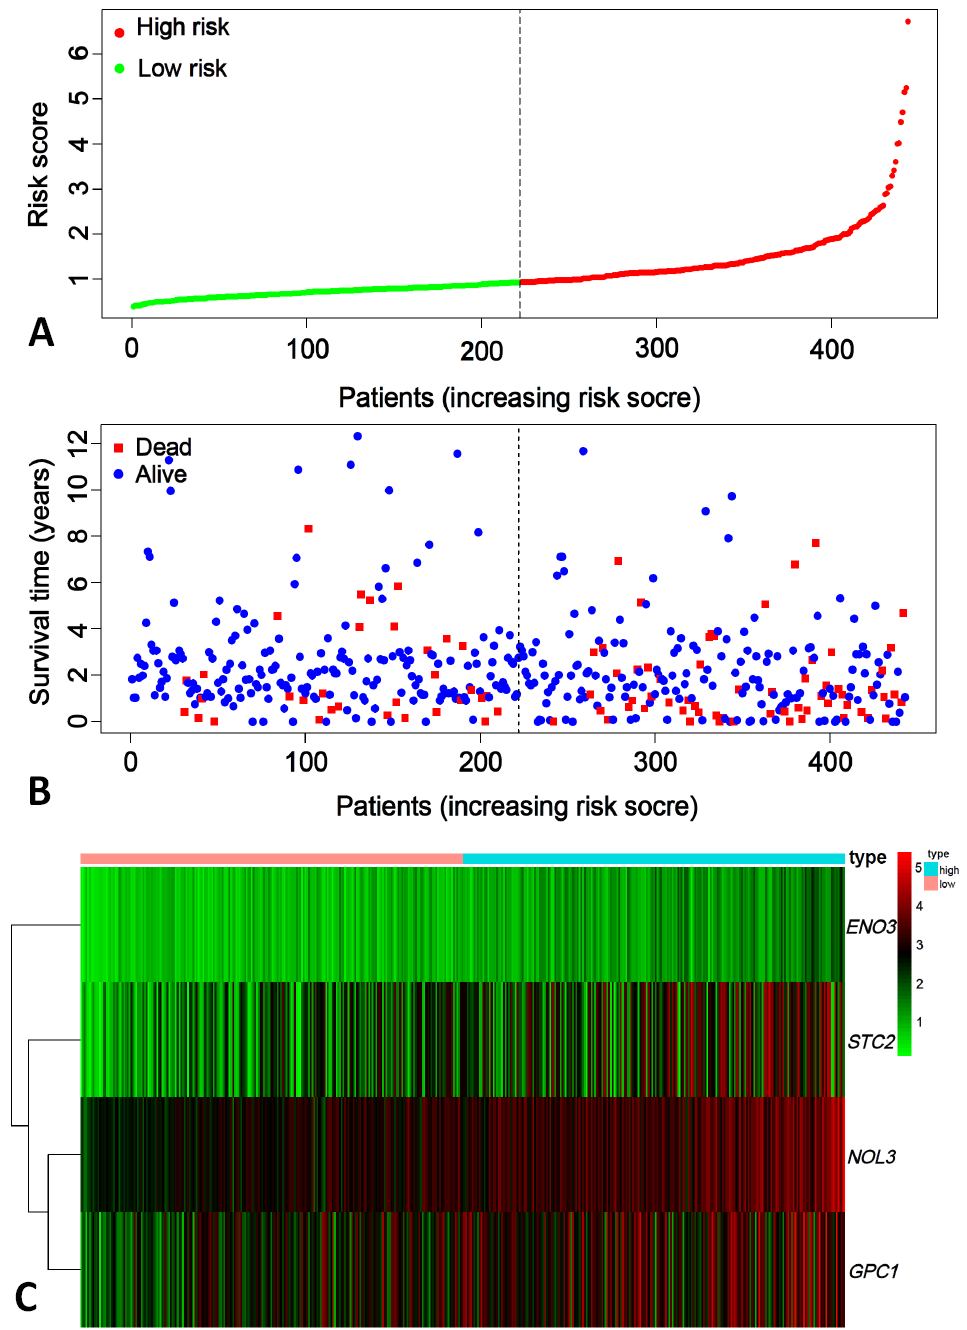
Fig. 3.
Risk map for glycolysis prognosis model in colon cancer patients.
A: risk score. B: the survival number of low risk score patients was significantly more than that of high risk score patients. C: heat map analysis. ENO3, GPC1, NOL3, STC2 genes expression in patients with high risk scores were significantly more than those with low risk scores.
