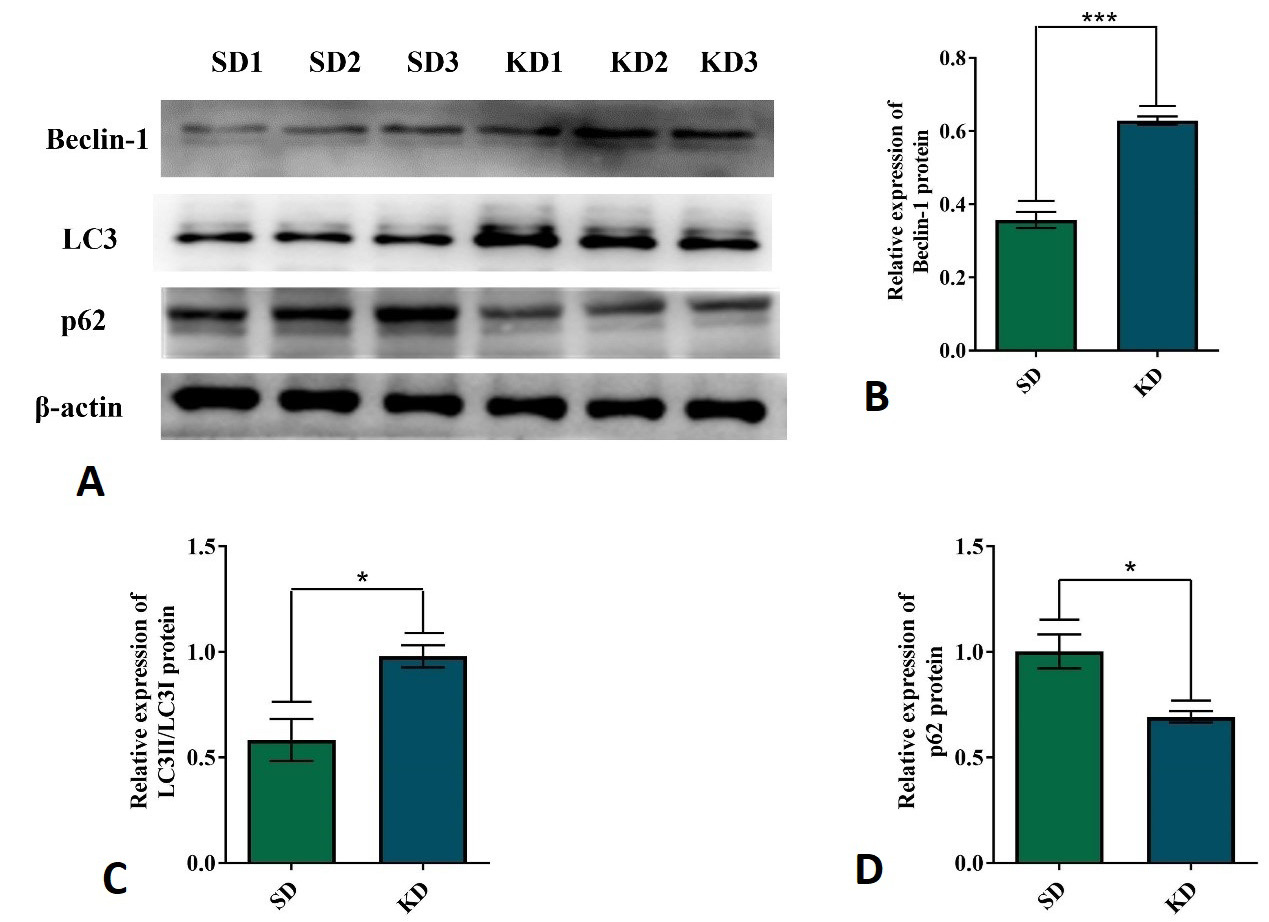
Fig. 1.
KD induced autophagy in CT26+ colon cancer mouse model. (A) The representative expression of Beclin-1, LC3, and p62 proteins in CT26+ tumor tissues and β-actin as the internal control for normalization. Quantitative analysis of Beclin-1 (B), LC3 (C), and p62 (D) proteins. Each experiment was repeated thrice, and all the data were presented as mean ± SEM in each case. Independent-sample T-test was used when different sets of data were compared. Statistically significant differences between different groups were indicated as *p < 0.05, **p < 0.01 and ***p < 0.001.
