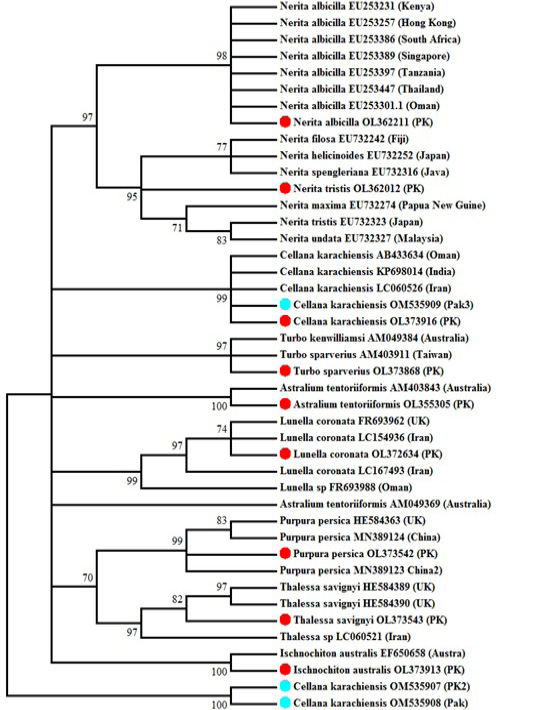
Fig. 1.
Molecular phylogenetic analysis by maximum likelihood method. The evolutionary history was inferred by using the maximum likelihood method based on the Tamura-Nei model. The percentage of trees in which the associated taxa clustered together is shown next to the branches. The red circles are showing the individuals of the present investigation, the blue circles are showing individuals other than this study from Pakistan.