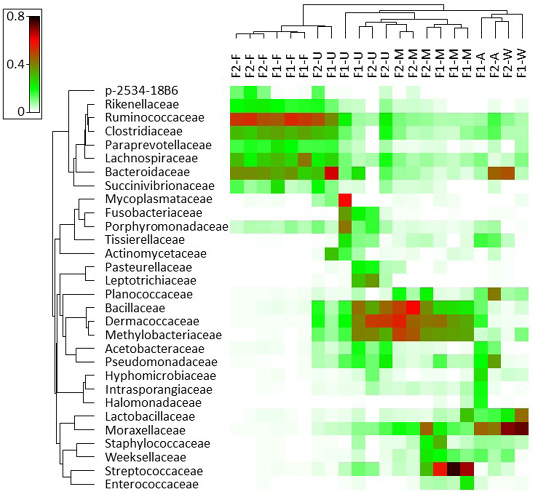
Figure 1:
Heatmap analysis showing hierarchical clustering of the relative abundance of the 30 most occurring OTUs in the fecal, milk, uterine, airborne dust, and water microbiota in dairy farms.F, fecal samples; M, milk samples; U, uterine samples; A, airborne dust samples; W, water samples; 1–2, the farm number.The color of each cell indicates the relative abundance of the bacterial family.