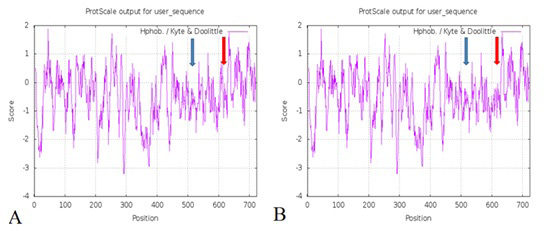
Fig. 3.
Hydrophobicity of EPB41L5 protein before and after mutation. (A) The hydrophobicity of the protein before mutation; (B) The hydrophobicity of the protein after mutation. Note: The blue arrow refers to the g. 64266710 G> C and g.64266715 G> C locus; the red arrow refers to the g. 64237881 A> C locus. The ordinate in the figure represents the hydrophobicity score of the protein. The area above the value of 0 is the hydrophobic area, and the area below the value of 0 is the hydrophilic area. The higher the score, the stronger the hydrophobicity of this area; the lower the score, the lower the hydrophobicity of this area. The abscissa represents the position of the amino acid.