
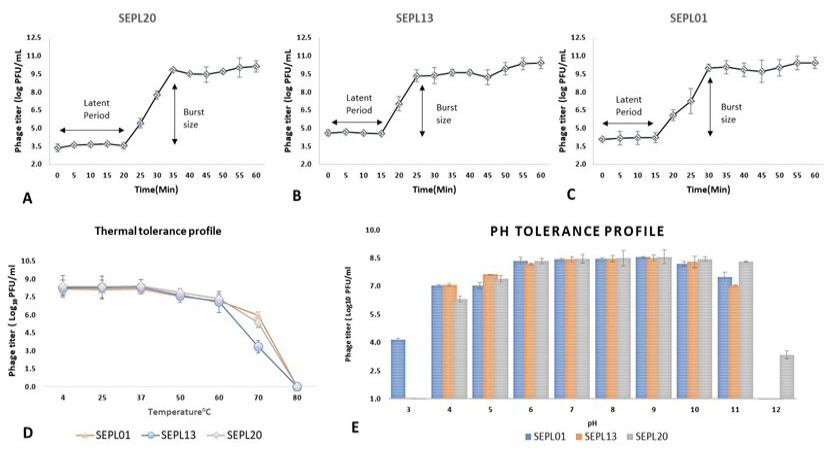
Fig. 3.
Growth curves of phage SEPL20 (A), phage SEPL13 (B), and phage SEPL01 (C). D shows tolerance profile of all three phages against different temperatures. E tolerance profile of all three phages against different pH. Data showed were means ± standard deviation of three independent experiments.