View larger version:
Download Original File
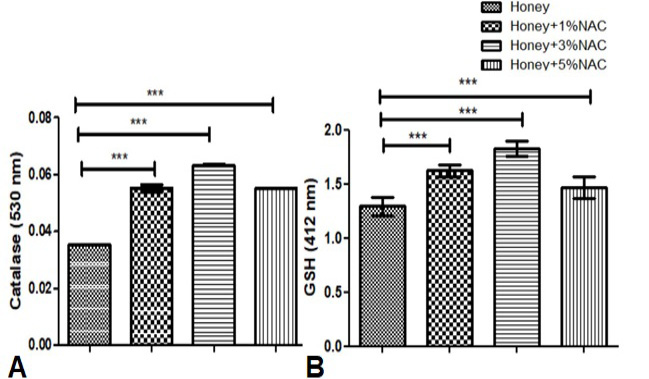
Fig. 4.
Effect of hony + NAC on Catalase (A) and GSH (B) in skin of rats. Values are presented as mean ± S.E.M; n = 9; *P<0.05, **P<0.01, and ***P< 0.001 compared to respective day control (honey) group.