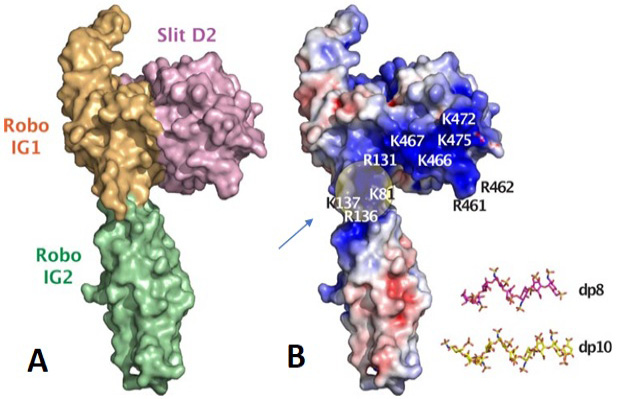
Fig. 6.
A model of human Slit2 (Domain 2) and Robo1 (IG1) complex. (A) shows the surface representation. (B) shows the electrostatic representation. The position of heparin binding to Slit2 and Robo is shown. The location of heparin oligosacharides in Robo1 is indicated by arrow. Figure taken from Fakuhara et al. (2008).