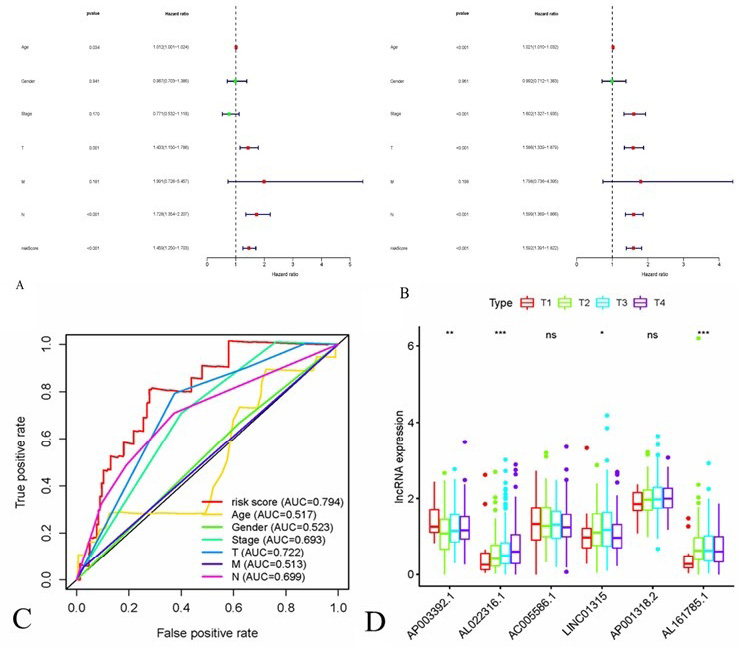
Fig. 3.
Correlations between risk score of the 10 immune-related lncRNA-based model with clinicopathological characteristics. The Cox regression analysis for evaluating the independent prognostic value of the risk score. Univariate (A) and multivariate Cox regression analyses (B). (C) A comparison of 5-year ROC curves with other common clinical characteristics. (D) The box-plot showed that The box-plot showed that there were statistical different expressions of the candidate immune-related lncRNAs in T stage.
