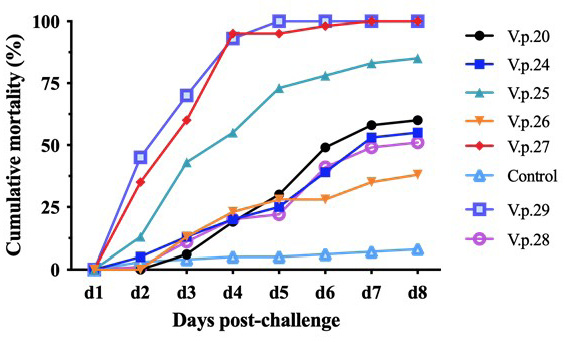
Fig. 5.
Cumulative mortality curve of V. parahaemolyticus regression infection. The abscissa represents the days post immersion challenge, and the ordinate represents the cumulative mortality. The mortality rates of V.p.25, V.p.27, and V.p.29 were significantly higher than those of V.p.20, V.p.24, V.p.26, and V.p.28. The mortality rates of V.p.20, V.p.24, V.p.26, and V.p.28 were higher than those of the control group during the regression infection experiment.