
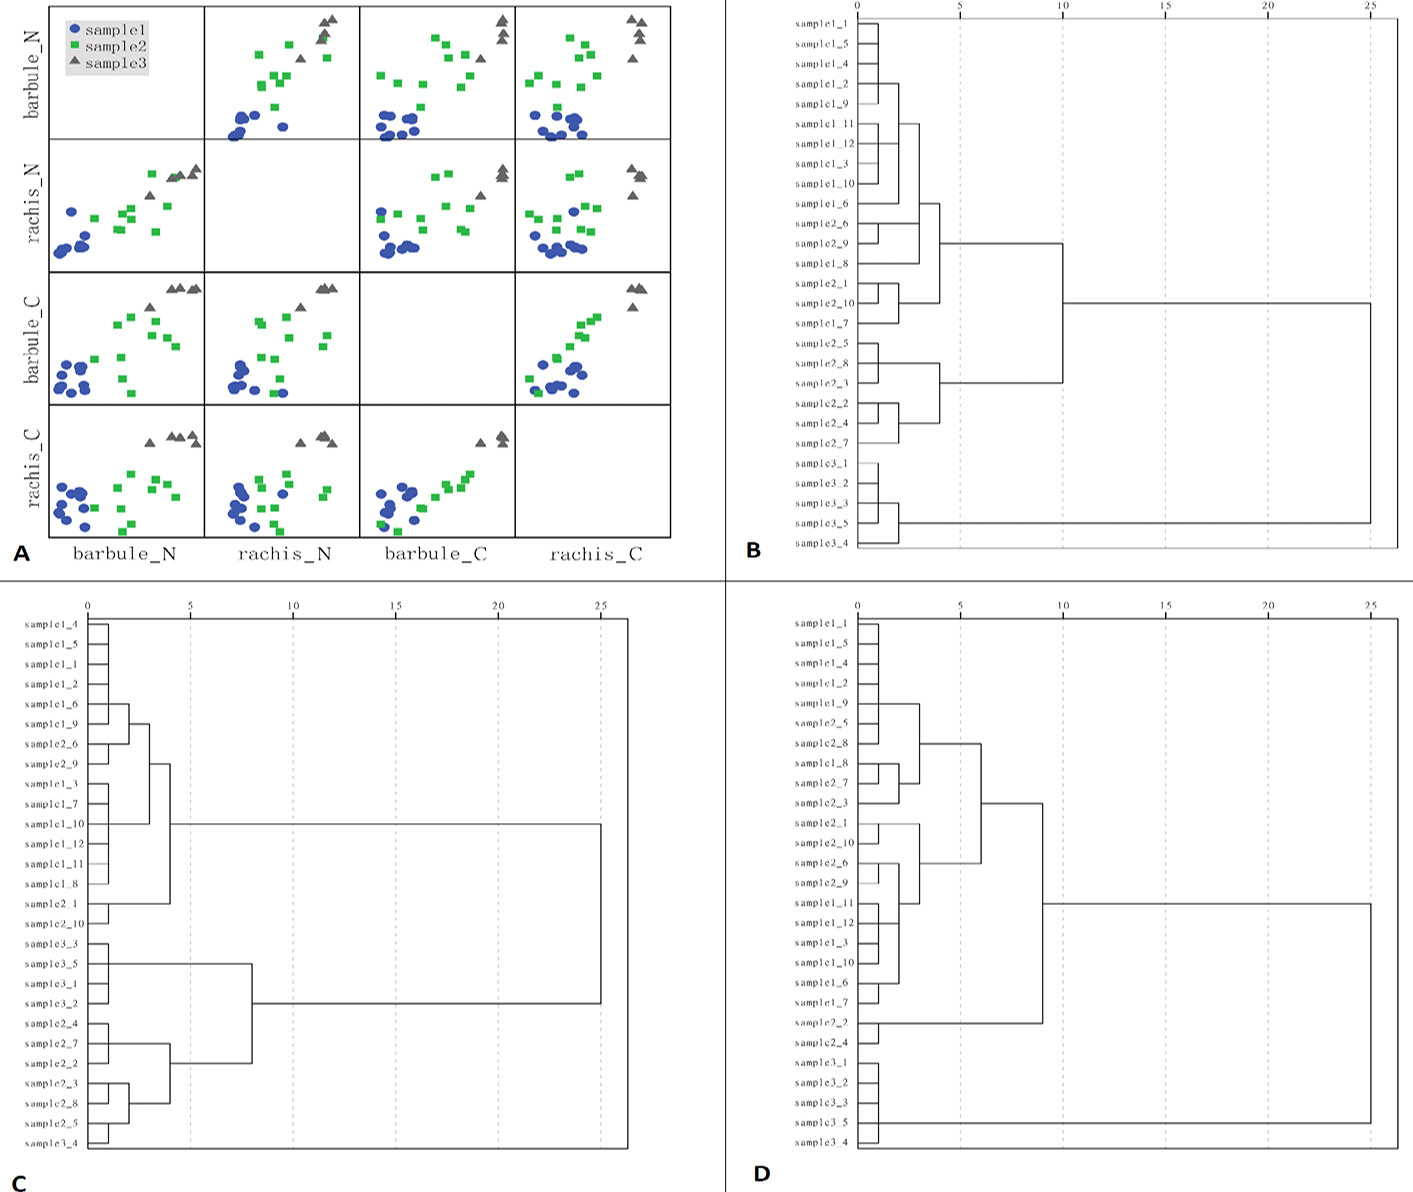
Fig. 2.
Cluster analysis based on the isotope values in different parts of the feathers. A, Scatterplot matrices from the values of δ13C and δ15N of barbules and rachis. B, Hierarchical cluster from the values of the isotopes from the barbules and rachis. C, Hierarchical cluster from the values of δ13C and δ15N from the barbules. D, Hierarchical cluster from the values of δ13C and δ15N from the rachis.